Timed practice
Full practice exams
Pick an exam. Each one shows its format first, then runs one section at a time on its own clock.
Practice Exam 1
60 multiple-choice and 6 free-response questions, in the format of the AP Biology Exam.
| Section | Questions | Time |
|---|---|---|
| Section I: Multiple Choice | 60 | 90 minutes |
| Section II: Free Response | 6 | 90 minutes |
A four-function, scientific, or graphing calculator is allowed on both sections of the exam.
How the exam works
- One section at a time. When a section's clock reaches zero, the section ends and is scored.
- Multiple choice is scored when its section ends, with an explanation for every choice.
- Free response is never scored by the page. When the section ends, you see the scoring guide and a model response for each part and tick the points your answer earns.
- At the end you get your score and the time you used for each section.
- In study mode each multiple-choice answer is checked as soon as you give it, with its explanation, and each free-response question has a button that opens its scoring guide.
- Switching to study mode partway keeps your answers and checks the ones you have given. Start over clears everything and lets you choose a mode again.
- Your answers are kept in this browser tab if the page reloads, and nowhere else.
Section I: Multiple Choice
-
Mosquito larvae hang just below the surface of a pond, held at the surface film by the tips of their breathing tubes. When a drop of detergent is added to the water nearby, the larvae can no longer cling to the surface and sink away from the air. Detergent molecules crowd in among the water molecules at the surface and get between them. Which explanation best accounts for the larvae sinking?
Answer: B.
- A
This treats the larvae as held up by buoyancy. They hang from the surface film, and a drop of detergent does not make pond water noticeably denser; denser water would hold them up better, not worse.
- B
Correct. Cohesion through hydrogen bonds between neighboring water molecules creates surface tension, the film the larvae hang from. Detergent molecules come between the surface water molecules, so fewer hydrogen bonds hold the film together and it can no longer hold the larvae at the surface.
- C
This treats adhesion as a downward pull. Adhesion is attraction between water and another surface; it does not drag an object down, and the larvae sink because the cohesive film weakens.
- D
This confuses the covalent bonds within a water molecule with the hydrogen bonds between molecules. Detergent does not split water into hydrogen and oxygen; it interferes with the attractions between molecules.
- A
-
A researcher wants to follow newly made proteins in a culture of bacteria. She will grow the bacteria with one element supplied only in a radioactive form, so that radioactivity appears in the new proteins but not in the new DNA. Which element should she supply in radioactive form?
Answer: C.
- A
Carbon is in every kind of biological macromolecule, so a carbon label would show up in the new DNA as well as in the proteins.
- B
This reverses the two molecules. Phosphorus is used to build nucleic acids and phospholipids, so it would label the new DNA, which is exactly what the design must avoid.
- C
Correct. Sulfur is used in building proteins, and nucleic acids contain none, so a sulfur label marks the new proteins while the new DNA stays unlabeled.
- D
Nitrogen is used to build nucleic acids, so a nitrogen label would appear in the new DNA. It cannot separate proteins from DNA.
- A
-
Two monomers, M1 and M2, are joined in a dimer written M1-M2, where the dash stands for the covalent bond between them. Which equation correctly represents the hydrolysis of this dimer?
Answer: D.
- A
This shows water being released as the bond breaks. Water is released when monomers are joined, not when they are separated; hydrolysis uses water.
- B
This pictures the whole water molecule becoming a bridge between the monomers. In hydrolysis, water is split, and its parts end up on two monomers that are no longer joined.
- C
This is dehydration synthesis, the reverse reaction. It joins two monomers and releases water rather than breaking the bond.
- D
Correct. In hydrolysis, water is added across the bond: the hydroxyl group goes to one monomer and the hydrogen to the other, and the two monomers separate.
- A
-
Questions 4 to 4 refer to the following.
Reindeer stand for hours on snow and ice, so the lower parts of their legs stay much colder than the core of the body. A biologist took fat samples from four places along the leg of one reindeer, measured the temperature of the tissue at each place, and found what percentage of the fatty acids in each sample were unsaturated.
Fat along a reindeer leg (illustrative data) Sample location Tissue temperature (°C) Unsaturated fatty acids (%) Near the body 37 48 Upper leg 30 55 Lower leg 20 68 Just above the hoof 10 79 Which statement best describes the relationship between tissue temperature and the fatty acids in the samples?
Answer: A.
- A
Correct. Moving down the leg, the temperature falls from 37 to 30 to 20 to 10 °C while the unsaturated share rises from 48 to 55 to 68 to 79 percent, so the two change in opposite directions at every step.
- B
This reads the trend backward. The coldest sample, just above the hoof, has the highest unsaturated share (79 percent), not the lowest.
- C
This assumes a straight-line pattern the table does not show. Cooling 7 degrees (37 to 30 °C) adds 7 points, but cooling 10 degrees (30 to 20 °C) adds 13 points, about 1.0 versus 1.3 points per degree.
- D
This mixes up saturated and unsaturated. The hoof sample is 79 percent unsaturated, so only about 21 percent saturated, the lowest saturated share of the four.
- A
-
A single strand of RNA can fold back on itself so that two stretches of its own sequence pair by hydrogen bonds, forming a hairpin. In a model of one such RNA, the stretch 5'-GCAU-3' near the 5' end of the molecule is paired with a stretch closer to its 3' end. Written from 5' to 3', what is the sequence of that paired stretch?
Answer: C.
- A
These are the correct partner bases, but written in the wrong direction. Paired stretches run antiparallel, so the partner of 5'-GCAU-3', read from its own 5' end, starts with the base that pairs with the U.
- B
This has the right order but uses thymine. Thymine is a DNA base; in RNA, adenine pairs with uracil.
- C
Correct. Pairing G-C, C-G, A-U and U-A gives the partner bases C, G, U, A lined up against 5'-GCAU-3'. Because the folded strand runs the opposite way, the partner reads 3'-CGUA-5', which is 5'-AUGC-3'.
- D
This assumes a stretch pairs with an identical copy of itself. Bases pair with complementary bases (G with C, A with U), not with the same base.
- A
-
An enzyme is made of two identical polypeptides and is active only when the two are joined. The surfaces where they touch carry amino acids with hydrophobic R groups, and hydrophobic interactions hold the two together. A mutation replaces several of those surface amino acids with amino acids that have positively charged R groups. Each polypeptide still folds into its normal shape. Which outcome is most likely?
Answer: A.
- A
Correct. Quaternary structure comes from interactions between polypeptides. Replacing the hydrophobic contact surface with positive charges on both identical chains removes the hydrophobic interactions and makes the surfaces repel, so the active pair does not form.
- B
This assumes charged R groups always attract. The two chains are identical, so both surfaces now carry positive charges, and like charges repel.
- C
This treats tertiary structure as the whole story. The enzyme works only as a pair, and all four levels of structure, including the quaternary level, determine function.
- D
This contradicts the stem, which says each chain still folds normally. Secondary structure comes from hydrogen bonds in the backbone, and a change on the contact surface does not remove it.
- A
-
Rats were given a daily dose of a drug that the liver converts into a form the body can excrete. After two weeks, electron micrographs of their liver cells showed a large increase in one membrane system, a network of branching tubules. The flattened sacs studded with ribosomes did not change in amount. Which explanation best accounts for this change?
Answer: B.
- A
Lysosomes are separate sacs that digest material taken into the cell, not a connected system of tubules, and detoxifying drugs is not their role.
- B
Correct. Smooth ER is a network of tubules without bound ribosomes, and one of its functions is detoxification. Cells processing a large daily load of the drug would be expected to build more of it.
- C
Rough ER is the membrane studded with ribosomes, and the micrographs show those sacs did not change in amount, so this does not match.
- D
The Golgi complex is a stack of flattened sacs that modifies and packages products for trafficking; it is not the tubule system that detoxifies chemicals.
- A
-
Two cells have the same volume. One is a sphere, and the other is a flat disk only a few micrometers thick. Both take in oxygen only across their plasma membranes. Which statement best explains why the flat cell can take in oxygen faster?
Answer: D.
- A
The stem gives both cells the same volume. A flat shape changes the surface, not the amount of cytoplasm to supply.
- B
This reverses the geometry. For a given volume a sphere has the least possible surface area, so the flattened cell has more membrane, and more membrane means more exchange, not less.
- C
Changing a cell's shape does not change the thickness of its membrane; the gain comes from having more membrane area.
- D
Correct. Flattening spreads the cytoplasm over more membrane, so the surface area-to-volume ratio is higher and more oxygen can cross the membrane at the same time.
- A
-
In the model of a plasma membrane, phospholipids form two layers in water, with their fatty acid tails facing each other in the interior and their phosphate heads facing the water on both sides. A student adds phospholipids to a beaker in which a layer of vegetable oil floats on water. Based on the model, how will most of the phospholipids arrange themselves at the boundary between the oil and the water?
Answer: A.
- A
Correct. The model shows that polar heads face water and nonpolar tails avoid it. At an oil-water boundary, a single layer lets every head sit in the water and every tail sit in the nonpolar oil.
- B
This copies the membrane picture without asking why it forms. A bilayer forms when there is water on both sides; at an oil-water boundary, the tails can sit in the oil directly, so one layer is enough.
- C
This treats the whole phospholipid as nonpolar. Its polar head does not mix with oil, so the molecules line up at the boundary instead of dissolving.
- D
This reverses the two regions. The phosphate head is polar and hydrophilic, so it is drawn to the water, while the nonpolar tails avoid it.
- A
-
Questions 10 to 12 refer to the following.
Paramecium is a single-celled protist that lives in fresh water and has no cell wall. Its cytoplasm has a higher solute concentration than pond water. Contractile vacuoles collect excess water from its cytoplasm and expel it from the cell. A vacuole fills because the cell uses ATP to pump ions into it, and water follows the ions by osmosis.
A student moved paramecia from one culture into sucrose solutions of different concentrations at 22 °C. Sucrose does not cross the paramecium's plasma membrane. After 10 minutes, she counted how many times one contractile vacuole emptied per minute in each of 10 cells and calculated the mean.
Contractile vacuole activity (illustrative data) Sucrose concentration (mM) Mean emptying rate (per minute) 0 15.0 25 11.4 50 7.2 100 1.8 Which statement best describes how the emptying rate changed across the sucrose solutions?
Answer: D.
- A
This imposes a pattern the data do not follow. From 25 to 50 mM the rate fell from 11.4 to 7.2, about 63 percent of its value, and from 50 to 100 mM it fell to 1.8, a quarter of its value; neither step is a halving.
- B
This reads the table backward. The highest rate, 15.0 per minute, is in plain water, and the lowest is at 100 mM.
- C
This misreads the middle rows. The rate had already fallen from 15.0 to 7.2 per minute by 50 mM.
- D
Correct. The mean rate drops at every step, from 15.0 to 11.4 to 7.2 to 1.8 emptyings per minute, as sucrose rises from 0 to 100 mM.
- A
-
Uses the material above question 10.
By what percentage did the mean emptying rate decrease when the sucrose concentration was raised from 0 mM to 50 mM?
Answer: C.
- A
This is the difference in emptyings per minute (15.0 - 7.2 = 7.8), not a percentage. It has to be divided by the starting rate.
- B
This is 7.2 divided by 15.0, which is the share of the original rate that remains (48 percent), not the share that was lost.
- C
Correct. Percent decrease = (15.0 - 7.2) / 15.0 x 100 = 7.8 / 15.0 x 100 = 52%.
- D
This divides the change by the final rate instead of the starting one: 7.8 / 7.2 x 100 = 108%. A decrease cannot be more than 100 percent of where it started.
- A
-
Uses the material above question 10.
A paramecium in the 0 mM solution is treated with a compound that stops ATP production. Which outcome is most likely?
Answer: B.
- A
Osmosis is passive: water moves toward the cytoplasm's lower water potential with no direct input of energy, so it keeps entering.
- B
Correct. Water enters passively by osmosis whether or not ATP is made, but filling a vacuole depends on pumping ions with ATP, which is active transport. With entry continuing and removal stopped, a cell with no wall swells and can burst.
- C
This reverses the direction of osmosis. The cytoplasm has more solute than the surrounding water, so water moves into the cell, not out of it.
- D
Half of this is right: osmosis needs no ATP. But removing the water depends on active ion pumping, and without it the incoming water builds up.
- A
-
Chloroplasts are thought to have evolved from free-living photosynthetic prokaryotes that were engulfed by an ancestral eukaryotic cell. Which observation is best explained by this hypothesis?
Answer: A.
- A
Correct. A cell that cannot assemble a chloroplast from its own membranes, and gets new ones only by division of existing chloroplasts or of the plastids they develop from, is behaving as if the chloroplast were once an independent cell that reproduced on its own by dividing.
- B
Which organisms have chloroplasts tells us where they are found, not where they came from. Either origin, engulfed cell or folded-in membrane, could fit that distribution.
- C
This links the organelle to its job, which shows how chloroplasts are used, not how they originated. An organelle of any origin could be more common where it is needed.
- D
Every organelle sits in cytoplasm, so this feature does not distinguish an engulfed prokaryote from a structure the cell built itself.
- A
-
An energy diagram plots energy against the progress of one reaction, with and without an enzyme. Both curves start at the reactant level of 50 units and end at the product level of 20 units. The curve without the enzyme peaks at 120 units, and the curve with the enzyme peaks at 75 units. Which statement about the reaction with the enzyme is supported by the diagram?
Answer: D.
- A
This reads the activation energy as the height of the peak above zero. Activation energy is measured from the reactants up to the peak, so it is 75 - 50 = 25 units.
- B
This takes the difference between the two peaks (120 - 75 = 45), which is how much the enzyme lowered the activation energy, not the activation energy itself, which is 75 - 50 = 25 units.
- C
The activation energy is right, but 55 units is the drop from the peak to the products (75 - 20). The energy released is the difference between reactants and products, 50 - 20 = 30 units.
- D
Activation energy runs from the reactant level to the peak: 75 - 50 = 25 units. The energy released runs from the reactants down to the products: 50 - 20 = 30 units, the same with or without the enzyme, because the enzyme changes only the peak.
- A
-
Questions 15 to 15 refer to the following.
Researchers purify an enzyme from a wood-rotting fungus and test it on three different disaccharides. Each substrate is tested in 5 tubes with the same amount of enzyme, the same substrate concentration, pH 5.0 and 30 °C. The table gives the mean rate of product formation and two standard errors of the mean (2SE).
Rate of product formation by substrate Substrate Mean rate (micromoles per minute) Plus or minus 2SE Cellobiose 6.2 0.6 Maltose 5.6 0.7 Sucrose 0.4 0.3 Based on the means and their error bars of plus or minus 2SE, which conclusion about the enzyme is best supported?
Answer: C.
- A
Cellobiose has the higher mean, but its range of 5.6 to 6.8 overlaps the maltose range of 4.9 to 6.3. Overlapping error bars of 2SE mean the data do not show a clear difference, so "faster on cellobiose" goes further than the data allow.
- B
Different means alone do not show different rates: every mean carries sampling error. The cellobiose and maltose error bars overlap, so those two rates cannot be told apart from these tubes.
- C
Mean plus or minus 2SE gives cellobiose 5.6 to 6.8, maltose 4.9 to 6.3 and sucrose 0.1 to 0.7 micromoles per minute. The first two ranges overlap, so they are not clearly different; neither overlaps sucrose, so both are clearly higher. The enzyme’s active site fits the shapes of cellobiose and maltose far better than the shape of sucrose.
- D
Error bars that do not overlap are evidence of a real difference. The sucrose range, 0.1 to 0.7, lies far below the other two, so at least those comparisons are clear.
- A
-
Questions 16 to 19 refer to the following.
Two fish species live at very different body temperatures: an Antarctic fish at about 0 °C and a desert pupfish at about 30 °C. Researchers purified the same enzyme from each species. They set up tubes holding equal amounts of enzyme and an excess of substrate at pH 7.0, brought each tube to one temperature, and measured the initial rate of the reaction.
Initial reaction rate (micromoles of product per minute) Temperature (°C) Antarctic fish enzyme Desert pupfish enzyme 0 4.0 1.0 10 7.5 2.5 20 9.0 5.0 30 3.0 9.5 40 0.5 12.0 50 0.0 6.0 Which statement correctly describes the data in the table?
Answer: A.
- A
At 0, 10 and 20 °C the Antarctic enzyme is faster (4.0, 7.5 and 9.0 against 1.0, 2.5 and 5.0). At 30, 40 and 50 °C it is slower (3.0, 0.5 and 0.0 against 9.5, 12.0 and 6.0).
- B
This assumes an enzyme works fastest at its body temperature. The Antarctic enzyme runs at 4.0 at 0 °C but 9.0 at 20 °C, so 0 °C is not its highest rate.
- C
The pupfish enzyme rises from 1.0 to 12.0 up to 40 °C, but drops to 6.0 at 50 °C, so it does not rise at every step.
- D
Only the Antarctic enzyme peaks at 20 °C (9.0). The pupfish enzyme is highest at 40 °C (12.0), so the two optimum temperatures differ.
- A
-
Uses the material above question 16.
By what percentage did the Antarctic fish enzyme's rate change when the temperature was raised from 20 °C to 30 °C?
Answer: B.
- A
This subtracts 9.0 - 3.0 = 6.0 and reports the difference as a percentage. A percent change divides the change by the starting value.
- B
Percent change = (new - old) / old x 100 = (3.0 - 9.0) / 9.0 x 100 = -66.7%, so the rate fell by about 67%.
- C
This is 3.0 / 9.0 = 33%, the share of the rate that remains, not how much it fell.
- D
This divides the change by the new value instead of the starting value: 6.0 / 3.0 x 100 = 200%. A rate cannot fall by more than 100%.
- A
-
Uses the material above question 16.
Desert pools grow more alkaline as they evaporate. The researchers propose a new investigation of whether the pupfish enzyme's rate also depends on pH. Which procedure best tests this?
Answer: D.
- A
This changes temperature along with pH. A difference in rate could come from either one, so the effect of pH cannot be separated out.
- B
This changes the amount of enzyme along with pH. More enzyme alone raises the rate, so any effect of pH is confounded with enzyme amount.
- C
This repeats the temperature series at a single pH. Taking the fish from alkaline pools does not change the pH of the reaction, so it cannot test pH.
- D
Only pH differs among the tubes, while temperature, enzyme amount and substrate are held the same as before. Any difference in rate can then be attributed to pH.
- A
-
Uses the material above question 16.
Which reasoning best explains why the Antarctic fish enzyme's rate fell from 9.0 to 0.5 between 20 °C and 40 °C, while the desert pupfish enzyme's rate rose?
Answer: B.
- A
Heating makes molecules move faster, not slower, and collisions become more frequent. The same substrate also sped up the pupfish enzyme over the same range.
- B
Temperatures above an enzyme's optimum disrupt the hydrogen bonds that hold its shape, changing the active site so substrate no longer fits. The Antarctic enzyme's structure is disrupted above 20 °C, while the pupfish enzyme keeps its shape up to about 40 °C, so its rate keeps rising with more frequent collisions.
- C
Enzymes are not consumed by the reactions they catalyze, and each temperature was a separate tube with the same amount of enzyme.
- D
This treats an enzyme as something that needs added energy. Heat speeds collisions for both enzymes; the difference is whether the enzyme keeps its shape at that temperature.
- A
-
A tube holds luciferin, oxygen and luciferase, the enzyme fireflies use to make light. The tube gives off no light until ATP is added. It then glows until the ATP has been used up. Making light requires an input of energy. Which best explains these observations?
Answer: C.
- A
This confuses lowering activation energy with supplying energy. Lowering activation energy is the enzyme's job, and the stem says the reaction needs an energy input that a catalyst cannot provide.
- B
This treats an enzyme as an energy source. Enzymes lower activation energy but supply none, and the glow ending when ATP is gone shows ATP is what is being spent.
- C
An energy-requiring reaction can run when it is coupled to an energy-releasing one. The light stops when ATP runs out, so ATP breakdown is the energy source, and luciferase only catalyzes the reaction.
- D
This reverses the direction of energy flow. ATP is used up, not made, as the tube glows, so energy moves from ATP into light.
- A
-
Human cells in culture are given glucose and plenty of oxygen. A drug is added that blocks the transport protein that carries pyruvate from the cytosol into the mitochondria. These cells, like many human cells, have an enzyme in the cytosol that can convert pyruvate to lactate. Nothing else in the cells is changed. Which outcome is most likely?
Answer: A.
- A
Pyruvate cannot reach the matrix, so the Krebs cycle releases less CO₂ from glucose. Glycolysis still makes NADH, and much of the pyruvate that builds up in the cytosol is converted to lactate, which also regenerates NAD⁺.
- B
With no pyruvate entering the mitochondria, the Krebs cycle delivers less NADH and FADH₂ to the electron transport chain, so oxygen use falls rather than rises, and the pyruvate trapped in the cytosol is turned into lactate.
- C
The Krebs cycle takes place in the mitochondrial matrix and cannot move to the cytosol, so the CO₂ it releases from glucose falls, and lactate rises rather than falls.
- D
Glycolysis makes pyruvate in the cytosol; it does not need the transporter. Blocking transport changes what happens to pyruvate afterward, not whether glycolysis runs, and the pyruvate that piles up is converted to lactate.
- A
-
When skin is cut, platelets at the wound release a growth-promoting protein. Fibroblast cells within a fraction of a millimeter of the wound start dividing, but fibroblasts a few millimeters away do not, because nearby cells quickly take up and break down the protein. Which describes this signaling?
Answer: D.
- A
This treats a different target cell type as the mark of a hormone. Local regulators also act on other cell types; what matters is that the signal only reaches nearby cells.
- B
Platelets travel in blood, but the protein is released at the wound and is gone within a fraction of a millimeter. A signal carried in the blood would reach fibroblasts far away.
- C
The protein is released into the tissue around the wound, not passed between joined cells. Platelets and fibroblasts are not linked by channels.
- D
A local regulator acts on target cells in the vicinity of the cells that release it. The protein is broken down within a fraction of a millimeter, so only nearby fibroblasts respond.
- A
-
A model shows how hormone C, a small nonpolar molecule, acts on a cell. C diffuses across the plasma membrane and binds receptor R in the cytoplasm. The C-R complex moves into the nucleus, binds DNA near certain genes and increases their transcription. Liver cells and skin cells both take up C, but only liver cells change their gene expression. Based on the model, which best explains this difference?
Answer: C.
- A
The stem says both cell types take up C, so C crosses both membranes. Being nonpolar, it can cross any plasma membrane.
- B
This assumes different cell types carry different genes. Body cells of one organism hold the same genes; they differ in which proteins they make.
- C
A cell responds to a signal only if it has a receptor that recognizes it. In the model, C acts only after binding R, so a cell that takes up C but makes no R cannot form the complex and its genes do not change.
- D
In this model the receptor sits in the cytoplasm, not on the surface. A nonpolar hormone that crosses the membrane needs no surface receptor.
- A
-
In a plant species, hormone G binds a receptor and triggers a pathway that makes stems grow long. Mutant 1 cannot make G and has short stems. Mutant 2 makes G, but a mutation in its receptor's intracellular domain stops that domain from changing shape when a ligand binds, and it also has short stems. Chemical A is not G, but it binds G's receptor and changes its shape exactly as G does. Seedlings of both mutants are sprayed with A. Which result is most likely?
Answer: B.
- A
This treats any chemical that binds the receptor as enough. Mutant 2's receptor can be bound, but its intracellular domain cannot change shape, so the signal is never passed on.
- B
Mutant 1 lacks only the signal; its receptor and pathway are normal, so A substitutes for G and the stems grow long. In mutant 2 A can bind, but the intracellular domain cannot change shape, so transduction never starts and the stems stay short.
- C
This reverses the two mutants. Mutant 2 cannot respond to any ligand, because its defect lies after binding, in the step that starts transduction.
- D
This ignores that mutant 1 has a normal receptor. Chemical A binds it and changes its shape as G would, so the pathway runs in mutant 1.
- A
-
Gland A releases hormone S, which stimulates gland B to release hormone T. T raises the metabolic rate of body cells, and T also inhibits the release of S by gland A. A person's diet lacks a nutrient that gland B needs to make T. Which change is most likely in this person's blood?
Answer: D.
- A
This reverses the feedback. T inhibits gland A, so less T means less inhibition and more S, not less.
- B
This treats negative feedback as acting in one direction only. The loop responds to T falling below its set point as well as rising above it.
- C
Stimulation cannot replace a missing raw material. However much S reaches gland B, it cannot make T without the nutrient.
- D
Gland B cannot make enough T, so T falls. T normally inhibits gland A, so with little T, gland A is released from inhibition and S rises above normal, a negative feedback loop responding to the drop.
- A
-
In a neuron, a small change in membrane voltage opens a few voltage-gated sodium channels. Sodium ions flowing in through them change the voltage further, which opens more of the channels, until nearly all of them are open. Which describes this process?
Answer: A.
- A
In positive feedback the response intensifies the stimulus that caused it. Each opened channel lets in sodium that changes the voltage further and opens more channels, moving the system ever further from its starting point.
- B
Sodium inflow increases the voltage change that opened the channels; it does not reduce it, so this is not negative feedback.
- C
The label is right but the reason is wrong. Positive feedback amplifies change rather than holding conditions steady; stability is what negative feedback does.
- D
The voltage moves further from where it started at each step; nothing here returns it to a set point.
- A
-
Cells in a culture each complete one cell cycle every 18 hours, and every cell divides by mitosis at the end of each cycle. A culture starts with 500 cells. Assuming no cells die, how many cells will it hold after 72 hours?
Answer: C.
- A
This adds 500 cells per cycle (500 + 4 x 500). Each division doubles every cell present, so the increase grows with each cycle.
- B
This doubles only three times (500 x 2 x 2 x 2). 72 hours holds 72 / 18 = 4 full cycles.
- C
There are 72 / 18 = 4 cycles, and mitosis doubles the cell number each cycle: 500 x 2 x 2 x 2 x 2 = 500 x 16 = 8,000 cells.
- D
This doubles five times, counting the starting culture as a division. Four cycles give four doublings.
- A
-
A drawing made from a microscope image shows a dividing cell with a complete nucleus at each end. Across the middle of the cell, a line of small vesicles is fusing into a flat structure that grows outward from the center until it meets the cell wall. Which does the drawing show?
Answer: B.
- A
A cleavage furrow pinches the cell inward from the outside, and animal cells have no cell wall. This structure grows from the center outward.
- B
Two finished nuclei mean telophase is done, and a structure built from fusing vesicles that grows from the center out to the cell wall is a cell plate, how plant cells divide their cytoplasm.
- C
Metaphase comes before the new nuclei form. The drawing shows a complete nucleus at each end, so the cell is past mitosis, and the line in the middle is vesicles, not chromosomes.
- D
In prophase there is one nucleus, not two. The drawing shows two complete nuclei, so the cell is at the end of division, not the start.
- A
-
A researcher hypothesizes that drug Z blocks the checkpoint that keeps cells with damaged DNA from entering mitosis. She exposes a culture to radiation that damages DNA, adds Z dissolved in a solvent, and measures the percentage of cells that enter mitosis over 6 hours. Which additional group is needed to show that any change in this group is caused by Z rather than by the solvent?
Answer: A.
- A
A control should differ from the treated group in only the variable being tested. Same radiation, same solvent and no Z leaves Z as the only difference, so any change in the treated group can be credited to Z.
- B
This group differs from the treated group in three ways at once, so it cannot separate the effect of Z from the effect of the solvent or the radiation.
- C
This tests whether a larger dose has a larger effect. Both groups still get the solvent, so neither shows what the solvent alone does.
- D
This changes the radiation and keeps Z and the solvent, so it tests what Z does to undamaged cells, not whether the solvent caused the change.
- A
-
A chemical prevents the breakdown of the proteins that hold sister chromatids together at the centromere. It is added to a culture of diploid cells just as they begin meiosis. Which outcome is most likely?
Answer: B.
- A
This treats the separation of homologs as if it needed the centromere proteins to break down. In anaphase I the sister chromatids are supposed to stay joined; homologs part without that breakdown, so meiosis I can finish.
- B
In anaphase I homologous chromosomes separate while sister chromatids remain attached, so meiosis I is unaffected. In anaphase II the proteins at the centromeres must break down for sister chromatids to be pulled apart, and the chemical prevents that.
- C
This reverses the two divisions. Keeping the centromere proteins intact makes sister chromatids harder to separate, not easier, and sisters do not separate in anaphase I in normal meiosis either.
- D
Crossing over is an exchange between non-sister chromatids of homologs during prophase I. It does not depend on the centromere proteins breaking down, which happens later, in anaphase II.
- A
-
A student models meiosis I in a cell with 2n = 4 using pipe cleaners. One homologous pair is a long red chromosome (maternal) and a long blue chromosome (paternal); the other pair is a short red and a short blue. In the student's metaphase I, the long red and short red chromosomes face one pole and the long blue and short blue face the other. Which change would let the model show a different combination of whole chromosomes in the gametes, one that arises from random assortment of homologous pairs?
Answer: C.
- A
Turning both pairs still puts both red chromosomes in one cell and both blue in the other, the same two combinations as before. A new combination needs the pairs to line up independently of each other.
- B
Lining chromosomes up singly is how they sit in mitosis, not in metaphase I, where homologs line up as pairs. This would not separate homologs at all.
- C
Each pair lines up independently of the other at metaphase I. Turning one pair gives gametes with long red plus short blue and long blue plus short red, two combinations the first arrangement could not produce.
- D
Trading segments models crossing over, which makes recombinant chromatids within a chromosome. It does not change which whole chromosomes go to each pole, which is what random assortment is.
- A
-
In a species of tree frog, spotted skin (S) is dominant to unspotted skin (s), and the gene is autosomal. Two spotted frogs are mated, and their offspring include both spotted and unspotted frogs. A student claims that both parents are heterozygous (Ss). Which evidence best supports the claim?
Answer: D.
- A
This is true of every offspring of any two diploid parents, so it cannot tell heterozygous parents from homozygous ones. A true statement is not evidence unless it bears on the claim.
- B
This confuses dominance with how common an allele is. Which phenotype is more common among these offspring says nothing about allele frequency, and it does not show that either parent carries s.
- C
A spotted phenotype only shows each parent has at least one S. Two copies of S would contradict the claim, and the unspotted offspring rule it out.
- D
An unspotted offspring is ss, so it got an s from the mother and an s from the father. Each spotted parent must therefore carry one s along with its S, which makes both Ss.
- A
-
Questions 33 to 35 refer to the following.
In a species of beetle, gene B controls body color (B, black, is dominant to b, brown) and gene L controls antenna length (L, long, is dominant to l, short). A beetle that inherited the B and L alleles from one parent and the b and l alleles from the other (genotype BbLl) is crossed with a brown beetle with short antennae (genotype bbll). The offspring are counted.
Offspring of the cross BbLl x bbll Offspring phenotype Number of offspring Black body, long antennae 412 Brown body, short antennae 398 Black body, short antennae 46 Brown body, long antennae 44 Which statement correctly describes the offspring counts in the table?
Answer: D.
- A
A 1:1:1:1 ratio is what unlinked genes would give in this cross, but here two classes have about 400 offspring each and two have about 45, roughly 9 to 1.
- B
This reads the 9 to 1 contrast between classes as if it were a contrast between colors. Adding the classes gives 458 black (412 + 46) and 442 brown (398 + 44), about 1:1.
- C
A 3:1 ratio is expected when two heterozygotes are crossed, not in a cross with a homozygous recessive parent. The table gives 456 long (412 + 44) and 444 short (398 + 46), about 1:1.
- D
Black is 412 + 46 = 458 and brown is 398 + 44 = 442; long is 412 + 44 = 456 and short is 398 + 46 = 444. Each gene alone gives about 1:1, as expected when a heterozygote is crossed with a homozygous recessive.
- A
-
Uses the material above question 33.
Based on the data, what is the distance between genes B and L on the chromosome?
Answer: B.
- A
This counts only one recombinant class, 46 / 900. Both black-short and brown-long offspring are recombinant, and both belong in the count.
- B
The parent inherited B with L and b with l, so black-short and brown-long are recombinant: 46 + 44 = 90 of 412 + 398 + 46 + 44 = 900 offspring. 90 / 900 = 0.10, or 10 percent, which is 10 map units.
- C
This divides the recombinants by the parental offspring, 90 / 810. Map distance is the percent of all offspring that are recombinant, so the denominator is all 900.
- D
This is the percent of offspring with parental combinations, 810 / 900. Map distance comes from the recombinant share, not the parental share.
- A
-
Uses the material above question 33.
A student claims that in crosses like this one, the two recombinant classes of offspring should be about equal in number, as the table shows. Which reasoning best justifies the claim?
Answer: C.
- A
Codominance describes two alleles of one gene both showing in a heterozygote. These are two different genes, each with a dominant allele, so codominance does not apply.
- B
Every gamete of the bbll parent carries b and l, so it cannot supply a recombinant combination. The offspring classes reflect the gametes of the BbLl parent.
- C
A crossover between B and L swaps segments between two non-sister chromatids, turning one into B-l and the other into b-L. Every such event makes one of each, so the two recombinant gamete types, and the offspring classes they give, occur about equally.
- D
Nothing in the cross suggests recombinant gametes are fertilized less often. Even if they were, that would lower both recombinant classes and would not explain why they equal each other.
- A
-
A student builds a model of double-stranded DNA from paper cutouts. Each purine cutout is a double ring 2 cm wide, and each pyrimidine cutout is a single ring 1 cm wide. The student pairs A with G in some rungs, C with T in others, and A with T or G with C in the rest, so the rungs are 4 cm, 3 cm or 2 cm wide. Which statement explains why the rungs of real DNA are all the same width?
Answer: A.
- A
Adenine pairs with thymine and guanine with cytosine, so every rung is one double ring and one single ring. Each pair is the same width, which keeps the width of the double helix constant.
- B
Adenine and guanine are purines, with a double-ring structure. Only the pyrimidines (cytosine, thymine and uracil) have a single ring.
- C
A-T and G-C pairs do not form the same number of hydrogen bonds, and the number of bonds is not what sets the width of a pair. The ring sizes of the paired bases set it.
- D
One strand can hold the four bases in any amounts. Base pairing makes A equal T and G equal C across the two strands together, and the model's problem is the pairing, not the amounts.
- A
-
In a strain of yeast, a mutation makes helicase stop working at 37 °C, although it works normally at 25 °C. Cells that are copying their DNA at 25 °C are moved to 37 °C. Which change in DNA replication is most likely?
Answer: C.
- A
This is the effect of losing topoisomerase, which relaxes supercoiling ahead of the fork. Without helicase the strands are not unwound, so supercoiling ahead of the fork would not grow.
- B
Joining lagging-strand fragments is the job of ligase, not helicase. Without helicase, no new fragments would be made to join.
- C
Helicase unwinds the two strands at each replication fork. When it stops, no new single-stranded template is exposed, so DNA polymerase soon runs out of template on both the leading and lagging strands.
- D
Both strands need single-stranded template, and helicase supplies it for both. The leading strand is made continuously, but only as fast as helicase opens the DNA ahead of it.
- A
-
In a line of human cells, a mutation disables the enzyme that adds the poly-A tail to mRNA. The gene for protein Q is transcribed at its normal rate, and its transcript is capped and spliced normally. Compared with normal cells, which result is most likely?
Answer: D.
- A
This assumes only coding sequence matters. The tail codes for no amino acids, but it affects how long the mRNA survives, and so how much protein is made from it.
- B
This gives the tail the job of the cap. The GTP cap helps the ribosome recognize the mRNA, and the cap is added normally here, so some protein Q is still made.
- C
The stem says splicing is normal, so the introns are removed. Losing the tail does not put introns back into the mature mRNA.
- D
The poly-A tail makes mRNA more stable. Without it, each mRNA for protein Q lasts a shorter time, so fewer rounds of translation happen and less protein Q is made.
- A
-
Part of the template strand of a gene reads 3'-TAC CGT AAG-5', where TAC is the template for the start codon. Which anticodon is on the tRNA that pairs with the second codon of the mRNA made from this template?
Answer: B.
- A
These are the right bases written in the wrong direction. The anticodon pairs antiparallel with the codon 5'-GCA-3', so its 3' end lines up with the codon's 5' end: 3'-CGU-5'.
- B
The mRNA is complementary to the template: 5'-AUG GCA UUC-3'. The second codon is 5'-GCA-3', and the anticodon pairs with it antiparallel, A with U and G with C, giving 3'-CGU-5'.
- C
This copies the codon instead of pairing with it. An anticodon is complementary to the codon, so G must face C and A must face U.
- D
This uses thymine, a DNA base. tRNA is RNA, so it carries uracil where the DNA template has thymine.
- A
-
Questions 40 to 40 refer to the following.
Researchers grow a line of mouse cells in a medium containing a drug that blocks the addition of methyl groups to newly made DNA. Once a week they measure the percent of sites in the promoter of gene G that are methylated and the amount of gene G mRNA in the cells.
Promoter methylation and mRNA of gene G during drug treatment Week Promoter sites methylated (%) Gene G mRNA (relative units) 0 82 3 1 61 11 2 38 46 3 15 120 Which statement best describes the methylation and mRNA measurements?
Answer: A.
- A
Methylation fell every week, from 82% to 15%, while mRNA rose every week, from 3 to 120 units. The largest weekly rise, 74 units, came between weeks 2 and 3.
- B
Methylation fell by 21, 23 and 23 points (82 to 61 to 38 to 15), about the same amount each week. Halving would give about 82, 41, 20 and 10.
- C
The weekly increases are 8, 35 and 74 units (11 - 3, 46 - 11, 120 - 46), so the rise grows larger each week rather than staying the same.
- D
This reverses the relationship. Methylation was highest, 82%, at week 0, when mRNA was lowest, 3 units.
- A
-
A researcher hypothesizes that gene K is transcribed in liver cells only when transcription factor F binds an enhancer near the gene. She deletes the enhancer in a culture of liver cells and measures gene K mRNA. Which additional group is the most appropriate control?
Answer: A.
- A
The independent variable is whether the enhancer is present. Liver cells from the same culture with the enhancer intact differ only in that, so any drop in gene K mRNA in the deletion group can be traced to the missing enhancer.
- B
This adds temperature as a second variable while keeping the deletion. It gives no comparison with cells that still have the enhancer.
- C
Measuring the same treated cells later is a repeat measurement, not a control. Every group in it still lacks the enhancer.
- D
This changes the cell type, not the enhancer, so it cannot show what deleting the enhancer did in liver cells. A control should differ from the treated group only in the independent variable.
- A
-
Strain 1 of a bacterium carries a plasmid with a gene for antibiotic resistance; strain 2 lacks the plasmid and is killed by the antibiotic. When the strains are grown on opposite sides of a filter that lets fluid, free DNA and viruses through but not cells, strain 2 stays sensitive. When they are grown mixed together, some strain 2 cells become resistant. Which process best explains how strain 2 gained resistance?
Answer: C.
- A
Viruses also pass through the filter, so virus-carried transfer would have worked across it. It did not.
- B
Free DNA passes through the filter, so transformation would have given resistance in the filter setup too. It did not.
- C
The filter lets free DNA and viruses pass, yet no resistance appears until the cells can touch. That points to conjugation, in which DNA such as a plasmid passes directly from one cell to another.
- D
Transposition moves DNA segments within or between DNA molecules of a cell, but it does not bring a gene from another cell. Strain 2 had no resistance gene to move until it received one.
- A
-
In gel electrophoresis, DNA fragments are loaded into wells at the end of the gel near the negative electrode, and a current is run through the gel. Which statement best explains why the smallest fragments end up farthest from the wells?
Answer: B.
- A
This has the charge backward. A longer fragment has more phosphate groups and so more total negative charge, yet it moves more slowly. The difference comes from the gel, not the charge.
- B
Every DNA fragment is negatively charged along its sugar-phosphate backbone, so all move toward the positive electrode. The gel is a mesh, and shorter fragments pass through it faster, so they travel farthest in the same time.
- C
DNA fragments of every size are negatively charged. None is held back by attraction to the negative electrode; all move away from it.
- D
Fragments move through the gel toward the positive electrode, not upward. How far a fragment travels depends on its size moving through the mesh, not on sticking or floating.
- A
-
A copepod (a tiny crustacean) in a pond comes in two inherited body forms, small and large. In years when a fish that hunts by sight is in the pond, small copepods leave more offspring that survive to reproduce. In years without the fish, large copepods leave more surviving offspring, because they outcompete small ones for food. Over 20 years the fish is present in some years and absent in others, in no regular pattern. Which prediction about the copepod population over those 20 years is best supported?
Answer: D.
- A
Egg count is a proxy, not fitness. Fitness is offspring that survive to reproduce, and in fish years the small form wins on that measure, so the large form cannot steadily take over.
- B
Doing well in some years does not freeze the shares. Each year one form leaves more surviving offspring than the other, so the shares keep moving with the conditions.
- C
Body form here is inherited. Selection changes which forms are common among the offspring; it does not make each individual adjust its own size to the year.
- D
Selection follows the environment. In a fish year small copepods leave more surviving offspring, so the next generation holds a larger share of the inherited small form; in a fishless year the advantage flips to the large form. A fluctuating environment changes the direction of selection from one generation to the next.
- A
-
Deer mice live from sea level up to mountain slopes above 4,000 meters, where each breath brings in much less oxygen. Mice in high-altitude populations far more often carry hemoglobin variants that bind oxygen more tightly than the variants common in lowland mice. Which explanation best connects this molecular variation to the fitness of the mice?
Answer: A.
- A
Variation in a molecule changes how well an organism works in a particular environment. Where oxygen is scarce, mice whose hemoglobin picks up more of it can forage, stay warm and breed, so they leave more surviving offspring and the tight-binding variants become common at altitude.
- B
Nothing in the data ties the variants to body size, and size alone would not settle the question anyway. What counts is how many offspring survive to breed, and that is what the oxygen advantage changes.
- C
The data contradict this: the tight-binding variants are rare in lowland mice. A variation that helps in one environment can be neutral or harmful in another.
- D
This treats the environment as reshaping each mouse's protein. The variants are inherited differences that already exist; thin air decides which mice leave more offspring, not what their hemoglobin is.
- A
-
Cabbage, broccoli, kale and kohlrabi all descend from one wild mustard species. Over many centuries, growers in different places saved seed from different plants: some chose plants with large leaves, some chose plants with dense clusters of flower buds and some chose plants with thick stems. Which statement best explains how such different crops arose from one species?
Answer: D.
- A
Changes made to a plant during its life, such as trimming, are not inherited. Only the genetic variation passed in seed can change a line.
- B
Mutations are not produced to order. Growers chose among variation that was already there; wanting a trait does not cause the mutations that make it.
- C
This describes natural selection, where the environment decides who reproduces. In these crops the growers chose the seed plants on purpose.
- D
This is artificial selection: people, not the environment, chose which plants left offspring. Each group of growers kept a different trait, so inherited variation in each line moved in its own direction until the lines looked like different vegetables.
- A
-
Two populations of a wildflower grow on neighboring hillsides that have different soils. Each spring, wind carries some pollen from each hillside to the other, where it fertilizes flowers. At several genes, the allele frequencies are nearly the same on both hillsides. If a change in the prevailing winds stopped all pollen movement between the hillsides, which outcome is most likely over many generations?
Answer: B.
- A
A shared ancestor does not hold frequencies still. The populations are alike now because pollen keeps mixing them; without that mixing they diverge.
- B
Gene flow keeps populations alike by mixing their alleles every generation. Once it stops, chance changes and selection by the different soils act on each population alone, so the allele frequencies drift and are pushed apart.
- C
Being apart is not the same as being reproductively isolated. Speciation takes many generations of divergence; pollen carried by hand between the hillsides right away could still fertilize the other population's flowers.
- D
Mutation arises within each population. Pollen moves alleles between populations, but it is not where new alleles come from.
- A
-
A population of 2,500 tree frogs is in Hardy-Weinberg equilibrium for a gene that controls skin color. Green (G) is dominant to blue (g), and 400 of the frogs are blue. About how many of the frogs are heterozygous (Gg)?
Answer: D.
- A
This uses 0.16 as the frequency of g. The value 400/2,500 = 0.16 is q², the frequency of blue frogs, so q is its square root. Using q = 0.16 and p = 0.84 gives 2(0.84)(0.16)(2,500) = 672.
- B
This is the number of GG frogs, p²N = (0.6)²(2,500) = 900, not the heterozygotes.
- C
This takes half of the 2,100 green frogs as heterozygous. The green frogs split into p² and 2pq, which are not equal here.
- D
q² = 400/2,500 = 0.16, so q = 0.4 and p = 1 - 0.4 = 0.6. The heterozygote frequency is 2pq = 2(0.6)(0.4) = 0.48, and 0.48 × 2,500 = 1,200 frogs.
- A
-
Questions 49 to 49 refer to the following.
A cliff exposes undisturbed layers of sedimentary rock. Two of the layers are beds of volcanic ash, whose crystals can be dated by the decay of radioactive isotopes. The table lists the layers from the top of the cliff (layer 1) to the bottom (layer 5).
Rock layers in the cliff, top to bottom Layer Rock and contents Measured age 1 Sandstone with fossil snail shells Not dated 2 Volcanic ash 41 million years 3 Shale with fossils of an early relative of horses Not dated 4 Volcanic ash 47 million years 5 Limestone with no fossils Not dated Based on the rock layers, which is the best estimate of the age of the fossils in layer 3?
Answer: C.
- A
This would fit a fossil above the 41-million-year ash, as in layer 1. Layer 3 lies below that ash, so it was laid down before it.
- B
This reverses the order of the layers. Layer 3 lies above the 47-million-year ash, so it formed after that ash fell.
- C
In undisturbed layers, deeper rock is older. Layer 3 sits above the 47-million-year ash and below the 41-million-year ash, so it formed between those dates, and its fossils have the same age range.
- D
Fossils can be dated by the ages of the rocks around them, not only by dating their own layer. Dated layers above and below set the range.
- A
-
Questions 50 to 50 refer to the following.
A biologist studies five living beetle lineages: four cave lineages, P, Q, R and S, and an out-group, O, that lives outside caves. For each lineage the table shows whether four traits are present (1) or absent (0). The ancestral condition, seen in the out-group, is separate wing covers, antennae with 11 segments, working eyes and dark body color.
Traits of the five beetle lineages Lineage Fused wing covers Antennae with 12 segments Eyes lost Pale body color O (out-group) 0 0 0 0 P 1 0 0 0 Q 1 1 0 0 R 1 1 1 0 S 1 1 1 1 Which cladogram is best supported by the traits in the table?
Answer: B.
- A
This reads the lineage with the most derived traits as the oldest. S has the most changes from the out-group, so it branches last, not first.
- B
Shared derived characters group lineages. All four have fused wing covers, so they share an ancestor apart from O. Q, R and S also share 12-segment antennae, so P branches first; R and S also share lost eyes, so Q branches next; pale color is S's alone.
- C
This ignores a shared derived character. Q has 12-segment antennae, which it shares with R and S but not P, so Q groups with R and S and P is the one that branches off first.
- D
A trait that is lost during evolution is still a derived change from the ancestral condition. Losing eyes, shared by R and S, groups them like any gained trait.
- A
-
Two populations of a salamander live on either side of a dry valley and have not met for thousands of years. A researcher wants to test whether a post-zygotic barrier has formed between them. Which procedure best tests this?
Answer: C.
- A
Courtship and mating happen before a zygote forms, so this tests for a pre-zygotic barrier, not a post-zygotic one.
- B
Differences in appearance do not show whether two populations can produce viable, fertile offspring. Very different-looking populations can interbreed freely.
- C
A post-zygotic barrier acts after a zygote forms: hybrids fail to develop, die young or cannot reproduce. Raising hybrids and testing their fertility measures that directly, and crosses within each population are the control showing what normal survival and fertility look like.
- D
Genetic distance shows how far the populations have diverged, but not whether their hybrids survive and reproduce. Isolation has to be tested with offspring.
- A
-
On reef X, the colonies of a branching coral belong to dozens of genetically different lines. On reef Y, nearly all the colonies are pieces of a single line that spread by breaking apart. The reefs had about the same coral cover before a marine heat wave. A year later, reef X kept 40% of its coral cover and reef Y kept 3%. A biologist claims that the genetic variation on reef X explains its better survival. Which reasoning best supports the claim?
Answer: A.
- A
Genetic diversity raises the chance that some individuals already carry alleles that let them withstand a new pressure. Those colonies survived and kept reef X's cover up, while reef Y's single line responded to the heat almost as one.
- B
Organisms do not change their alleles in response to a pressure. The heat sorted among variation that existed before it came.
- C
Variation means the colonies differ from one another, not that each colony is equally tough. The heat killed some lines on reef X and spared others.
- D
Both percentages are shares of each reef's own starting cover, and the cover was about the same. The same death rate would leave the same share on both reefs.
- A
-
Geological evidence shows that Earth's environment was too hostile for life until about 3.9 billion years ago, and the earliest fossil evidence for life dates to about 3.5 billion years ago. Suppose new rock evidence showed that conditions stayed too hostile for any life anywhere on Earth until 3.7 billion years ago, and the fossil dates held. How would the plausible range of dates for the origin of life change?
Answer: A.
- A
The range is bounded by the earliest time life was possible and the earliest fossils. Moving the first bound to 3.7 billion years while the fossils stay at 3.5 billion years narrows the range to the time between them.
- B
Earth formed about 4.6 billion years ago, but life could not arise while conditions were too hostile. The new evidence moves the start of the range later, not earlier.
- C
Both lines of evidence set the range, not the fossils alone. A later end to the hostile period removes 3.9 to 3.7 billion years from it.
- D
The oldest fossil shows life was present by then, not that it began then. Life must have arisen some time before its earliest known fossils.
- A
-
In one species of spider, individuals live in colonies that build and share a single large web. Researchers find that spiders in shared webs catch larger insects, and leave more offspring that survive to adulthood, than spiders of the same species that build webs alone. The tendency to join a colony is inherited. Which statement best explains how this cooperative behavior could become more common in the species?
Answer: D.
- A
The data show the reverse: colony spiders leave more surviving offspring. Cooperative behavior spreads because it raises the fitness of the individuals that do it.
- B
Habits learned during a lifetime are not written into genes. The tendency spreads because it is already inherited and its carriers leave more offspring.
- C
Extra energy matters only if it turns into more young that live to breed. The researchers counted surviving offspring directly, and that count is what favors colony spiders.
- D
Behaviors that increase survival and reproduction are favored by selection. Here cooperators leave more offspring that survive, and the tendency is inherited, so each generation holds a larger share of spiders that join colonies.
- A
-
A model of carbon in a grassland has three reservoirs: the atmosphere, living plants and soil organic matter. Four arrows move carbon among them: photosynthesis (atmosphere to plants), plant respiration (plants to atmosphere), death and shedding of plant parts (plants to soil organic matter) and decomposition (soil organic matter to atmosphere). Over one year, the carbon stored in the living plants increased. According to the model, which must be true for that year?
Answer: C.
- A
This compares arrows that do not both touch the plant reservoir. Decomposition moves carbon between the soil and the atmosphere, so it does not decide whether the plants gained carbon.
- B
Respiration releases carbon from plants to the atmosphere. If it moved more carbon than photosynthesis, the plants would lose carbon, not store more.
- C
Matter is conserved, so a reservoir grows only if more carbon flows in than out. The only arrow into living plants is photosynthesis, and the two arrows out are respiration and the death of plant parts, so photosynthesis must exceed both together.
- D
This describes a gain in the soil reservoir, which could happen whether or not the plants gained carbon. It is not required by a gain in living plants.
- A
-
Questions 56 to 59 refer to the following.
A student grows duckweed, a small floating plant that reproduces by budding off new fronds (leaf-like units), in a tank of pond water under steady light. The tank starts with 20 fronds, and the student counts the fronds once a week. No fronds are added or removed by hand.
Duckweed fronds in the tank Week Number of fronds 0 20 1 40 2 80 3 156 4 290 5 470 6 610 7 668 8 690 9 695 10 692 Which statement best describes the frond counts over the 10 weeks?
Answer: B.
- A
The weekly increases are not equal: they rise from 20 to 180 fronds and then fall. A steady increase of the same number would plot as a straight line.
- B
From 20 to 40 to 80 to 156, each count is about twice the one before. After week 5 the weekly increases shrink (140, 58, 22) until the count stays near 690 from week 8 to week 10.
- C
This confuses doubling with the size of the increase. The first week added only 20 fronds; the largest increase, 180, came between weeks 4 and 5.
- D
Doubling stops after about week 3. Ten doublings from 20 would give more than 20,000 fronds, not about 700.
- A
-
Uses the material above question 56.
Early on, the duckweed grew without constraints. Using dN/dt = r_max N, with the change from week 0 to week 1 as dN/dt and the week 0 count as N, what is r_max?
Answer: B.
- A
This divides the change by the week 1 count: 20/40 = 0.5. The equation uses the population size at the start of the interval, 20 fronds.
- B
dN/dt = 40 - 20 = 20 fronds per week and N = 20, so r_max = (dN/dt)/N = 20/20 = 1.0 per week. Each frond added about one new frond per week.
- C
This is the ratio of the two counts, 40/20 = 2.0. That is how many times larger the population became, not the per capita growth rate.
- D
This is dN/dt itself, 20 fronds per week. The per capita rate divides that change by N.
- A
-
Uses the material above question 56.
The student hypothesizes that the growth leveled off because the fronds covered the water surface and shaded one another, not because the pond water ran out of nutrients. Which new experiment best tests this hypothesis?
Answer: C.
- A
Repeating the experiment checks that the result is reliable, but space and nutrients run short together in both tanks, so it cannot tell the two explanations apart.
- B
Adding a competitor changes the population in a new way, but whatever happens to the count cannot tell shading apart from nutrient shortage, because the newcomer would both shade the duckweed and take up nutrients. The experiment does not isolate the variable the hypothesis names.
- C
Holding the volume of the same water constant keeps the total nutrients equal, while a wide, shallow tank gives the fronds more room to spread than a narrow, deep one before they shade one another. If shading limits growth, the wider tanks should level off at higher counts; if nutrients limit it, all tanks should level off near the same count.
- D
More frequent counts describe the growth curve in more detail but change nothing about space or nutrients, so they cannot test what causes the leveling off.
- A
-
Uses the material above question 56.
The student sets up a second tank exactly like the first, but starts it with 200 fronds instead of 20. Which prediction about the second tank is best supported?
Answer: A.
- A
The carrying capacity depends on the resources of the tank, which are the same, so the count should again level off near 690. Starting closer to that number, it gets there in fewer weeks.
- B
Exponential growth cannot continue in a tank with limited resources. Ten doublings from 200 would far exceed what the first tank could hold.
- C
The timing depends on how far the population starts below the carrying capacity. Starting with 200 fronds, it needs fewer weeks of growth than a tank starting with 20.
- D
Carrying capacity is set by the available resources, not by the starting population. An identical tank supports about the same number of fronds.
- A
-
On a rocky shore, barnacle species C lives only high on the rocks, and barnacle species B lives lower down. A biologist claims that competition with species B keeps species C out of the lower zone. Which observation would best support this claim?
Answer: D.
- A
Sharing a food source shows the species could compete, but not that competition sets where C lives. Another factor, such as being eaten by predators below, could still explain it.
- B
This tests what limits species B in the upper zone, not what limits species C in the lower zone. It cannot show that B excludes C.
- C
Growth alone in a tank says nothing about what happens when the two species meet on the shore, so it does not show that B keeps C out.
- D
If species C can live in the lower zone once species B is gone, the lower zone itself is not too harsh for C. That points to the presence of B as what keeps C out, which is what the claim says competition does.
- A
Section II: Free Response
-
Question 1: Interpreting and Evaluating Experimental Results 9 points
A biologist purifies enzyme G from a bacterium that lives in garden soil. Enzyme G converts one substrate into one product, and the product can be measured as it forms. The reaction is reversible: enzyme G can also convert product back into substrate.
Experiment 1. The biologist sets up tubes that each hold the same volume of buffer at pH 7.0 and the same concentration of substrate. Each tube is brought to one temperature, the same amount of enzyme G is added, and the rate of product formation is measured over the first two minutes. One extra tube at 40 °C gets substrate and buffer but no enzyme.
Experiment 2. Three samples of enzyme G are held in buffer at different temperatures for different times, then brought to 40 °C and given substrate. The rate is measured at 40 °C, as in Experiment 1.
Experiment 1: rate of product formation by enzyme G
Each point is one tube with enzyme. The tube with no enzyme, at 40 °C, formed no measurable product.
Experiment 1 data Temperature (°C) Rate (micromoles per minute) 10 1.2 20 2.3 30 4.1 40 6.0 50 4.4 60 1.0 70 0.1 40, no enzyme 0.0 Experiment 2: every sample was brought to 40 °C before its rate was measured Sample Treatment before the rate was measured Rate at 40 °C (micromoles per minute) 1 Held at 40 °C for 10 minutes 6.0 2 Held at 70 °C for 10 minutes 4.8 3 Held at 70 °C for 60 minutes 0.3 Respond to parts A, B, C and D.
-
A.
Describe how a temperature well above 40 °C affects the structure of enzyme G and its ability to bind its substrate.
Score part A
Model response
Well above 40 °C, the extra thermal energy disrupts the hydrogen bonds and other interactions that hold enzyme G in its folded shape. The protein partly unfolds, so the active site changes shape. Substrate molecules then fit the active site poorly or not at all, and fewer reactions are catalyzed.
-
B.
i. Identify the independent variable in Experiment 1.
ii. Justify the biologist's use of the tube with no enzyme.
iii. Justify keeping the pH and the substrate concentration the same in every tube of Experiment 1.
Score part B
Model response
i. Temperature.
ii. The tube with no enzyme is a negative control. It formed no product, which shows the substrate does not turn into product on its own at 40 °C. So the product measured in the other tubes was made by enzyme G.
iii. pH affects the shape of the enzyme, and substrate concentration affects how often enzyme and substrate molecules collide. Either one could change the rate. Holding both the same in every tube means a difference in rate between tubes can be attributed to temperature alone.
-
C.
i. Using the data from Experiment 2, calculate the rate of Sample 2 as a percentage of the rate of Sample 1.
ii. Based on the data, describe the effect of the time enzyme G spends at 70 °C on the rate it shows after it is cooled to 40 °C.
iii. In Experiment 1, enzyme G's rate at 70 °C was 0.1 micromoles per minute. Explain why Sample 2, which was also held at 70 °C, shows a much higher rate when measured at 40 °C.
Score part C
Model response
i. $\frac{4.8}{6.0} \times 100 = 80\%$.
ii. The longer the enzyme stays at 70 °C, the less activity it has once cooled. After 10 minutes it still runs at 4.8, 80% of Sample 1. After 60 minutes it runs at only 0.3, 5% of Sample 1.
iii. At 70 °C enzyme G is denatured, so while it is hot it barely works (0.1). For most of the molecules held there only 10 minutes, the change is reversible: when the sample cools to 40 °C, they refold, the active site regains its shape, and they catalyze the reaction again.
-
D.
The biologist repeats the 40 °C tube from Experiment 1, but this time a large amount of the reaction's product is added to the tube at the start, before the enzyme. Predict how the rate at which new product forms in this tube (the increase above the amount added) will compare with the rate in the original 40 °C tube. Justify your prediction.
Score part D
Model response
The rate of product formation will be lower than 6.0 micromoles per minute. How efficiently an enzymatic reaction proceeds depends on the relative concentrations of substrate and product. With a large amount of product already present, product molecules occupy the enzyme more often and the reverse reaction becomes more frequent, so fewer substrate molecules are converted per minute and the net formation of new product slows.
Your score: 0 of 9, from the boxes you ticked.
-
-
Question 2: Interpreting and Evaluating Experimental Results with Graphing 9 points
Water fleas (Daphnia) are small freshwater crustaceans that eat single-celled algae. A female can reproduce asexually, producing eggs that develop at once into young, nearly all of them female. A female can also reproduce sexually, producing a few resting eggs that do not hatch until weeks or months later. When food is scarce, some asexual eggs develop into males, and females that mate produce resting eggs.
Researchers set up 24 identical tanks, each with 20 adult females from one laboratory stock and no males at the start. Six tanks were kept at each of four food levels by adding algae daily. Food level is measured as the mass of algal carbon per liter of water. After three weeks, the researchers counted the egg-carrying females in each tank and recorded how many there were and the percentage that were carrying resting eggs.
Egg-carrying females after three weeks (6 tanks per food level) Food level (mg algal carbon per liter) Mean percentage carrying resting eggs $\pm 2\,SE_{\bar{x}}$ (percentage) Mean number of egg-carrying females per tank 0.05 62 8 30 0.10 41 9 44 0.50 12 6 71 1.00 5 4 86 Respond to parts A, B, C and D. Construct the graph on your own paper.
-
A.
Explain why the food level, the mass of algal carbon per liter, is a measure of the energy available to the water fleas.
Score part A
Model response
Water fleas are heterotrophs. They cannot capture energy from sunlight, so they get energy by eating algae and metabolizing the carbohydrates, lipids and proteins in them. The algae made those compounds with energy captured in photosynthesis. A tank with more algae therefore holds more energy the fleas can take in.
-
B.
On your own paper, construct an appropriately labeled graph that represents the percentage data in the table. Your graph should show the relationship between food level and the percentage of egg-carrying females carrying resting eggs, and it should include the error bars the table gives.
Score part B
Model response
A line graph with food level (mg algal carbon per liter) on the horizontal axis, scaled 0 to 1.0, and the percentage of egg-carrying females carrying resting eggs on the vertical axis, scaled 0 to 80. The points are (0.05, 62), (0.10, 41), (0.50, 12) and (1.00, 5), joined by straight lines. Vertical error bars run from 54 to 70, 32 to 50, 6 to 18 and 1 to 9. The line drops steeply between 0.05 and 0.10 and then flattens out toward 1.00.
-
C.
i. Calculate the percent decrease in the mean percentage of females carrying resting eggs from the 0.05 food level to the 1.00 food level.
ii. Based on the error bars, determine whether the difference between the 0.50 and 1.00 food levels is statistically significant. Explain your reasoning.
Score part C
Model response
i. $\frac{62 - 5}{62} \times 100 = 91.9\%$, a decrease of about 92%.
ii. It is not statistically significant. The error bar at 0.50 runs from 6 to 18 and the one at 1.00 runs from 1 to 9. The two overlap between 6 and 9, so these data do not show a real difference between the two food levels.
-
D.
The researchers continue the experiment for another three weeks. Predict whether the number of water fleas will increase faster in the tanks with 0.05 or with 1.00 mg algal carbon per liter. Justify your prediction using the data and the energy available to the females.
Score part D
Model response
The number of water fleas will increase faster in the 1.00 tanks. There, the females take in more energy than they use, and a net gain of energy goes into growth and greater reproductive output. Those tanks already hold about 86 egg-carrying females, and only about 5% of them carry resting eggs, so about 82 per tank are carrying eggs that develop at once into young that can soon reproduce. In the 0.05 tanks, energy is scarce, so each female produces fewer offspring, and 62% of the 30 egg-carrying females, about 19 per tank, are making resting eggs that will not hatch for weeks.
Your score: 0 of 9, from the boxes you ticked.
-
-
Question 3: Scientific Investigation 4 points
A grass that grows in coastal salt marshes keeps taking up water from soil that is often salty. A student proposes that the grass osmoregulates: when soil salt rises, its root cells accumulate more dissolved solutes.
To test this, a researcher grows 40 young plants from seed in trays of washed sand at 25 °C. Ten plants are watered daily with each of four solutions: 0, 100, 200 and 300 mM NaCl. After 14 days, the researcher measures the solute potential of the cell sap from each plant's root cells.
The solute potential of a solution can be calculated with $\Psi_s = -iCRT$, where $R = 0.0831$ L·bars/(mol·K) and $T$ is the temperature in kelvin (°C + 273). For NaCl, $i = 2$. Assume the pressure potential of the soil solution is 0 bars, so its water potential equals its solute potential, and that the pressure potential of the root cells is never negative.
Respond to parts A, B, C and D.
-
A.
Describe the direction of net water movement between root cells and the surrounding soil solution when the water potential of the soil solution is lower than the water potential of the root cells.
Score part A
Model response
Water moves by osmosis from higher to lower water potential, so the net movement is out of the root cells and into the soil solution. The roots lose water instead of taking it up.
-
B.
State the null hypothesis for this investigation.
Score part B
Model response
The NaCl concentration of the watering solution has no effect on the solute potential of the root cells.
-
C.
Assume the student's proposal is correct. Predict how the solute potential of the root cells of plants watered with 300 mM NaCl will compare with that of plants watered with 0 mM NaCl.
Score part C
Model response
The root cells of plants watered with 300 mM NaCl will have a lower, more negative solute potential than those of plants watered with 0 mM NaCl.
-
D.
Justify your prediction in part C. In your justification, calculate the solute potential of the 300 mM NaCl solution at 25 °C.
Score part D
Model response
$\Psi_s = -iCRT = -(2)(0.300)(0.0831)(298) = -14.9$ bars. Water enters root cells only when their water potential is lower than the soil solution's. To keep taking up water from a solution near −14.9 bars, the root cells must accumulate solutes, which makes their solute potential, and so their water potential, more negative than it is in plants watered with plain water.
Your score: 0 of 4, from the boxes you ticked.
-
-
Question 4: Conceptual Analysis 4 points
Cells of a fungus grow at 25 °C. When they are shifted to 39 °C, the transcription of four genes, H1, H2, H3 and H4, rises sharply within minutes. The four genes are on four different chromosomes. Each has the same short DNA regulatory sequence near its promoter. A protein called transcription factor F is present in the cells at both temperatures, but it binds that regulatory sequence only after the shift to 39 °C.
Respond to parts A, B, C and D.
-
A.
Describe how a transcription factor bound to a regulatory sequence can increase the transcription of a gene.
Score part A
Model response
A transcription factor bound to a regulatory sequence helps RNA polymerase attach at the gene's promoter and begin transcription. The gene is then transcribed into mRNA more often.
-
B.
Explain how the four genes can be regulated together even though they are on different chromosomes.
Score part B
Model response
All four genes have the same regulatory sequence near their promoters. Factor F recognizes that sequence wherever it occurs in the genome, so after the shift to 39 °C it binds near each of the four genes and increases the transcription of all of them together.
-
C.
A mutant strain of the fungus lacks the regulatory sequence near gene H2 only. Everything else in its genome, including the gene for factor F, is normal. Predict whether the transcription of gene H2 and of gene H3 will rise in the mutant after the shift to 39 °C.
Score part C
Model response
In the mutant, H2 transcription will not rise after the shift, while H3 transcription will still rise as in normal cells.
-
D.
Justify your prediction in part C.
Score part D
Model response
Factor F raises a gene's transcription by binding the regulatory sequence near it. The mutant's H2 has no such sequence, so factor F has nothing to bind there and H2 is not switched on. H3 still has its regulatory sequence, and the mutant makes normal factor F, so factor F binds near H3 at 39 °C and H3 is transcribed more.
Your score: 0 of 4, from the boxes you ticked.
-
-
Question 5: Analyze Model or Visual Representation of a Biological Concept or Process 4 points
Biologists have built two cladograms, shown in the figure, for whales and four hoofed mammals: cows, hippopotamuses, pigs and horses. Horses are the out-group in both.
Cladogram A, built from the shapes of living animals' bones, branches in this order from the root: horses split off first, then whales, then cows. The last node joins pigs and hippopotamuses. In Cladogram A, a "double-pulley" ankle bone is a shared derived character of cows, pigs and hippopotamuses. Living whales have no hind-limb ankle bones, so Cladogram A scores whales as lacking this character.
Cladogram B, built from DNA sequences, branches in this order: horses split off first, then pigs, then cows. The last node joins hippopotamuses and whales.
In a teaching example, the table gives the number of differences between each pair of these mammals in one stretch of 1,000 DNA bases.
Differences between each pair of mammals, per 1,000 bases (teaching example) Mammal Whale Hippopotamus Cow Pig Hippopotamus 38 Cow 52 50 Pig 61 59 60 Horse 84 82 83 85 Respond to parts A, B, C and D.
-
A.
Describe what the node that joins hippopotamuses and whales in Cladogram B represents.
Score part A
Model response
The node represents the most recent common ancestor of hippopotamuses and whales: the ancestral population that split into the two lineages.
-
B.
Explain what the position of horses as the out-group shows about their relationship to the other four mammals.
Score part B
Model response
The out-group is the lineage least closely related to the rest. Horses branch off first, so cows, pigs, hippopotamuses and whales share a more recent common ancestor with each other than any of them shares with horses.
-
C.
Identify which cladogram the DNA data in the table support, and use the data to justify your choice.
Score part C
Model response
The data support Cladogram B. Whales and hippopotamuses differ at only 38 sites, fewer than any other pair, so the two share the most recent common ancestor, as B shows. Pigs and hippopotamuses, which Cladogram A joins at its last node, differ at 59 sites, more than hippopotamuses and cows (50), which does not fit A.
-
D.
Fossils of early whale relatives that still had hind legs were later found to have the double-pulley ankle bone. Explain how these fossils affect the evidence for Cladogram A.
Score part D
Model response
Cladogram A placed whales outside the group with the double-pulley ankle because living whales lack it. The fossils show that early members of the whale lineage had that ankle, so it is a shared derived character of whales too, and modern whales lost it. The trait no longer supports A. Instead it places whales inside the group with cows, pigs and hippopotamuses, as Cladogram B does, which shows a cladogram is a hypothesis revised as new evidence comes in.
Your score: 0 of 4, from the boxes you ticked.
-
-
Question 6: Analyze Data 4 points
In tomato plants, the allele for tall stems (D) is dominant to the allele for dwarf stems (d), and the allele for red fruit (R) is dominant to the allele for yellow fruit (r). A grower crosses a true-breeding tall, red-fruited plant with a true-breeding dwarf, yellow-fruited plant. All of the first-generation offspring are tall with red fruit. The grower then self-pollinates the first-generation plants and grows 400 second-generation plants from their seeds.
The grower hypothesizes that the two genes assort independently.
Chi-square critical values at p = 0.05: 3.84 for 1 degree of freedom, 5.99 for 2, 7.81 for 3 and 9.49 for 4.
Second-generation plants Phenotype Number of plants Tall, red fruit 231 Tall, yellow fruit 69 Dwarf, red fruit 77 Dwarf, yellow fruit 23 Respond to parts A, B, C and D.
-
A.
Using the data, describe the ratio of tall to dwarf plants in the second generation.
Score part A
Model response
There are 231 + 69 = 300 tall plants and 77 + 23 = 100 dwarf plants, a ratio of 3 tall to 1 dwarf.
-
B.
Calculate the chi-square value for these data under the grower's hypothesis.
Score part B
Model response
Expected numbers for a 9:3:3:1 ratio of 400 plants: 225, 75, 75 and 25.
$\chi^2 = \frac{(231 - 225)^2}{225} + \frac{(69 - 75)^2}{75} + \frac{(77 - 75)^2}{75} + \frac{(23 - 25)^2}{25} = 0.16 + 0.48 + 0.053 + 0.16 = 0.85$
-
C.
Using your chi-square value, determine whether the data support the grower's hypothesis. Justify your answer.
Score part C
Model response
There are four phenotype classes, so there are 3 degrees of freedom and the critical value is 7.81. The chi-square value, 0.85, is less than 7.81, so the grower fails to reject the hypothesis. The differences from 9:3:3:1 are small enough to be due to chance, and the data support independent assortment.
-
D.
Suppose instead that the two genes were close together on the same chromosome. Predict how the numbers of second-generation plants in the four phenotype classes would differ from the results above.
Score part D
Model response
The grower would see more tall, red-fruited plants and dwarf, yellow-fruited plants than 9:3:3:1 predicts, and fewer tall, yellow-fruited and dwarf, red-fruited plants. The first-generation plants received D with R on one chromosome and d with r on the other, so those combinations stay together in most gametes, and only crossing over between the close genes produces the recombinant combinations.
Your score: 0 of 4, from the boxes you ticked.
-
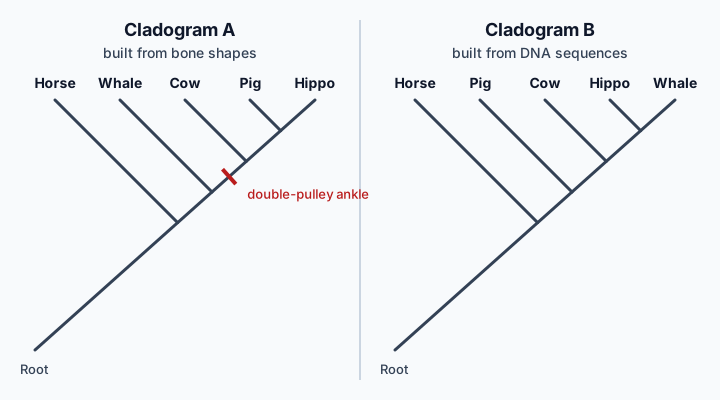
Your results
| Section | Score | Time used |
|---|---|---|
| Section I | ||
| Section II |
Free-response scores are the points you ticked against the scoring guide. The page never grades them.
Practice Exam 2
60 multiple-choice and 6 free-response questions, in the format of the AP Biology Exam.
| Section | Questions | Time |
|---|---|---|
| Section I: Multiple Choice | 60 | 90 minutes |
| Section II: Free Response | 6 | 90 minutes |
A four-function, scientific, or graphing calculator is allowed on both sections of the exam.
How the exam works
- One section at a time. When a section's clock reaches zero, the section ends and is scored.
- Multiple choice is scored when its section ends, with an explanation for every choice.
- Free response is never scored by the page. When the section ends, you see the scoring guide and a model response for each part and tick the points your answer earns.
- At the end you get your score and the time you used for each section.
- In study mode each multiple-choice answer is checked as soon as you give it, with its explanation, and each free-response question has a button that opens its scoring guide.
- Switching to study mode partway keeps your answers and checks the ones you have given. Start over clears everything and lets you choose a mode again.
- Your answers are kept in this browser tab if the page reloads, and nowhere else.
Section I: Multiple Choice
-
Questions 1 to 1 refer to the following.
Water moves up the narrow tubes inside a plant's stem. To model this, a student stood clean glass tubes of different inside diameters upright in a dish of water and measured how high the water rose inside each one.
Water rise in glass tubes Inside diameter of tube (mm) Height of water column (mm) 0.25 120 0.5 60 1.0 30 2.0 15 Which statement best describes the relationship between tube diameter and the height of the water column?
Answer: A.
- A
Correct. Each doubling of the diameter (0.25 to 0.5 to 1.0 to 2.0 mm) cut the height in half (120 to 60 to 30 to 15 mm), so height is inversely related to diameter.
- B
This reverses the trend. The narrowest tube, 0.25 mm, holds the tallest column, 120 mm.
- C
This assumes equal steps. The drops were 60, 30 and 15 mm, each half the one before, so the change shrinks with every doubling.
- D
This misreads the last two rows. The height still fell from 30 mm to 15 mm when the diameter went from 1.0 to 2.0 mm.
- A
-
In the small intestine, enzymes break dietary proteins down into single amino acids that can be absorbed. Which description of this process is correct?
Answer: C.
- A
Removing water is dehydration synthesis, the reaction that builds a chain. Breaking the chain apart uses water instead.
- B
The amino acids in a chain are joined by covalent peptide bonds, not hydrogen bonds. Hydrolysis cleaves those covalent bonds.
- C
Correct. Digestion of a protein is hydrolysis: for each covalent bond broken, a water molecule is added, its hydrogen going to one amino acid and its hydroxyl group to the other.
- D
This treats water as a helper that is not used up. In hydrolysis, each water molecule is split and its atoms become part of the released monomers.
- A
-
A biologist isolates a carbohydrate polymer from a fungus. Complete hydrolysis yields only one kind of monosaccharide. When she instead treats the polymer with an enzyme that breaks only the bonds at branch points, it comes apart into many unbranched chains, each about 12 monosaccharides long. Which conclusion is best supported?
Answer: B.
- A
A linear polymer has no branch points, so an enzyme that cuts only at branch points would leave it intact rather than splitting it into many chains.
- B
Correct. Complete hydrolysis shows one kind of monomer, and cutting only at branch points breaks the molecule into many separate chains, so it must have had branches joining those chains.
- C
This ignores the hydrolysis result. Breaking every bond produced only one kind of monosaccharide, so the polymer is built from one kind.
- D
This mistakes one product of the enzyme for the whole molecule. The polymer fell apart into many 12-sugar chains, so it was much larger than any one of them.
- A
-
An enzyme is building a new strand of DNA one nucleotide at a time. Which describes where each new nucleotide is added and how it is attached?
Answer: D.
- A
Both parts are wrong. Nucleotides are added to the 3' end, and hydrogen bonds join bases on opposite strands, not neighbors on the same strand.
- B
This has the right kind of bond but the wrong end. Synthesis adds nucleotides only to the 3' end, where the sugar carries a free hydroxyl.
- C
This has the right end but the wrong bond. Hydrogen bonds pair bases across the two strands; neighbors within one strand are joined covalently through the sugar and phosphate.
- D
Correct. New nucleotides are added to the 3' end of the growing strand, and a covalent bond forms between the 3' hydroxyl of the last sugar and the phosphate of the incoming nucleotide.
- A
-
A model of a protein made of a single polypeptide shows two alpha-helices and a beta-pleated sheet, each held in shape by hydrogen bonds between atoms of the backbone. It also shows a disulfide bridge, a covalent bond between the R groups of two amino acids. A chemical is added that breaks only disulfide bridges. Which level of the protein's structure is most directly changed?
Answer: C.
- A
Primary structure is the sequence of amino acids. Breaking a bond between two R groups leaves every peptide bond, and so the sequence, unchanged.
- B
The model shows the helices and sheet held by hydrogen bonds in the backbone, which the chemical does not break. The bridge joins R groups, not backbone atoms.
- C
Correct. Tertiary structure is the three-dimensional shape set by interactions among R groups, including disulfide bridges. Breaking the bridge frees the two regions of the chain it held together.
- D
Quaternary structure needs more than one polypeptide, and this protein has only one. The bridge joins two regions of the same chain.
- A
-
Salivary gland cells make two kinds of enzyme: one that is built on the rough ER and secreted from the cell, and others that are built on free ribosomes and work in the cytosol. In a mutant cell line, ribosomes can no longer attach to the ER, though they still make proteins in the cytosol. Which outcome is most likely?
Answer: B.
- A
The stem says ribosomes still make proteins in the cytosol, and many proteins are always made on free ribosomes, so the cytosolic enzymes are unaffected.
- B
Correct. Proteins made by ribosomes on the rough ER enter the endomembrane system, pass through the Golgi and leave in vesicles. With no ribosomes on the ER, the secreted enzyme stays in the cytosol, while cytosolic enzymes are made as before.
- C
This treats where a protein is made as unimportant. A secreted protein enters the endomembrane system as it is made on the rough ER; made in the cytosol, it never reaches the Golgi or a vesicle.
- D
Free ribosomes release proteins into the cytosol. Nothing in the mutation moves cytosolic enzymes into the endomembrane system.
- A
-
Questions 7 to 9 refer to the following.
A biologist measured how fast red blood cells took up two substances at different outside concentrations. Substance G is glucose, a large polar molecule. Substance P is a small nonpolar molecule. Each rate was measured over the first minute, before either substance built up inside the cells, and each value is the mean of five trials.
Uptake rate (arbitrary units per minute, illustrative data) Outside concentration (mM) Uptake rate of G Uptake rate of P 1 4.0 2.0 2 7.0 4.0 5 12.0 10.0 10 15.0 20.0 20 16.0 40.0 Which statement best describes how the uptake rates of G and P changed as the outside concentration increased?
Answer: A.
- A
Correct. P's rate is twice the concentration at every point (2.0 at 1 mM up to 40.0 at 20 mM), while G's rate climbs quickly at first and then barely changes, 15.0 to 16.0 from 10 to 20 mM.
- B
Only P's rate kept pace with concentration. G's rate rose by just 1.0 unit when concentration doubled from 10 to 20 mM.
- C
This swaps the two substances. G is the one that levels off; P doubles every time its concentration doubles.
- D
This holds only at low concentrations. At 10 and 20 mM, P's rate (20.0 and 40.0) is higher than G's (15.0 and 16.0).
- A
-
Uses the material above question 7.
Which reasoning best explains why the uptake rate of G levels off at high concentrations while the rate of P does not?
Answer: D.
- A
Molecules in solution do not block one another from a membrane this way. Size alone does not explain a ceiling on the rate; a limited number of transport proteins does.
- B
Nothing in the data points to ATP, and the cells would not run short of ATP within one minute just because more G is outside. The leveling comes from a limited number of carriers.
- C
Polar molecules do not cross the hydrophobic interior on their own at any concentration, which is why G needs proteins. This reasoning also gives no reason for a limit.
- D
Correct. A large polar molecule like glucose needs transport proteins to cross, and a membrane has only so many. Once they are all in use, adding more G cannot speed uptake. Small nonpolar P passes through the lipid bilayer itself, so its rate keeps rising with its gradient.
- A
-
Uses the material above question 7.
The biologist hypothesizes that G enters the cells by facilitated diffusion rather than by active transport. Which additional experiment would best test this hypothesis?
Answer: A.
- A
Correct. Facilitated diffusion needs no energy input, while active transport requires it. If G's uptake is unchanged in cells that cannot make ATP, the hypothesis is supported; if uptake drops, it is not.
- B
A larger sample makes the measurements more precise but compares nothing; G's mechanism would still be unknown.
- C
Both facilitated diffusion and active transport use proteins that can become saturated, so confirming the plateau cannot tell the two apart.
- D
This studies the wrong substance. Whatever P does, it says nothing about how G crosses.
- A
-
A diagram of a secretory cell shows a vesicle fusing with the plasma membrane. After fusion, the vesicle's contents are outside the cell, and the vesicle's own membrane has become part of the plasma membrane. The cell releases thousands of these vesicles every minute. Based on the diagram, which process must also go on for the plasma membrane to stay the same size?
Answer: C.
- A
Pumps move ions and small molecules across a membrane; they do not remove whole patches of membrane. Moving lipids across the bilayer would not reduce its area anyway.
- B
Channel proteins let ions and polar molecules through the membrane; they are not a way for the membrane itself to shrink.
- C
Correct. The diagram shows that each fused vesicle adds its membrane to the cell surface. In endocytosis, the plasma membrane folds inward and pinches off as new vesicles, which takes membrane back in and balances what exocytosis adds.
- D
The diagram itself is exocytosis, and it adds membrane rather than removing it. More exocytosis would make the surface larger.
- A
-
A U-shaped tube is divided at the bottom by an artificial membrane that water and glucose can cross but sucrose cannot. At the start, arm 1 holds 0.5 M sucrose and arm 2 holds 0.5 M glucose, and the two liquid levels are equal. Which prediction about the levels once the system reaches equilibrium is correct?
Answer: D.
- A
This would be true only if neither solute could cross. Equal starting concentrations stop the first net flow of water, but glucose then diffuses into arm 1 and the balance changes.
- B
Water moves toward the side with more dissolved particles, not toward smaller ones. Arm 2 loses glucose to arm 1, so it ends with fewer particles than arm 1.
- C
Solute molecules do not drag water with them through the membrane. Water moves by osmosis toward the lower water potential, which ends up in arm 1.
- D
Correct. Glucose diffuses down its gradient until its concentration is equal in the two arms. Arm 1 then holds that glucose plus all of the sucrose, so it has the higher solute concentration and lower water potential, and water moves into it by osmosis.
- A
-
In a chloroplast, the reactions that capture light energy take place on folded, stacked internal membranes. Plants of one species were grown either in bright light or in deep shade. Chloroplasts from the shade-grown plants had much more of this internal membrane per chloroplast. Which explanation best accounts for the difference?
Answer: B.
- A
Making a structure larger lowers its surface area-to-volume ratio. The benefit here is internal membrane area for reactions, not the organelle's outer surface.
- B
Correct. Internal membranes increase the surface area where membrane-based reactions can occur. With little light available, more of that surface lets the chloroplast capture more of what light there is.
- C
The data concern membrane inside each chloroplast, not the number of chloroplasts, and internal membrane is not how chloroplasts divide.
- D
Plants in deep shade receive less light, so they do not photosynthesize more, and these membranes are sites of light-capturing reactions, not sugar storage.
- A
-
Questions 13 to 13 refer to the following.
A student set up two tubes, each holding 10.0 mM of substrate S at the same temperature and pH. S slowly turns into product on its own. An enzyme that catalyzes this reaction was added to one tube only, and the product concentration in each tube was measured over time.
Product concentration (mM) Time (min) With enzyme No enzyme 0 0.0 0.0 2 6.0 0.3 4 9.0 0.6 8 10.0 1.2 16 10.0 2.4 32 10.0 4.6 Which statement best describes the data in the table?
Answer: C.
- A
The enzyme tube stops rising at 10.0 mM after 8 minutes, and the no-enzyme tube climbs from 0.3 to 4.6 mM, so neither half is right.
- B
The first half is right, but 4.6 mM is only the last reading. The no-enzyme values are still climbing (1.2, 2.4, 4.6), so the data show no plateau.
- C
With the enzyme, product reaches 10.0 mM at 8 minutes and stays there, which is all of the starting substrate. Without it, product climbs from 2.4 to 4.6 mM between 16 and 32 minutes and has not leveled off.
- D
The enzyme tube rises fastest in the first 2 minutes (6.0 mM) and does not rise at all after 8 minutes.
- A
-
In the liver, the enzyme alcohol dehydrogenase converts methanol into a product that is toxic. Ethanol is also a substrate of this enzyme and binds the same active site. A patient who has swallowed methanol is given a large dose of ethanol. How does the ethanol reduce the amount of the toxic product formed?
Answer: B.
- A
This describes a noncompetitive inhibitor. The stem says ethanol binds the same active site, so it competes with methanol there rather than acting at another site.
- B
Ethanol binds the same active site reversibly, so it competes with methanol. With a high concentration of ethanol, most enzyme molecules are occupied by ethanol at any moment, and methanol is turned into the toxic product much more slowly.
- C
The stem gives ethanol a role at the enzyme, not in the blood. Ethanol slows the formation of the toxic product rather than destroying it afterward.
- D
Ethanol is a substrate of the enzyme, not a denaturing agent, and binding at the active site is reversible.
- A
-
Researchers compared the genes for the enzymes of glycolysis in a bacterium, an archaean and a yeast. All three species had genes for every enzyme in the pathway, and the amino acid sequences of each enzyme were similar across the three species. Which claim do these data best support?
Answer: D.
- A
The data show all three are similar; they give no measure of which pair is more similar, so they cannot rank relatedness.
- B
Separate origins would not be expected to produce similar amino acid sequences for every enzyme. Shared sequences point to shared descent.
- C
The data show these species have glycolysis, not that it is their only source of ATP. All three can also make ATP in other ways.
- D
A pathway with similar enzymes in Bacteria, Archaea and Eukarya is best explained by inheritance from a common ancestor of all three domains, which is why core pathways such as glycolysis are evidence of common ancestry.
- A
-
Questions 16 to 19 refer to the following.
A student isolated chloroplasts from spinach leaves and suspended them in a buffer containing DCPIP, a blue dye. DCPIP can take the place of NADP⁺ as the final electron acceptor of the light reactions: when it accepts electrons, it turns from blue to colorless. The student measured the percent transmittance of light through each tube with a spectrophotometer. A higher transmittance means more of the dye has turned colorless. Tube 2 was wrapped in foil. Tube 3 held chloroplasts that had been boiled for 5 minutes and then cooled. Tube 4 also held herbicide H. Tube 5 held buffer and dye but no chloroplasts.
Percent transmittance of light through each tube Tube 0 min 5 min 10 min 15 min 1: chloroplasts, light 30 47 61 72 2: chloroplasts, dark 30 31 31 32 3: boiled chloroplasts, light 30 30 31 31 4: chloroplasts, light, herbicide H 30 34 37 39 5: no chloroplasts, light 30 30 30 30 Which statement describes the results for tube 4?
Answer: A.
- A
Tube 4 rose by 39 - 30 = 9 points, more than tube 2 (2 points) and far less than tube 1 (42 points).
- B
Tube 4 ended at 39 and tube 1 at 72. Tube 4 rose by 9 points, far less than tube 1's 42.
- C
Tube 4 rose from 30 to 39, while tube 2 rose only from 30 to 32, so tube 4 did not stay level with it.
- D
Tube 4 rose at every reading (30, 34, 37, 39); it never fell.
- A
-
Uses the material above question 16.
What was the average rate of change in transmittance in tube 1 over the 15 minutes?
Answer: A.
- A
Average rate = change / time = (72 - 30) / 15 = 42 / 15 = 2.8% per minute.
- B
This is the rate over the first 5 minutes only, (47 - 30) / 5 = 3.4% per minute, when the change was fastest.
- C
This divides the final reading by the time (72 / 15 = 4.8). A rate of change uses the change, 72 - 30 = 42.
- D
This is the total change, 42 percentage points, without dividing by the 15 minutes.
- A
-
Uses the material above question 16.
What is the purpose of tube 3?
Answer: C.
- A
That is the job of tube 5, which has light and dye but no chloroplasts. Tube 3 does contain chloroplasts.
- B
This confuses tube 3 with the dark tube. Boiling does not block light, and tube 3 sat in the light like tube 1. The light requirement is shown by tube 2, wrapped in foil.
- C
Tube 3 matches tube 1 except that its chloroplasts were boiled, which denatures their proteins. Its transmittance barely changed, so the dye change needs working proteins such as those of the electron transport chain, not just chloroplast material in the light.
- D
A tube set as the blank would hold no dye, since the dye is what is being measured. Tube 3 holds dye and is measured over time like the others.
- A
-
Uses the material above question 16.
Which claim about herbicide H is best supported by the data?
Answer: B.
- A
DCPIP takes the place of NADP⁺ as the electron acceptor, so a shortage of NADP⁺ would not slow the dye change. The dye reports electron flow in the light reactions, not the Calvin cycle.
- B
The dye changes as it accepts electrons from the light reactions. Tube 4 changed by only 9 points against 42 in tube 1, under the same light, so H slowed electron flow; it still changed more than the boiled tube, so some flow remained.
- C
Tube 4 rose by 9 points while boiled tube 3 rose by only 1, so some activity remained with H. H did not destroy the chloroplasts as boiling did.
- D
This reads the rise in tube 4 as an increase, judging the tube against its own starting value instead of the control. Tube 4 rose far less than tube 1, so H slowed electron flow rather than speeding it.
- A
-
A model of an aerobic bacterium shows its electron transport chain in the plasma membrane. As electrons pass from NADH toward oxygen, protons are pumped from the cytoplasm across the plasma membrane to the region just outside it. ATP synthase sits in the same membrane, with its ATP-making part facing the cytoplasm. While the bacterium is making ATP by this route, which is true?
Answer: D.
- A
Protons are pumped out of the cytoplasm, so it has the lower proton concentration and the higher pH. Protons also flow down their gradient, which here is inward.
- B
The pH is right, but protons through ATP synthase move down their gradient, from the high concentration outside back into the cytoplasm, not further out.
- C
The direction of flow is right, but the cytoplasm is the side protons were pumped out of, so it has the higher pH, not the lower.
- D
Pumping protons outward makes their concentration higher, and the pH lower, just outside the membrane. In chemiosmosis protons flow back down that gradient through ATP synthase into the cytoplasm, driving ATP synthesis, just as in mitochondria but across the plasma membrane.
- A
-
A bacterium can grow on glucose with or without oxygen. Without oxygen, it carries out glycolysis and then converts pyruvate to lactate. A mutant strain lacks the enzyme that converts pyruvate to lactate and has no other fermentation pathway or other electron acceptor to use. The mutant grows normally with oxygen but cannot grow without it. Which best explains why?
Answer: C.
- A
The Krebs cycle oxidizes pyruvate, not lactate, and lactate formation is what happens instead of the Krebs cycle when oxygen is absent.
- B
This assumes the fermentation step makes ATP. The ATP comes from glycolysis; making lactate only regenerates NAD⁺ so glycolysis can continue.
- C
Glycolysis turns NAD⁺ into NADH. Without oxygen, fermentation is the only way this cell can turn NADH back into NAD⁺; with no lactate step, NAD⁺ runs out, glycolysis stops, and the cell makes no ATP.
- D
Glycolysis does not use oxygen; the normal strain grows without oxygen by glycolysis and fermentation.
- A
-
When the amoebae of a soil slime mold run out of food, they crawl toward one another from as far as a centimeter away and gather into a mound. A student hypothesizes that starving amoebae release a chemical that spreads through the surrounding moisture and draws other amoebae toward its source. Which question is testable and directly tests this hypothesis?
Answer: D.
- A
This asks about purpose, which no experiment can measure, and it says nothing about how the cells signal one another.
- B
This can be tested, but it is about the amoebae's food, not about how starving cells signal one another.
- C
This can be tested, but crowding could change mound size whether the cells signal by a chemical or by touch, so it does not test the proposed chemical.
- D
If the cells release a chemical that spreads, agar that held starving amoebae should still hold it after they are gone, and other amoebae should crawl toward it with no cell there to touch. If they do not, the hypothesis is not supported.
- A
-
A model of a receptor in the membrane of a muscle cell shows that the receptor is itself an ion channel. When neurotransmitter N binds two sites on the outside of the receptor, ions flow into the cell, triggering contraction. When N leaves the sites, the flow stops. According to the model, which event directly links the binding of N to the cell's response?
Answer: B.
- A
This assumes a ligand must enter the cell to act. In the model, N binds sites on the outside, and what flows in is ions, not N.
- B
This is a ligand-gated channel: binding of N changes the receptor's shape so that its pore opens, and the ions that enter trigger the response. The receptor and the channel are the same protein.
- C
This describes a pathway with a second messenger. The model has no cAMP; the receptor itself is the channel.
- D
This describes a phosphorylation cascade. In the model the binding opens the channel directly, with no kinases.
- A
-
In yeast, a mating pheromone binds a receptor on the cell surface. The activated receptor leads to the activation of kinase 1, which adds a phosphate group to kinase 2. Kinase 2 then adds a phosphate group to a transcription factor, which turns on genes needed for mating. What role does adding phosphate groups play in this pathway?
Answer: A.
- A
In a phosphorylation cascade, adding a phosphate changes a protein's shape and so its activity. Activated kinase 1 activates kinase 2, which activates the transcription factor, relaying the signal from the receptor to the genes.
- B
This reverses the role of phosphorylation here. Each phosphorylation activates the next protein, carrying the signal forward rather than ending it.
- C
The pheromone stays outside, bound to the surface receptor. What moves inward is the signal, relayed from protein to protein.
- D
This treats phosphorylation as an energy delivery. The phosphate on the transcription factor changes its activity; it does not power transcription.
- A
-
As a mouse embryo's paws develop, the cells between the future toes receive a signal. The signal binds a receptor on those cells, the receptor activates relay protein Z, and active Z starts a pathway that ends in apoptosis, which separates the toes. The cells of the toes themselves also make the receptor and protein Z, but they receive almost none of the signal. In a mutant embryo, protein Z is changed so that it stays active even when no signal is bound to the receptor. Which outcome is most likely in the mutant?
Answer: D.
- A
This assumes a cell still needs the signal to respond. Once Z is active on its own, the pathway runs in any cell that makes Z, whether or not the signal reaches it.
- B
This treats every mutation as a loss of function. The change keeps Z active, so it passes the signal on all the time instead of never.
- C
This assumes the pathway still stops when the signal leaves. A Z that cannot switch off keeps the pathway running after the signal is gone.
- D
A component downstream of the receptor that stays active runs the pathway with no signal at all. Every cell that makes Z, including the cells of the toes, is driven into apoptosis, so the toes do not form normally.
- A
-
A model of blood glucose regulation: when blood glucose falls below its set point, cells of the pancreas release the hormone glucagon. Glucagon causes liver cells to break down glycogen and release glucose into the blood. As blood glucose rises, the pancreas releases less glucagon. Which change to the model would turn this into a positive feedback loop?
Answer: A.
- A
In positive feedback the response intensifies its own stimulus. If rising glucose caused more glucagon, the liver would release still more glucose, raising glucose further and calling for still more glucagon, moving the level away from its set point.
- B
This is the model as it stands: the response reduces its own stimulus, which is negative feedback.
- C
This adds a second way to raise glucose, but rising glucose would still reduce glucagon, so the loop stays negative.
- D
This removes feedback altogether. If glucagon release ignores glucose, nothing links the response back to the stimulus.
- A
-
Many white blood cells of one type in a person's lymph nodes do not divide for months. When one of these cells binds a matching protein from a virus, it begins dividing, and within a week it has given rise to thousands of cells with the same DNA. Which best explains this?
Answer: C.
- A
A cell that is not dividing waits outside the cycle in G0, not partway through mitosis. One finished mitosis would also give two cells, not thousands.
- B
Meiosis produces cells with half the chromosomes, each genetically different. Identical copies come from mitosis.
- C
A nondividing cell can sit in G0 and reenter the cycle in response to the right cue. Repeated rounds of the cycle, each with DNA replication and mitosis, give thousands of daughter cells with the same complete genome.
- D
Without S phase the DNA would not be copied, and the daughter cells could not each receive a complete genome.
- A
-
Normal skin cells grown in a dish divide until they cover the dish in a single layer, then stop. At that point, the cells hold high levels of protein K, which binds cyclin-dependent kinases (CDKs) and keeps them inactive. Cells from a skin tumor keep dividing and pile up in layers, and they have no detectable protein K. When protein K is removed from normal cells, they keep dividing and pile up in layers like the tumor cells. Which claim do these observations best support?
Answer: B.
- A
Cyclin was not measured. The only difference reported between the cells is protein K.
- B
Cyclin-CDK complexes drive the cell through the cycle. Normal cells stop dividing when K, which keeps CDKs inactive, is high, tumor cells without K never stop, and removing K from normal cells makes them behave like the tumor cells. Taking K away causes the loss of the stop, so the evidence supports K acting as a brake on the cycle.
- C
The tumor cells keep dividing in the same kind of dish, so the stop is not explained by nutrients running out; it matches the rise in protein K.
- D
The stem says K keeps CDKs inactive, and the tumor cells without it divide more, not less.
- A
-
A drawing shows a dividing cell from an animal whose body cells have 2n = 6. Three chromosomes are moving toward each pole. Each chromosome is a single chromatid, and the three chromosomes at each pole all differ from one another in length and centromere position. Which stage of cell division does the drawing show?
Answer: C.
- A
In anaphase of mitosis each pole receives a full diploid set, six chromosomes with two of each kind. Here each pole gets only three, one of each kind.
- B
In anaphase I homologs separate, so each pole does get three different chromosomes, but each one still has two sister chromatids. These are single chromatids.
- C
Each pole receives one chromosome of each kind, a haploid set (n = 3), and each chromosome is a single chromatid. That is what results when sister chromatids are pulled apart in anaphase II.
- D
In metaphase II chromosomes are lined up at the plate with their sister chromatids still joined. The drawing shows single chromatids already moving toward the poles.
- A
-
Questions 30 to 32 refer to the following.
In a species of aquarium fish, gene R controls fin color (R, red, is dominant to r, gold) and gene T controls tail shape (T, forked, is dominant to t, rounded). A breeder crosses two fish that are each heterozygous for both genes (RrTt) and scores 320 offspring. She uses a chi-square test to ask whether the results fit the ratio expected if the two genes assort independently.
Chi-square: $\chi^2 = \sum \frac{(o - e)^2}{e}$, where o is an observed count and e an expected count. Degrees of freedom equal the number of offspring classes minus 1.
Offspring of the cross RrTt x RrTt Offspring phenotype Number of offspring Red fins, forked tail 186 Red fins, rounded tail 54 Gold fins, forked tail 62 Gold fins, rounded tail 18 Chi-square critical values at p = 0.05 Degrees of freedom 1 2 3 4 Critical value 3.84 5.99 7.81 9.49 Which is the null hypothesis for the breeder's chi-square test?
Answer: A.
- A
A cross of two double heterozygotes with independently assorting genes gives 9/16, 3/16, 3/16 and 1/16 of the four classes. The null hypothesis says any difference from that ratio is due to chance.
- B
A 1:1:1:1 ratio is expected from a test cross, a double heterozygote crossed with a homozygous recessive. Both parents here are RrTt.
- C
This is an alternative hypothesis, linkage, not the null. The null predicts no departure from the ratio for independent assortment.
- D
This states the opposite of a null hypothesis. The null says there is no significant difference between observed and expected counts.
- A
-
Uses the material above question 30.
What is the chi-square value for the breeder's data?
Answer: B.
- A
This uses (o - e) / e without squaring the differences: 6/180 + 6/60 + 2/60 + 2/20 = 0.27. The formula squares each difference.
- B
Expected counts are 320 x 9/16 = 180, 320 x 3/16 = 60, 60 and 320 x 1/16 = 20. Then $\chi^2$ = 6²/180 + 6²/60 + 2²/60 + 2²/20 = 0.20 + 0.60 + 0.07 + 0.20 = 1.07.
- C
This divides each squared difference by the observed count: 36/186 + 36/54 + 4/62 + 4/18 = 1.15. The formula divides by the expected count.
- D
This adds the squared differences, 36 + 36 + 4 + 4 = 80, and never divides by the expected counts.
- A
-
Uses the material above question 30.
The breeder repeats the cross with a different pair of RrTt fish, scores the same four classes, and calculates $\chi^2$ = 8.6 against the same expected ratio. At p = 0.05, which conclusion is correct for the second cross?
Answer: D.
- A
This uses 4 degrees of freedom, one per class. Degrees of freedom are the number of classes minus 1, so 4 - 1 = 3, and the critical value is 7.81.
- B
This reverses the rule. A chi-square value larger than the critical value means the difference is unlikely to be due to chance alone, so the null is rejected.
- C
A chi-square test never accepts or proves the null, and closeness to the critical value is not the test. Here 8.6 is above 7.81, so the null is rejected.
- D
With 4 classes there are 4 - 1 = 3 degrees of freedom, and the critical value at p = 0.05 is 7.81. Since 8.6 > 7.81, the departure from the 9:3:3:1 ratio is unlikely to be chance alone, so the null hypothesis is rejected.
- A
-
In a species of flowering plant, some plants have pale yellow leaves instead of green ones. A researcher claims that the trait is determined by chloroplast DNA rather than nuclear DNA. Which result of reciprocal crosses best supports the claim?
Answer: B.
- A
Identical results from both directions, then a 3:1 ratio, are the pattern of a recessive nuclear allele following Mendel's laws. It argues against chloroplast inheritance.
- B
In plants, chloroplasts pass to offspring in the ovule and not in the pollen. If offspring always match the ovule parent, whichever way the cross is made, the trait follows the chloroplasts, as the claim says.
- C
Matching results in both directions mean it does not matter which parent gives the ovule. A trait carried in chloroplasts would depend on the ovule parent.
- D
Here the offspring match the pollen parent. Chloroplasts are not passed on in pollen, so this pattern would argue against the claim.
- A
-
Questions 34 to 34 refer to the following.
Water fleas (Daphnia) reproduce asexually, so all members of a clone are genetically identical. Young water fleas from two clones were raised either in plain water or in water holding chemicals released by a predatory insect larva. The researchers measured the height of the helmet, a spine-like growth on the head, of each adult.
Mean adult helmet height (micrometers) Clone Plain water Water with predator chemicals Clone 1 42 118 Clone 2 45 51 Which statement best describes the helmet height measurements?
Answer: A.
- A
Clone 1 went from 42 to 118 micrometers, 118 / 42 = 2.8 times as tall, while clone 2 went only from 45 to 51. The same environmental change produced a large change in one genotype and little in the other.
- B
Clone 1 rose by 118 - 42 = 76 micrometers and clone 2 by 51 - 45 = 6, so the increase was not equal.
- C
Clone 2 was taller only in plain water, 45 versus 42 micrometers. With predator chemicals clone 1 was far taller, 118 versus 51.
- D
In plain water the clones were about the same, 42 and 45 micrometers. In predator water they differed widely, 118 and 51.
- A
-
A researcher removes all proteins from two DNA samples: the chromosomes from yeast nuclei and the chromosome of a bacterium. She treats each sample with an enzyme that breaks down DNA only by removing nucleotides one at a time from the free end of a strand. Which DNA is most likely to remain intact?
Answer: C.
- A
Histones do condense eukaryotic chromosomes, but the stem says all proteins were removed first, and the bacterial chromosome is not wound on histones in the first place.
- B
This gives eukaryotes the prokaryotic arrangement. Eukaryotic chromosomes are typically linear, with exposed ends.
- C
Prokaryotes typically have a circular chromosome, which has no free ends for the enzyme to start from. Eukaryotic chromosomes, such as yeast's, are linear, so their ends can be attacked.
- D
A linear strand has a 5' end and a 3' end, but in a circular molecule each strand is joined end to end, so there is no free end.
- A
-
A diagram shows a replication bubble opening from an origin in the middle of a DNA molecule, with one replication fork moving left and the other moving right. The top parental strand runs from its 3' end on the left to its 5' end on the right. Which describes the new strand made with the top parental strand as its template?
Answer: D.
- A
This reverses the direction of synthesis. A strand made on a template whose 3' end is on the left runs 5' to 3' from left to right, so it grows to the right, toward the right fork.
- B
A strand can grow in only one direction, 5' to 3'. On this template it grows rightward, the same way the right fork moves but away from the left fork, so it cannot be continuous at both.
- C
A template running 3' to 5' in the direction a fork moves supports continuous synthesis at that fork. Fragments form only at the fork moving the other way.
- D
The new strand is antiparallel to the template, so its 5' end is on the left and it grows toward the right. At the right fork it grows in the same direction the fork opens and is made continuously; at the left fork it grows away from the opening, so it is made in fragments that ligase joins.
- A
-
In a drawing of transcription, RNA polymerase is moving from left to right along a gene, and the RNA made so far trails out of the polymerase toward the left. Which labels are correct for the drawing?
Answer: A.
- A
RNA polymerase reads the template strand 3' to 5', so moving right means the template's 3' end is on the left. It builds RNA 5' to 3', so the first-made end, the 5' end, is the one trailing free to the left.
- B
RNA polymerase reads the template 3' to 5'. Moving to the right, it must start near the template's 3' end, so the left end is 3', not 5'.
- C
The template label is right, but RNA grows at its 3' end, which stays inside the polymerase. The end that trails away is the 5' end, made first.
- D
Both labels are reversed. Moving right along a template read 3' to 5' puts the template's 3' end on the left, and the free end of the RNA is its 5' end.
- A
-
A drug blocks mRNA from passing through nuclear pores. Yeast cells and bacterial cells are each grown with the drug. Which prediction about the making of proteins from newly transcribed mRNA is best?
Answer: C.
- A
Bacteria have no nucleus, so their mRNA never has to pass through a nuclear pore.
- B
This reverses the two cell types. Bacteria have no nuclear pores for the drug to block, and in yeast translation happens on ribosomes in the cytoplasm and on the rough ER, outside the nucleus.
- C
Yeast mRNA is made in the nucleus and must move to ribosomes in the cytoplasm, so new mRNA is trapped. A bacterium has no nucleus, and its ribosomes begin translating each mRNA while it is still being transcribed.
- D
Ribosomes read mRNA, not DNA. Rough ER ribosomes in yeast are in the cytoplasm and still need mRNA that has left the nucleus.
- A
-
In a model of an inducible operon, a repressor protein binds the operator and blocks RNA polymerase. When an inducer molecule binds the repressor, the repressor changes shape and releases the operator. A mutant repressor still binds the operator but can no longer bind the inducer. Based on the model, how are the operon's genes expressed in cells with the mutant repressor?
Answer: D.
- A
Removing the inducer does not release a repressor in this model. Without inducer even a normal repressor stays on the operator.
- B
Constant expression is what a repressor that cannot bind the operator would cause. This repressor still binds the operator.
- C
Normal induction needs the inducer to bind the repressor. The mutant cannot bind it, so adding inducer has no effect.
- D
Release of the operator depends on the inducer binding the repressor. The mutant repressor binds the operator but cannot bind the inducer, so it is never released and RNA polymerase stays blocked.
- A
-
A bacterium and a yeast each make three enzymes needed to use the sugar galactose. In the bacterium, the three genes lie side by side and are transcribed together into one mRNA. In the yeast, the three genes lie on different chromosomes, and each is transcribed into its own mRNA. In both species, all three enzymes appear within minutes of galactose being added. Which statement best explains how each species coordinates its three genes?
Answer: B.
- A
The yeast genes are on different chromosomes and make separate mRNAs, so they cannot share one promoter. Only the bacterium's genes form an operon.
- B
The bacterium's genes form an operon: one promoter and one regulatory sequence control all three, so they are transcribed together. In eukaryotes, genes far apart can be regulated together when the same transcription factor acts on a regulatory sequence near each one.
- C
An inducer such as galactose acts through regulatory proteins, which then change how RNA polymerase transcribes the genes. It does not switch genes on by binding DNA or mRNA itself.
- D
This reverses the two species. The bacterium's genes make one mRNA from one promoter, and the yeast's genes each make their own mRNA, so nothing needs to be cut apart.
- A
-
In a plant, a mutation changes one base pair in the promoter of gene P, upstream of where transcription starts. Mutant plants make about one tenth as much protein P as normal plants, but protein P's amino acid sequence is unchanged. Which reasoning best explains these results?
Answer: B.
- A
A silent mutation lies in a codon, and by definition it has no effect on the protein. It would not explain a drop in amount, and the promoter is not read as codons.
- B
The promoter is where RNA polymerase and transcription factors bind to start transcription. A change there can weaken that binding and lower how often the gene is transcribed, changing the amount of protein while leaving the coding sequence, and so the amino acids, unchanged.
- C
A frameshift in the coding region would change the amino acids after it. The sequence is unchanged, and a promoter is not translated.
- D
A premature stop codon would shorten the protein, changing its sequence. The promoter lies outside the part of the gene that is translated.
- A
-
Two related strains of a virus infect the same host cell at the same time. Some of the virus particles released from the cell carry a mix of genes from both strains. Which explanation best accounts for these particles?
Answer: C.
- A
The mixed genes come from the two viral strains, not from the host. Host genes would not give particles carrying genes of both strains.
- B
Random mutation could not produce exact copies of many genes from another strain, and the mix appeared in a single round of infection.
- C
Related viruses that infect the same cell can recombine their genetic information. New particles assembled there can carry a mix of genes from both strains, which adds to genetic variation.
- D
The particles carry a mix of genes, not two complete genomes, and the mixing happens inside the host cell before release.
- A
-
A student sets up a PCR to copy a 400-base-pair stretch of DNA but leaves out the primers. The template DNA, a heat-stable DNA polymerase, nucleotides and buffer are all present, and the usual cycles of heating and cooling are run. Which result is most likely?
Answer: D.
- A
Heating separates the strands by breaking the hydrogen bonds between base pairs, with or without primers. The missing primers stop the extension step, not the heating step.
- B
Primers do mark the ends of the copied stretch, but they are also what lets DNA polymerase start. Without them it cannot copy any part of the template.
- C
DNA polymerase does not search for a sequence. The primers, by pairing with the template, set which stretch is copied.
- D
DNA polymerase can only add nucleotides to an existing strand paired with the template. Primers give it that starting point, so without them the extension step has nowhere to begin.
- A
-
In a population of lizards, individuals that spend more time basking in the sun leave more offspring that survive to breed. Basking time varies widely, but researchers find that the basking time of offspring is unrelated to that of their parents; it depends only on where each lizard's burrow happens to be. Will natural selection raise the average basking time in the population over many generations?
Answer: A.
- A
Selection acts on inherited variation. Long baskers do leave more surviving offspring, but their offspring are no more likely to bask long, so the next generation's average stays where burrow sites put it.
- B
Learned habits are not inherited, and the stem says offspring basking is unrelated to their parents'. Nothing passes the trait on.
- C
Differential reproduction alone is not enough. Natural selection changes a population only when the favored variation is inherited, and here offspring do not resemble their parents in basking time.
- D
This contradicts the stem: longer basking does go with more surviving offspring. The obstacle is that the variation is not inherited.
- A
-
Hunting reduced northern elephant seals to perhaps 20 to 30 animals in the 1890s. Protected since then, they now number more than 100,000. Southern elephant seals, a related species, were never reduced below many thousands. Which prediction about northern elephant seals today is best supported?
Answer: A.
- A
This is a bottleneck. The few survivors held only part of the population's alleles, chosen by chance, and the regrown population descends from them, so most of the lost variation is still missing.
- B
Regrowing in number does not bring back lost alleles. New variation comes only from mutation, which is far too slow to restore it in about a century.
- C
Mutation does not speed up because a population grows. A population that passed through 20 to 30 animals holds less variation, not more.
- D
A bottleneck is genetic drift: which seals survived was largely chance, not a sorting by alleles. The survivors' alleles are a random sample, not a selected set.
- A
-
Researchers genotype 1,000 mussels in a bay at one gene with alleles A and a: 290 are AA, 420 are Aa and 290 are aa. They use these counts to find the allele frequencies, then do a chi-square test of the null hypothesis that the population is in Hardy-Weinberg equilibrium. The critical value at p = 0.05 is 3.84 for 1 degree of freedom and 5.99 for 2. Which gives the chi-square value and the correct conclusion?
Answer: C.
- A
This uses genotype frequencies (0.29, 0.42, 0.29 against 0.25, 0.50, 0.25) in place of counts. Chi-square must be computed from counts of individuals.
- B
This leaves the differences unsquared: 40/250 + 80/500 + 40/250 = 0.48. Each (observed - expected) must be squared before dividing by the expected count.
- C
p = (2 × 290 + 420)/2,000 = 0.5, so the expected counts are 250 AA, 500 Aa and 250 aa. χ² = 40²/250 + 80²/500 + 40²/250 = 6.4 + 12.8 + 6.4 = 25.6, far above both critical values, so the null hypothesis is rejected: there are too few heterozygotes for equilibrium.
- D
The value is right, but the conclusion is reversed. A chi-square larger than the critical value means the observed counts differ from the expected ones by more than chance would explain.
- A
-
Most mammals make their own vitamin C using an enzyme coded by one gene. Humans, chimpanzees and gorillas cannot. Each carries a nonfunctional copy of this gene, and in all three species the copy has the same set of disabling mutations at the same positions. Which explanation best accounts for this?
Answer: D.
- A
Diet does not cause particular mutations. Mutations arise at random, so the environment could not write the same changes into three species.
- B
Similar selection can favor similar traits, but it cannot produce the identical set of mutations in the same positions. Those had to be inherited.
- C
Mutations arise at random positions, so the chance of the same set of disabling changes arising three separate times is very small.
- D
Sharing the same mutations at the same positions is best explained by inheriting them once from a common ancestor. Comparing DNA sequences this way is evidence of common ancestry.
- A
-
A biologist claims that a red seaweed, a bread mold and a sea sponge all descend from one common ancestor that was a eukaryote. Which observation provides the best evidence for this specific claim?
Answer: B.
- A
Prokaryotes also store genes in DNA and build proteins on ribosomes. These features point to the common ancestry of all life, not to an ancestor that was a eukaryote.
- B
Linear chromosomes and genes containing introns are features typical of eukaryotic cells and rare or absent in prokaryotes. Finding the same features in three very different organisms points to an ancestor that already had them.
- C
Being made of many specialized cells arose more than once in different lineages, so it does not show these three shared one eukaryotic ancestor.
- D
Habitat and releasing energy from sugars are shared with many prokaryotes, so they cannot single out a eukaryotic ancestor.
- A
-
A phylogenetic tree, calibrated with fossils, has a time axis in millions of years. Living lineages X, Y and Z are at its tips. The branches leading to X and Y join at a node dated to 4 million years ago, and that branch joins the branch leading to Z at a node dated to 9 million years ago. Which statement does the tree support?
Answer: A.
- A
Each node stands for the most recent common ancestor of the lineages that branch from it. X and Y meet at the 4-million-year node; the lineage leading to Z had split from theirs at the 9-million-year node.
- B
Lineages on neighboring branches are sister lineages that share an ancestor at their node. Neither evolved from the other.
- C
Every living lineage has been evolving for the same length of time since its shared ancestor. Branching early does not make a lineage less evolved.
- D
Z is a living lineage at a tip, not an ancestor. The node at 9 million years is an ancestor that X, Y and Z all share.
- A
-
In a field of a diploid wildflower, an error in cell division produces a plant with four sets of chromosomes (a tetraploid). It fertilizes itself and starts a small group of tetraploid plants growing among the diploid plants. When tetraploids are crossed with diploids, the offspring have three sets of chromosomes and produce almost no viable seeds. Which statement best describes this situation?
Answer: B.
- A
Sharing a field does not prevent speciation. Crosses produce offspring that are nearly sterile, so the two groups cannot exchange genes and are reproductively isolated.
- B
The cross forms zygotes, but the hybrids produce almost no viable seeds, so the barrier acts after fertilization. Isolation arose with no geographic separation, which is sympatric speciation.
- C
The crosses do produce offspring, so fertilization succeeds. The failure comes later, in the hybrids, which makes the barrier post-zygotic.
- D
Allopatric speciation needs geographic isolation. These plants grow among the diploids; coming from one plant is not the same as being separated by place.
- A
-
Researchers want to test whether genetic diversity within a planting of wild barley increases how much of the planting survives an outbreak of a fungal leaf disease. Every plot will hold 50 seedlings. Which design best tests this?
Answer: D.
- A
This varies exposure to the fungus, not diversity, since every plot is equally diverse. It tests whether the disease kills barley, not whether diversity helps.
- B
This varies the number of plants per plot, not their genetic diversity, and breaks the plan of 50 seedlings in every plot.
- C
Diversity and exposure to the fungus both change, and together. Any difference in survival could come from either, so the variables are confounded.
- D
Genetic diversity is the only thing that differs: closely related seedlings of one self-fertilized parent against seedlings of many parents, at the same number of seedlings, under the same exposure to the fungus. Survival is the dependent variable.
- A
-
Questions 52 to 52 refer to the following.
An ecologist places periwinkles, small snails that graze algae off rocks, in mesh cages on a rocky shore at three densities, with 6 cages at each density. After 8 weeks she measures the snails’ shell growth. The table gives the mean shell growth for each density and two standard errors of the mean (2SE).
Shell growth after 8 weeks Snails per cage Mean shell growth (mm) Plus or minus 2SE 10 3.1 0.4 40 2.6 0.5 160 1.1 0.3 Based on the means and their error bars of plus or minus 2SE, which conclusion about shell growth is best supported?
Answer: C.
- A
The means do fall at each step, but the 10-snail range (2.7 to 3.5 mm) overlaps the 40-snail range (2.1 to 3.1 mm). The first rise in density is not shown to slow growth.
- B
One overlapping pair does not erase the other comparisons. The 160-snail range, 0.8 to 1.4 mm, lies well below both other ranges, so density clearly matters at the highest level.
- C
Mean plus or minus 2SE gives 2.7 to 3.5 mm at 10 snails, 2.1 to 3.1 mm at 40 and 0.8 to 1.4 mm at 160. Only the first two overlap. At the highest density snails compete for the same algae, so food per snail, and with it growth, drops: a density-dependent effect.
- D
A difference of 0.5 mm between means is smaller than the spread the error bars show. The two ranges overlap, so these data do not show the middle density slowed growth.
- A
-
A model of the nitrogen cycle in a farm field shows nitrogen gas in the atmosphere, ammonium and nitrate in the soil, and nitrogen in plant and animal tissue, with arrows for nitrogen fixation, nitrification, assimilation, ammonification and denitrification. A farmer grows beans, whose roots hold bacteria that fix nitrogen, then plows the bean plants into the soil before planting corn. Which statement correctly applies the model?
Answer: A.
- A
Fixation by root bacteria moves nitrogen from the largest reservoir, the atmosphere, into ammonia the beans assimilate. When the plowed plants decompose, ammonification releases ammonium, which nitrification can turn to nitrate for the corn: matter is cycled and conserved.
- B
Decomposing tissue releases nitrogen as ammonium through ammonification. Most plants cannot use nitrogen gas, so the corn could not take it up from the air.
- C
This ignores fixation, the reason for planting beans: the root bacteria bring nitrogen in from the atmosphere, so the soil gains nitrogen it did not hold before.
- D
Photosynthesis fixes carbon, not nitrogen, and no process makes new atoms. Matter is conserved; the beans move nitrogen into the field from the air.
- A
-
Questions 54 to 54 refer to the following.
Researchers fence eight plots of meadow and stock them with voles at four densities, two plots per density. Each breeding season they record how many young each female weans, and each spring the percentage of adults that survived the winter. The table shows the means for each density.
Vole reproduction and survival at four densities Voles per hectare Young weaned per female Adults surviving winter (%) 50 8.1 71 100 6.9 68 200 4.8 55 400 2.2 30 Which statement best describes the relationship between vole density and the other two measures?
Answer: D.
- A
Winter survival does change, from 71% to 30%; only its first step, from 71% to 68%, is small.
- B
The drops grow with density instead of staying equal: survival falls by 3 points at the first doubling and by 25 at the last.
- C
Both columns decrease down the table. Crowding increases competition for food and space rather than helping the voles.
- D
Young per female falls by 1.2, then 2.1, then 2.6, and winter survival falls by 3, then 13, then 25 percentage points. Both decline as density rises, and the largest drops come between 200 and 400 voles per hectare, a sign of density-dependent limits.
- A
-
A survey of a stream bed finds 12 mayfly larvae, 6 caddisfly larvae, 4 stonefly larvae and 2 snails, 24 animals in all. Using Simpson's Diversity Index = 1 - Σ(n/N)², what is the index for this sample, to two decimal places?
Answer: B.
- A
This is Σ(n/N)² alone, 0.35. The index subtracts that sum from 1.
- B
The proportions are 12/24 = 0.5, 6/24 = 0.25, 4/24 ≈ 0.167 and 2/24 ≈ 0.083. Their squares sum to 0.25 + 0.0625 + 0.0278 + 0.0069 ≈ 0.347, and 1 - 0.347 ≈ 0.65.
- C
This is 1 - 1/4, the value four equally common species would give. The species here are not equally common, which lowers the index.
- D
This squares N but not n: 1 - (12 + 6 + 4 + 2)/24² ≈ 0.96. Each proportion n/N must be squared as a whole.
- A
-
In a model of a tropical forest food web, fig trees make up less than 2% of the trees. Figs fruit at all times of year, while most other trees fruit for only a few months. In the months when little else is fruiting, figs are most of the diet of many fruit-eating birds, monkeys and bats, which also carry the seeds of many other tree species. Which feature of the model best explains why fig trees act as a keystone species?
Answer: C.
- A
The model says figs are under 2% of the trees, so they are not the main producers by mass. A keystone's importance is out of proportion to its abundance.
- B
Rarity alone does not make a species a keystone. Most rare species have small effects; what matters is the role figs play for many others.
- C
A keystone species has an effect far larger than its abundance. Figs carry many fruit-eaters through the lean months, and those animals spread the seeds of other trees, so losing the figs would ripple through much of the forest.
- D
The model says the reverse: in lean months many birds, monkeys and bats depend on figs.
- A
-
Questions 57 to 60 refer to the following.
Researchers study resistance to an antibiotic, drug R, in a bacterium. They start 10 small, separate cultures, each from a few hundred cells that have never met drug R, and grow each one in broth without the drug to about 100 million cells. They also grow one large culture the same way and take 10 samples from it, each the same size as one small culture. Each culture or sample is spread on its own plate of agar containing drug R, where only resistant cells can grow into colonies.
Resistant colonies on each plate Plate Separate small cultures Samples of one large culture 1 0 14 2 1 15 3 0 13 4 0 21 5 107 15 6 0 26 7 0 16 8 64 20 9 0 13 10 3 17 Which statement correctly compares the resistant colony counts from the separate small cultures with those from the samples of the large culture?
Answer: B.
- A
Two very high plates (107 and 64) stand out, but most separate cultures had none, and the mean, 17.5, is close to the samples' 17.0.
- B
The separate cultures total 175 colonies on 10 plates, a mean of 17.5; the samples total 170, a mean of 17.0. The means are nearly equal even though the separate counts are spread very unevenly.
- C
Six separate cultures had no colonies, but every sample of the large culture had at least 13.
- D
The highest count, 107, came from separate culture 5. The highest sample count was 26.
- A
-
Uses the material above question 57.
Suppose drug R itself caused resistance mutations, and only after cells touched it on the plates. If that were true, which result would the researchers have expected?
Answer: C.
- A
Under this hypothesis the drug causes mutations on the plate, so some colonies would still grow. A lack of earlier contact with the drug does not mean zero resistance.
- B
This is the result the researchers got, and it fits mutations arising at random times during growth: a culture where one arose early holds many resistant descendants.
- C
If mutations arose only on the plates, every plate would start with similar cells exposed in the same way, and each would get a similar, small number of resistant colonies. Separate cultures would then vary no more than samples of one culture.
- D
Samples of one well-mixed culture each hold a similar share of its cells, so nothing in either hypothesis makes them vary more than separate cultures.
- A
-
Uses the material above question 57.
The researchers pick resistant cells from the colonies on plate 5 and mix them in equal numbers with susceptible cells of the same strain, in broth without drug R. In each of 5 such cultures, resistant cells make up only 18 to 23% of the cells three days later. Which statement best explains this result?
Answer: A.
- A
An adaptation is favored only in a particular environment. On drug R resistant cells survive while the rest die, but without the drug they were outreproduced by susceptible cells in all 5 cultures, so the same allele is helpful in one environment and costly in another.
- B
Mutations are not undone because the environment changes. The resistant share fell because susceptible cells outreproduced them, not because resistant cells turned back into susceptible ones.
- C
Fitness depends on the environment. On drug R plates only resistant cells formed colonies at all, so resistance is a large advantage there, even though it is a cost in broth without the drug.
- D
Selection acts whenever kinds of cells differ in how many offspring they leave. A fall from 50% to about 20% in all 5 cultures is consistent, not random, so it points to lower fitness of resistant cells without the drug.
- A
-
Uses the material above question 57.
An infection holds about 100 million cells of this bacterium, none of which has met drug R. Based on the data, which outcome of a long course of drug R alone is most likely?
Answer: D.
- A
The cultures had never met drug R either, yet most held resistant cells. Resistance arises before exposure, so a lack of contact does not mean none is present.
- B
Individual cells do not acquire resistance by adjusting. The drug selects cells that already carry resistance mutations.
- C
Rare at the start does not mean rare for long. Once the drug kills the susceptible cells, the resistant ones face little competition and can take over.
- D
About 100 million cells grown without the drug held about 17 resistant cells on average, so an infection this size likely holds some. The drug kills the rest, and the resistant cells multiply: the population evolves resistance.
- A
Section II: Free Response
-
Question 1: Interpreting and Evaluating Experimental Results 9 points
In tomato plants, gene W codes for an enzyme that makes the red pigment of ripe fruit. Ripe fruit cells make large amounts of the enzyme, and leaf cells make almost none. Upstream of the gene's promoter lie two stretches of regulatory DNA, which researchers call region R1 and region R2.
To find out what each region does, the researchers built four DNA constructs. Each construct joins a version of gene W's upstream DNA to a gene for a green fluorescent protein, so the brightness of green light from a cell shows how much the attached DNA drives transcription. They inserted each construct, at the same place in the genome, into a separate set of tomato plants. They then measured the brightness of ripe fruit cells and leaf cells from 10 plants for each construct. Other experiments show that one protein, which the researchers call factor A, binds region R1. The results are in the table.
Green fluorescence from each construct, in arbitrary units (mean ± 2SE, 10 plants each) Construct Upstream DNA present Ripe fruit cells Leaf cells 1 Promoter, R1 and R2 100 ± 8 4 ± 1 2 Promoter and R2 (R1 deleted) 12 ± 3 3 ± 1 3 Promoter and R1 (R2 deleted) 160 ± 10 45 ± 5 4 Promoter only 10 ± 2 3 ± 1 Respond to parts A, B, C and D.
-
A.
Leaf cells and ripe fruit cells of a tomato plant carry the same genes. Describe how the two cell types can still make very different amounts of the enzyme coded by gene W.
Score part A
Model response
Leaf and fruit cells carry the same DNA but contain different regulatory proteins. In ripe fruit cells, transcription factors that activate gene W are present and bind its regulatory DNA, helping RNA polymerase transcribe it often. Leaf cells lack those activators, or hold a repressor, so the gene is transcribed very little and little enzyme is made.
-
B.
i. Identify the dependent variable in this experiment.
ii. Identify the construct that serves as the baseline for how much transcription the promoter drives with neither regulatory region.
iii. Justify the researchers' choice to measure leaf cells as well as ripe fruit cells.
Score part B
Model response
i. The dependent variable is the green fluorescence of the cells, which stands for how much the attached DNA drives transcription of the reporter gene.
ii. Construct 4, the promoter only, shows how much transcription the promoter gives with neither R1 nor R2.
iii. Gene W is expressed in fruit and hardly at all in leaves. Measuring leaf cells shows whether a region controls where the gene is expressed: if deleting a region lets leaf cells glow, that region normally keeps the gene silent in leaves.
-
C.
i. Calculate the percent decrease in fluorescence of ripe fruit cells when R1 is deleted, compared with construct 1.
ii. Based on the data, determine whether deleting R2 changes the fluorescence of ripe fruit cells. Justify your answer using the error bars.
Score part C
Model response
i. (100 − 12) ÷ 100 × 100 = 88. Deleting R1 lowers fruit fluorescence by 88 percent.
ii. Deleting R2 raises fruit fluorescence. Construct 3's interval is 150 to 170 and construct 1's is 92 to 108. The intervals do not overlap, so the increase is very likely a real effect of removing R2, not chance variation among plants.
-
D.
i. The researchers find a mutant tomato plant that makes no functional factor A. They insert construct 1 into this mutant. Predict the fluorescence of its ripe fruit cells, compared with the values in the table.
ii. Justify your prediction.
iii. Explain how the leaf cell data for constructs 1 and 3 support the claim that region R2 lowers the gene's expression in leaves.
Score part D
Model response
i. Fruit fluorescence would fall to about 10 to 12 units, near construct 2 and construct 4.
ii. Construct 2 shows that high expression in fruit needs R1, and R1 works through the protein that binds it, factor A. With no functional factor A, R1 cannot help RNA polymerase start transcription, so construct 1 behaves like construct 2, which lacks R1 and gave 12.
iii. In leaves, construct 1 gives 4 and construct 3, which lacks R2, gives 45, about 11 times as much, and the error bars (3 to 5 and 40 to 50) do not overlap. So R2 normally keeps transcription low in leaves, as it would if a negative regulatory protein bound R2 there. R2 also lowers expression in fruit (160 without it against 100 with it), but much less.
Your score: 0 of 9, from the boxes you ticked.
-
-
Question 2: Interpreting and Evaluating Experimental Results with Graphing 9 points
Two related shrub species grow in very different places. Species C grows along a cool, foggy coast, and species D grows in a hot desert. Researchers cut disks of the same size from leaves of each species. They placed the disks in sealed chambers of water, each given the same starting amount of dissolved carbon dioxide, under the same bright light, and held each chamber at one of five temperatures. An oxygen sensor in each chamber recorded the rate of oxygen release by the disks. Eight chambers were run for each species at each temperature. The results are in the table.
Rate of oxygen release, in µmol O₂ per cm² of leaf per hour (mean ± 2SE, 8 chambers each) Temperature (°C) Species C (coast) Species D (desert) 10 2.1 ± 0.3 1.2 ± 0.3 20 4.6 ± 0.4 3.0 ± 0.4 30 6.2 ± 0.5 5.1 ± 0.5 40 2.8 ± 0.4 7.4 ± 0.6 50 0.3 ± 0.2 3.9 ± 0.5 Respond to parts A, B, C and D. Draw the graph for part C on your own graph paper.
-
A.
Describe the source of the oxygen released by the leaf disks during photosynthesis.
Score part A
Model response
The oxygen comes from water. In the light reactions, chlorophyll in photosystem II absorbs light and loses excited electrons, and water is split to replace them. The oxygen atoms from the split water are released as O₂.
-
B.
i. Identify the independent variables in this experiment.
ii. Justify the researchers' choice to keep the light intensity and the starting amount of carbon dioxide the same in every chamber.
Score part B
Model response
i. The independent variables are the temperature of the chamber and the species, C or D, that the leaf disks came from.
ii. Light intensity and carbon dioxide concentration both affect how fast photosynthesis runs. If either differed between chambers, a change in oxygen release could come from it rather than from temperature or species, so both were held the same.
-
C.
i. On your own graph paper, construct an appropriately labeled graph that represents the data in the table and allows comparison of the two species at each temperature.
ii. Based on the data, determine whether the rates of oxygen release of the two species differ at 40 °C. Justify your answer.
Score part C
Model response
i. The graph puts temperature (°C) on the x-axis from 0 to 50 and rate of oxygen release (µmol O₂ per cm² per hour) on the y-axis from 0 to 8. Species C and species D are plotted as two lines with a key. Each point has an error bar of its own 2SE: for example, species D at 40 °C runs from 6.8 to 8.0, and species C at 40 °C from 2.4 to 3.2. Species C peaks at 30 °C; species D peaks at 40 °C.
ii. They differ. At 40 °C species D's interval is 6.8 to 8.0 and species C's is 2.4 to 3.2. The intervals do not overlap, so species D releases oxygen significantly faster than species C at 40 °C.
-
D.
i. Explain why the rate of oxygen release by species C falls between 30 °C and 40 °C.
ii. Researchers repeat the experiment on species C disks at 30 °C, but with dim light instead of bright light. Predict how the rate of oxygen release will compare with 6.2, and justify your prediction.
Score part D
Model response
i. Species C's enzymes work best near 30 °C. At 40 °C the extra heat disrupts the hydrogen bonds that hold their folded shape, so their active sites change shape and they catalyze the reactions of photosynthesis less efficiently. Photosynthesis slows, and less oxygen is released.
ii. The rate will be lower than 6.2. In dim light, chlorophyll absorbs less energy, so fewer electrons in the photosystems are excited and less water is split to replace them. Less oxygen is released, and less ATP and NADPH are made for the Calvin cycle.
Your score: 0 of 9, from the boxes you ticked.
-
-
Question 3: Scientific Investigation 4 points
Bean weevils are small beetles. A female lays her eggs on dried beans, and each larva grows inside a bean until it comes out as an adult. Two species, Callosobruchus maculatus and Callosobruchus chinensis, often infest the same stores of beans. Researchers filled 15 identical jars with 100 g of the same kind of dried beans and kept every jar at the same temperature and humidity. Five jars started with 20 adults of C. maculatus alone, five with 20 adults of C. chinensis alone, and five with 20 adults of each species together. After 12 weeks, about three generations, they counted the live adults of each species in every jar. In the mixed jars, each species ended with far fewer adults than in the jars where it lived alone.
Respond to parts A, B, C and D.
-
A.
Describe how competition between two species for a limited resource affects the populations of both species.
Score part A
Model response
When two species need the same limited resource, each one uses up some of what the other could have used. Both populations then grow more slowly and stay smaller than they would if they lived alone, so competition has a negative effect on both.
-
B.
Identify the treatment that serves as the control for measuring the effect of C. chinensis on the C. maculatus population.
Score part B
Model response
The control is the set of five jars that started with 20 C. maculatus adults and no C. chinensis. Comparing C. maculatus there with C. maculatus in the mixed jars, which started with the same 20 adults, shows the effect of C. chinensis.
-
C.
The researchers suspect that the two species compete mainly for beans in which to lay their eggs. They repeat the mixed jars, starting again with 20 adults of each species, but add 100 g of fresh beans every week so that unused beans never run short. Predict how the number of C. maculatus adults after 12 weeks in the new mixed jars will compare with the number in the original mixed jars, if the researchers' suspicion is correct.
Score part C
Model response
There will be more C. maculatus adults in the new mixed jars than in the original mixed jars.
-
D.
Justify your prediction in part C.
Score part D
Model response
If the species compete mainly for beans to lay eggs in, keeping beans plentiful means they are no longer a limited resource. C. chinensis laying eggs on some beans no longer leaves C. maculatus short, so the C. maculatus population is no longer held down by competition and grows larger than it did in the original mixed jars.
Your score: 0 of 4, from the boxes you ticked.
-
-
Question 4: Conceptual Analysis 4 points
In mammals, the concentration of calcium ions in the blood is held close to a set point. When blood calcium falls below the set point, cells of the parathyroid glands release parathyroid hormone (PTH) into the blood. PTH binds a receptor protein on the surface of bone cells and kidney cells. The signal is passed through a pathway inside each cell, and the cells respond: bone cells release calcium into the blood, and kidney cells return more calcium to the blood instead of losing it in urine. As blood calcium rises, the parathyroid cells release less PTH.
Respond to parts A, B, C and D.
-
A.
Describe the effect of a negative feedback mechanism on a variable that has moved away from its set point.
Score part A
Model response
Negative feedback reduces the change that started it. If a variable moves away from its set point, the response pushes it back toward the set point.
-
B.
Explain how the regulation of blood calcium by PTH is an example of negative feedback.
Score part B
Model response
The stimulus is low blood calcium, which makes the parathyroid cells release PTH. PTH makes bone cells release calcium and kidney cells keep it, so blood calcium rises back toward the set point. The rising calcium then reduces PTH release. The response removes the stimulus that caused it, which is negative feedback.
-
C.
A person inherits a mutation that changes the hormone-binding part of the PTH receptor so that PTH can no longer bind to it. The rest of the receptor and the pathway inside the cells are normal. Predict how this person's blood calcium concentration and blood PTH concentration will each compare with those of a person with normal receptors.
Score part C
Model response
This person's blood calcium will be lower than normal, and their blood PTH will be higher than normal.
-
D.
Justify your predictions in part C.
Score part D
Model response
PTH cannot bind the altered receptor, so no signal is transduced into bone and kidney cells and they never respond. Blood calcium is not raised, so it stays below the set point. Because the stimulus, low calcium, is never removed, the parathyroid cells keep releasing PTH, and its concentration in the blood climbs above normal.
Your score: 0 of 4, from the boxes you ticked.
-
-
Question 5: Analyze Model or Visual Representation of a Biological Concept or Process 4 points
A model of one cell from the lining of the small intestine shows three proteins in its plasma membrane. The side of the cell facing the inside of the intestine (the lumen) holds Protein 2. The side facing the blood holds Protein 1 and Protein 3. The model gives the concentrations of sodium ions and glucose in each place, shown in the table.
- Protein 1 uses energy from ATP hydrolysis to move 3 Na⁺ out of the cell into the blood and 2 K⁺ from the blood into the cell.
- Protein 2 moves Na⁺ and glucose together from the lumen into the cell. It moves neither one alone, and it does not use ATP.
- Protein 3 can carry glucose across the membrane in either direction, into or out of the cell. It does not use ATP. In the model, glucose moves through it from the cell into the blood.
The model leaves out any glucose the cell breaks down for its own use.
Concentrations in the model, in millimoles per liter (mM) Substance Intestinal lumen Inside the cell Blood Na⁺ 140 12 145 Glucose 1 15 5 Respond to parts A, B, C and D.
-
A.
Describe how Protein 3 moves glucose from the cell into the blood, using the concentrations in the model.
Score part A
Model response
Protein 3 carries out facilitated diffusion. Glucose is more concentrated inside the cell (15 mM) than in the blood (5 mM), so it moves through Protein 3 down its concentration gradient into the blood, and no energy from ATP is needed.
-
B.
Explain how Protein 2 can move glucose into the cell even though glucose is more concentrated inside the cell than in the lumen.
Score part B
Model response
Sodium ions are much more concentrated in the lumen (140 mM) than inside the cell (12 mM), so they tend to move into the cell. Protein 2 lets Na⁺ in only together with glucose. The energy released as Na⁺ moves down its gradient drives glucose in against its own gradient, from 1 mM to 15 mM. Protein 1 keeps the sodium gradient in place by pumping Na⁺ out with energy from ATP.
-
C.
A drug blocks Protein 1 and nothing else. Predict how the concentration of glucose inside the cell will change over the next several minutes.
Score part C
Model response
The glucose concentration inside the cell will fall, toward the 5 mM in the blood.
-
D.
Justify your prediction in part C.
Score part D
Model response
Protein 1 is what keeps Na⁺ low inside the cell. Once it is blocked, sodium that enters is not pumped back out, so it builds up inside and the sodium gradient from the lumen into the cell shrinks. Protein 2 depends on that gradient, so glucose uptake slows and stops. Protein 3 still lets glucose leave down its gradient into the blood, so the glucose inside the cell falls.
Your score: 0 of 4, from the boxes you ticked.
-
Question 6: Analyze Data 4 points
Male field crickets call to attract females by rubbing their wings together. On one island, a parasitic fly arrived that finds male crickets by the sound of their calls. The fly lays larvae on a calling male, and the larvae kill him within about a week. Some males on the island carry an allele of one gene that gives them flat wings, which cannot make a sound. Flatwing males are not found by the fly. They still mate by staying close to calling males and meeting the females drawn to the calls, though they mate less often than calling males do when no fly is present. The crickets on the island produce one generation each year.
Researchers sampled about 200 adult males each year, starting in the year they first found the fly (year 0). The results are in the table.
Male crickets sampled on the island Year Males sampled Flatwing males (%) Calling males carrying fly larvae (%) 0 200 1 30 2 210 9 31 4 190 38 28 6 205 76 33 8 200 92 29 Respond to parts A, B, C and D.
-
A.
Describe the change in the percentage of flatwing males from year 0 to year 8.
Score part A
Model response
The percentage of flatwing males rose from 1 percent in year 0 to 92 percent in year 8. It rose slowly at first, fastest between years 2 and 6, and then more slowly.
-
B.
Calculate the average rate of change in the percentage of flatwing males per year between year 2 and year 6. Give the answer in percentage points per year, the change in the percentage itself, not a relative percent change.
Score part B
Model response
(76 − 9) ÷ (6 − 2) = 67 ÷ 4 = 16.75. The percentage of flatwing males rose by about 16.75 percentage points per year.
-
C.
The researchers claim that the fly caused natural selection for flat wings in this population. Use the data to support their claim.
Score part C
Model response
In every year sampled, 28 to 33 percent of calling males carried fly larvae, which kill them, while flatwing males are not found by the fly at all. So flatwing males were far more likely to survive long enough to mate and leave offspring. Flat wings are inherited through one allele, and across eight generations the share of flatwing males rose from 1 percent to 92 percent. A heritable trait that raises survival and reproduction under the fly spread through the population, which is natural selection.
-
D.
Suppose the fly disappears from the island in year 8. Predict how the percentage of flatwing males will change over the following generations, and justify your prediction.
Score part D
Model response
The percentage of flatwing males will decrease over the following generations. Without the fly, calling males are no longer parasitized, and the stem says they mate more often than flatwing males. Calling males will therefore leave more offspring, and the allele for normal wings will become more common while the flatwing allele declines. With only 8 percent of males calling at first, the fall may be slow at the start.
Your score: 0 of 4, from the boxes you ticked.
-
Your results
| Section | Score | Time used |
|---|---|---|
| Section I | ||
| Section II |
Free-response scores are the points you ticked against the scoring guide. The page never grades them.