Unit 8 · Topic 8.4 · about 30 minutes · 7 parts · 11 scored checks, 2 of them multiple choice, plus 2 from earlier lessons
AP Biology 8.4: Effect of Density on Populations
Unit 8: 10 to 15% of the multiple-choice section
What you'll be able to do
- Explain how the density of a population affects and is determined by resource availability in the environment.
Key vocabulary
| Term | What it means | The exam trap |
|---|---|---|
| Population density | The number of individuals of a population in a given area or volume. | State the area along with the count before comparing two densities. |
| Resource | Something organisms take from their environment and use, such as food, water or space. | Name the resource in question before saying what it does to a population. |
| Abundance | How many individuals of a species there are in an area. | Say whether a number is one count or a level held over time. |
| Census | A count of all the individuals in a population at one time. | Note when each count was taken before comparing two counts. |
 Tap to open the picture full size
Part 1 Think first Fish in a pond
Commit to a guess first. Being wrong now makes the right idea stick better.
Predict first
A teaching example. Fifty fish are stocked in a pond with plenty of food. Years later the fish number about 400, and it stays near 400 year after year. What best explains why the number stops rising?
In short. Carrying capacity is the sustainable abundance of a species that the ecosystem's total available resources can support, and as limits to growth are imposed, a logistic growth model typically ensues.
- Limits to growth come from density-dependent factors, whose effect changes with how crowded a population is, and density-independent factors, whose effect does not.
- Logistic growth is modeled as dN/dt = r_max N ((K − N)/K), where K is the carrying capacity.
- Growth per individual is near r_max while N is far below K, and total growth slows toward zero as N nears K.
Part 2 Learn it Limits to growth
2a. Carrying capacity
No real environment has unlimited food, water and space. Carrying capacity is the sustainable abundance of a species that can be supported by the ecosystem's total available resources. It is written K.
When N is above K, the factor (K − N)/K in the logistic model below is negative, so the model predicts that numbers fall back toward K. More resources in an area raise the carrying capacity; fewer lower it. In that way, how dense a population can be is determined by the resources available.
Quick check · Multiple choice
A grassland's total available food and water can sustain about 300 bison over many years. In some years the herd briefly reaches 340 before falling back. Which statement about the grassland's carrying capacity for bison is best?
2b. Limits that depend on density, and limits that do not
Limits to growth come from two kinds of factors.
- A density-dependent factor has an effect that changes with how crowded the population is. Competition for food is one: in a crowded population each individual gets less.
- A density-independent factor has an effect that does not depend on how crowded the population is. A sudden freeze can kill a large share of a population whether it is crowded or sparse.
So density works both ways. Resources decide how dense a population can become, and how dense it is changes how hard density-dependent factors bear on it.
Quick check · Sort it
Each card describes a limit on the growth of an animal population. Tap a card, then the kind of factor it is.
Density-dependent
Density-independent
2c. Logistic growth
As limits to growth attributable to density-dependent and density-independent factors are imposed, a logistic growth model typically ensues:
dN/dt = r_max N ((K − N)/K)
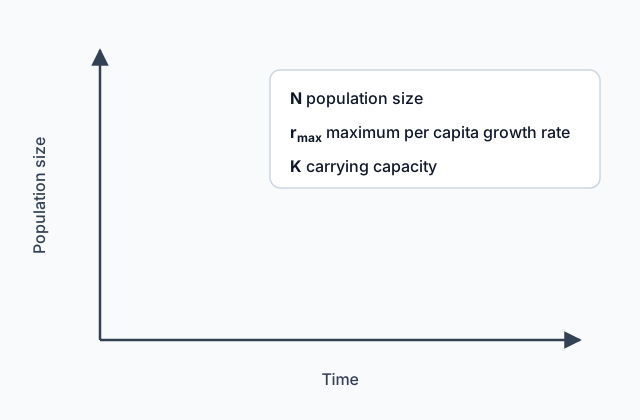
N is the population size, r_max the maximum per capita growth rate and K the carrying capacity.
The factor (K − N)/K is the share of the carrying capacity still unused. For a population of 100 with K = 1,000 and r_max = 0.5 per year, it is 900/1,000 = 0.9, so dN/dt = 0.5 × 100 × 0.9 = 45 a year. A graph of logistic growth typically rises slowly at first, then steeply, then levels off as N nears K.
Quick check · Calculate
A teaching example: a population has N = 250, r_max = 0.4 per year and a carrying capacity K = 1,000. Using dN/dt = r_max N ((K − N)/K), how fast is it growing?
Part 3 Watch it done Beetles nearing their limit
Predict first, then watch each step, then finish the reasoning yourself.
A teaching example. A beetle population in a field has r_max = 0.5 per month and a carrying capacity of 800. How fast does it grow when it holds 200 beetles, and when it holds 720?
Predict first
Before you open the first step, predict: as the population rises from 200 to 720, what happens to its growth rate?
Step 1 · Name the model
The field limits the population to a carrying capacity, K = 800, so use dN/dt = r_max N ((K − N)/K).
Step 2 · Work the growth at 200
(K − N)/K = 600/800 = 0.75, so dN/dt = 0.5 × 200 × 0.75 = 75 beetles per month.
Why this step?
Why work out (K − N)/K on its own first?
It is the share of the carrying capacity still unused. It shrinks toward 0 as N nears K, and that is what slows logistic growth; working it first shows how close to the limit the population is.
Step 3 · Set up the growth at 720
Keep r_max = 0.5 and K = 800, and put N = 720 into the equation.
Your step · Calculate
A teaching example: a beetle population has r_max = 0.5 per month and a carrying capacity K = 800. Using dN/dt = r_max N ((K − N)/K), how fast is it growing when it holds 720 beetles?
beetles per month
36 beetles per month, less than half the 75 at 200, though the population is more than three times as large. Near K, the unused share of the carrying capacity is small, so logistic growth slows toward zero.
Part 4 Try it Close to the limit, and far below it
Two new situations, both teaching examples. First, rank three populations of one species with the same r_max and carrying capacity by how fast they grow. Second, decide how a fish population grows after a flood leaves it far below its carrying capacity.
Try it · Rank it
Three populations of one species each have r_max = 0.2 per year and a carrying capacity K = 500. Population A holds 100 individuals, population B holds 250 and population C holds 480. Using dN/dt = r_max N ((K − N)/K), rank them by dN/dt, from fastest growing to slowest growing.
Fastest growing first
Give each one a place, 1 for first. Give two the same place if they are equal.
Your ranking: none yet
Try it · Decide and justify
A fish population in a lake has held steady at its carrying capacity of 2,000. A flood kills 1,500 of the fish but does not change the lake's food or space. Will the population grow faster or slower in the year after the flood than in the year before it?
Which statement supports your decision?
Part 5 Explain it Sheep on a new island
On the exam this is handwritten, so answer on paper first. Nothing you type here leaves this page. Then check your answer against the model and each scoring point.
Free response is 50% of the exam score. This one is shaped like Question 6, Analyze Data.
Free-response practice · Question 6 style
A teaching example. Two hundred sheep are released on an island with no sheep. Ranchers count them every 10 years. At years 0, 10, 20, 30 and 40 the counts are 200, 900, 1,550, 1,700 and 1,680.
(a) Describe how the growth of the population changes over the 40 years.
(b) Identify an approximate carrying capacity of the island for sheep, and justify your estimate with the data.
(c) Using dN/dt = r_max N ((K − N)/K), explain why the population's growth slows as it nears the carrying capacity.
(d) A storm kills half the sheep in year 41 without changing the island's plants or water. Predict how the population changes in the years after the storm.
Model answer
(a) The population grows quickly at first, by 700 in the first 10 years and 650 in the next 10, then slows to 150 in the third 10 years and levels off near 1,700.
(b) About 1,700 sheep. The counts stop rising and stay near that number from year 30 to year 40, which is the sustainable abundance the island's resources support.
(c) As N nears K, the factor (K − N)/K, the unused share of the carrying capacity, gets close to 0, so r_max N ((K − N)/K) gets small even though N is large.
(d) The population falls to about 840, well below K. With (K − N)/K larger, it grows faster than before the storm and rises back toward about 1,700, since the storm did not change the resources that set K.
Score your own answer. This is a self-check, not a grade. Tick each point your answer makes.
Part 6 Check yourself Flour beetles in a jar
All three case questions use the table.
A student places 20 flour beetles in a closed jar of flour, adds fresh flour at the same rate throughout, and counts the beetles every two weeks. No beetles enter or leave the jar. These numbers are a teaching example.
| Week | Number of beetles |
|---|---|
| 0 | 20 |
| 2 | 60 |
| 4 | 160 |
| 6 | 330 |
| 8 | 440 |
| 10 | 480 |
| 12 | 490 |
Case question 1 · Multiple choice
Using the table: which is the best estimate of the jar's carrying capacity for flour beetles?
Case question 2 · Calculate
Using the table: what was the average increase in beetles per week between week 2 and week 4?
Case question 3 · Decide and justify
Using the table: between week 10 and week 12 the population grew by only 10 beetles. Does this show that the beetles had stopped reproducing?
Which statement supports your decision?
The rest stand on their own and do not use the case.
Check yourself · Fill the statement
Complete the description of the logistic growth equation, dN/dt = r_max N ((K − N)/K).
When N is much smaller than K, the factor (K − N)/K is close to , so growth is nearly . When N equals K, the factor equals , and the population stops growing.
Check yourself · Spot the error
A forest's carrying capacity for deer is 600, and the deer population has reached 900. A student reasons about what happens next. Tap the line with the mistake.
Part 7 Keep it Bring back earlier ideas
Limits to growth decide which individuals survive and reproduce. Pulling back what a population is, and how fitness is measured, sets carrying capacity beside them.
From 8.3 Population Ecology · Multiple choice
Which of these groups is a population?
From 7.1 Introduction to Natural Selection · Multiple choice
Four birds of one species nest in the same forest. Bird A lays 12 eggs, and 2 of its chicks survive to breed. Bird B lays 6 eggs, and 5 survive to breed. Bird C lays 8 eggs, and 3 survive to breed. Bird D lays 4 eggs, and all 4 survive to breed. Which bird has the highest evolutionary fitness?
In three lines
- Carrying capacity, K, is the sustainable abundance of a species that the ecosystem's total available resources support.
- Density-dependent and density-independent factors limit growth, and a logistic model typically ensues.
- Logistic growth is dN/dt = r_max N ((K − N)/K): the growth per individual shrinks as N nears K, and growth slows toward zero.
Exam strategy for this topic
- Section I, Multiple Choice: 60 questions in 90 minutes.
- Section II, Free Response: 6 questions in 90 minutes.
- This lesson's Explain it is shaped like free-response question 6, Analyze Data.
- A four-function, scientific, or graphing calculator is allowed on both sections of the exam.
When a population levels off, name the carrying capacity from where the counts settle, and explain the slowing with (K − N)/K shrinking toward zero, not with births stopping.
Questions students ask
What is carrying capacity?
Carrying capacity is the sustainable abundance of a species that can be supported by the ecosystem's total available resources. It is written K.
What is the difference between density-dependent and density-independent factors?
A density-dependent factor, such as competition for food, has an effect that changes with how crowded a population is. A density-independent factor, such as a sudden freeze, has an effect that does not.
What is the logistic growth equation?
dN/dt = r_max N ((K − N)/K), where N is population size, r_max is the maximum per capita growth rate and K is the carrying capacity.
Why does logistic growth slow down?
As N nears K, the factor (K − N)/K, the unused share of the carrying capacity, gets close to zero, so the growth rate falls toward zero.
When does logistic growth happen?
As limits to growth attributable to density-dependent and density-independent factors are imposed, a logistic growth model typically ensues.
Course alignment, for teachers
AP Biology topic 8.4, Unit 8: Ecology.
- Skill 5.A: Perform mathematical calculations, including:
This lesson maps all 2 essential knowledge statements of the topic to the part that teaches each one: 2 are checked by a scored question. The map is in the lesson file.