Unit 8 · Topic 8.3 · about 30 minutes · 7 parts · 11 scored checks, 2 of them multiple choice, plus 2 from earlier lessons
AP Biology 8.3: Population Ecology
Unit 8: 10 to 15% of the multiple-choice section
What you'll be able to do
- Describe factors that influence growth dynamics of populations.
Key vocabulary
| Term | What it means | The exam trap |
|---|---|---|
| Population size | The number of individuals in a population, written N. | Note the moment a count was taken before using it in a calculation. |
| Birth rate | The number of individuals born into a population per unit of time. | Check the unit of time before comparing two rates. |
| Death rate | The number of individuals in a population that die per unit of time. | Set births and deaths over the same stretch of time before combining them. |
| Per capita | Per individual: a total divided by the number of individuals. | Say whether a number is a total or a per capita figure before using it. |
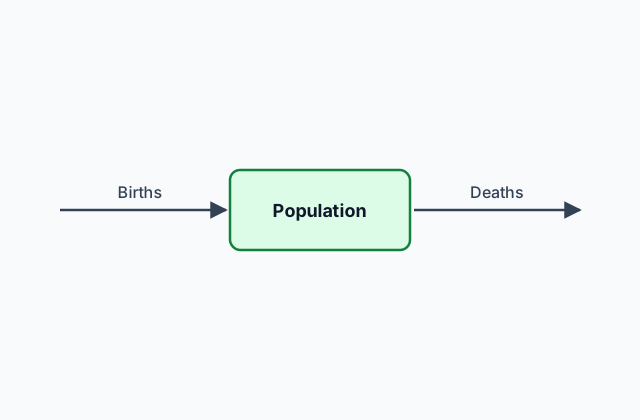 Tap to open the picture full size
Part 1 Think first Rabbits on an empty island
Commit to a guess first. Being wrong now makes the right idea stick better.
Predict first
A teaching example. Twenty rabbits are released on an island with plenty of food and space and no predators. Each year, how does the number of rabbits added to the population change over the first few years?
In short. A population's growth depends on its birth rate, its death rate and its size, and reproduction without constraints results in exponential growth.
- A population is made of individual organisms of the same species that interact with one another and with the environment in complex ways.
- The change in population size over time is births minus deaths: dN/dt = B − D.
- Without constraints, dN/dt = r_max N, so the larger the population, the faster it grows.
Part 2 Learn it How populations grow
2a. What a population is
A population is made of individual organisms of the same species that interact with one another and with the environment in complex ways. Members of a population can compete for food, choose mates among one another and share the same place and conditions.
Many adaptations in organisms are related to obtaining and using energy and matter in a particular environment.
Quick check · Multiple choice
Which of these groups is a population?
2b. Births, deaths and change
Population growth dynamics depend on birth rate, death rate and population size. Births add individuals and deaths remove them, so the change in population size over time is
dN/dt = B − D
Here N is the population size, dN is the change in population size, dt is the change in time, B is the birth rate and D is the death rate.
For example, a population with 90 births and 30 deaths in a year changes by 90 − 30 = 60 individuals that year. When deaths outnumber births, dN/dt is negative and the population gets smaller.
Quick check · Calculate
A teaching example: a population of frogs in a pond has a birth rate B of 180 frogs per year and a death rate D of 140 frogs per year. Using dN/dt = B − D, by how many frogs per year is the population changing? Give a negative number for a decrease.
2c. Growth without constraints
Reproduction without constraints results in the exponential growth of a population:
dN/dt = r_max N
Here r_max is the maximum per capita growth rate of the population, the most the population can grow per individual in a unit of time.
While r_max stays the same, dN/dt depends on N. A population of 100 with r_max = 0.2 per year grows by 0.2 × 100 = 20 a year; at 200 it grows by 40 a year. Each year adds more individuals than the year before, so a graph of N against time curves upward more and more steeply.
Quick check · Fill the statement
Complete the description of a population that reproduces without constraints.
Its growth is . In the equation dN/dt = r_max N, the number added per unit of time gets as N gets larger, and a graph of N against time curves more and more steeply.
Part 3 Watch it done Rabbits growing without limits
Predict first, then watch each step, then finish the reasoning yourself.
A teaching example. A population of 400 rabbits on an island reproduces without constraints, with r_max = 0.3 per year. How fast is it growing now, and how fast will it grow when it reaches 800 rabbits?
Predict first
Before you open the first step, predict: when the population doubles from 400 to 800, what happens to its growth rate?
Step 1 · Name the model
Reproduction without constraints gives exponential growth, so use dN/dt = r_max N.
Step 2 · Work the growth now
dN/dt = 0.3 × 400 = 120 rabbits per year.
Why this step?
Why does the population size go into the equation, rather than r_max alone?
r_max is growth per individual. The more individuals there are to reproduce, the more are added in all, so the total growth rate is r_max times N.
Step 3 · Set up the growth at 800
Keep r_max = 0.3 per year and put N = 800 into dN/dt = r_max N.
Your step · Calculate
A teaching example: a rabbit population reproduces without constraints, with r_max = 0.3 per year. Using dN/dt = r_max N, how fast is it growing when it holds 800 rabbits?
rabbits per year
240 rabbits per year. The population doubled and so did its growth rate, because r_max stayed at 0.3 while N doubled. That is why exponential growth gets faster and faster.
Part 4 Try it Births, deaths and growth
Two new situations, both teaching examples. First, sort changes in a population's births and deaths by their effect on dN/dt. Second, decide whether a student is right about how a bacterial population grows without constraints.
Try it · Sort it
Each card describes one change to a population, with everything else staying the same. Tap a card, then its effect on dN/dt.
Raises dN/dt
Lowers dN/dt
Try it · Decide and justify
Bacteria in a lab dish reproduce without constraints, with r_max staying the same. A student says that, because r_max does not change, the number of new bacteria added each hour stays the same. Is the student right?
Which statement supports your decision?
Part 5 Explain it A culture with room to grow
On the exam this is handwritten, so answer on paper first, and draw the graph on paper. Nothing you type here leaves this page. Then check your answer against the model and each scoring point.
Free response is 50% of the exam score. This one is shaped like Question 2, Interpreting and Evaluating Experimental Results with Graphing.
Free-response practice · Question 2 style
A teaching example. A student places 20 single-celled organisms of one species in a large flask with plenty of food and counts them each day. On days 0, 1, 2, 3 and 4 the counts are 20, 40, 80, 160 and 320 organisms.
(a) Construct a graph of the data on paper, with time on the x-axis.
(b) Describe the pattern of growth the graph shows.
(c) Using dN/dt = B − D, explain what must be true of the birth rate and the death rate while the population grows.
(d) Explain why the number added per day gets larger even though the organisms have the same maximum per capita growth rate each day.
Model answer
(a) Day on the x-axis from 0 to 4 and number of organisms on the y-axis from 0 to at least 320, both labeled, with the five points plotted and joined. The line curves upward more and more steeply.
(b) The population grows exponentially: it doubles each day, so it adds 20, then 40, then 80, then 160 organisms, more each day than the day before.
(c) dN/dt is positive, so the birth rate B must be greater than the death rate D.
(d) Growth without constraints is dN/dt = r_max N. With r_max the same, the number added depends on N, and each day N is larger, so more organisms reproduce and more are added.
Score your own answer. This is a self-check, not a grade. Tick each point your answer makes.
Part 6 Check yourself Deer on an island
All three case questions use the table.
Ecologists count the deer on an island at the start of each year and record the births and deaths during the year. A harsh winter came in year 3. These numbers are a teaching example.
| Year | Deer at start of year | Births during year | Deaths during year |
|---|---|---|---|
| 1 | 500 | 150 | 50 |
| 2 | 600 | 180 | 60 |
| 3 | 720 | 160 | 200 |
Case question 1 · Calculate
Using the table and dN/dt = B − D: by how many deer did the population change during year 2? Give a negative number for a decrease.
Case question 2 · Multiple choice
Using the table: which statement best describes the deer population during year 3?
Case question 3 · Decide and justify
Using the table: are the changes in years 1 and 2 consistent with exponential growth, in which dN/dt = r_max N?
Which statement supports your decision?
The rest stand on their own and do not use the case.
Check yourself · Spot the error
A student works out how a population of 1,000 mice is changing, with 300 births and 350 deaths per year. Tap the line with the mistake.
Check yourself · Match
Match each symbol in the population growth equations to what it stands for.
Part 7 Keep it Bring back earlier ideas
How many individuals a population holds rests on the energy it can get. Pulling back what a net gain or loss of energy does to an organism, and what a few founders mean for a new population, sets population growth beside them.
From 8.2 Energy Flow Through Ecosystems · Sort it
Each card describes a change in an animal over one season. Tap a card, then whether that change is what a net gain or a net loss of energy results in.
Net gain of energy
Net loss of energy
From 7.4 Population Genetics · Decide and justify
Six lizards drift on a fallen tree from the mainland to an island where none of their species lived. They breed there, and over many generations a large island population grows from them. Is the island population's makeup an example of the bottleneck effect or the founder effect?
Which statement supports your decision?
In three lines
- A population is individuals of one species that interact with one another and with the environment in complex ways.
- Growth depends on birth rate, death rate and population size: dN/dt = B − D.
- Reproduction without constraints gives exponential growth, dN/dt = r_max N, so a larger population grows faster.
Exam strategy for this topic
- Section I, Multiple Choice: 60 questions in 90 minutes.
- Section II, Free Response: 6 questions in 90 minutes.
- This lesson's Explain it is shaped like free-response question 2, Interpreting and Evaluating Experimental Results with Graphing.
- A four-function, scientific, or graphing calculator is allowed on both sections of the exam.
When a question gives births, deaths or a population size, write the equation first, dN/dt = B − D or dN/dt = r_max N, then put in the numbers and read the sign of the answer.
Questions students ask
What is a population in biology?
A population is made of individual organisms of the same species that interact with one another and with the environment in complex ways.
What does population growth depend on?
Population growth dynamics depend on birth rate, death rate and population size. The change in population size over time is dN/dt = B − D.
What is exponential growth?
Reproduction without constraints results in exponential growth, modeled as dN/dt = r_max N, where r_max is the maximum per capita growth rate of the population.
Why does exponential growth get faster over time?
In dN/dt = r_max N, the growth rate depends on N. As the population gets larger, more individuals reproduce, so more are added per unit of time.
Course alignment, for teachers
AP Biology topic 8.3, Unit 8: Ecology.
- Skill 4.A: Construct a graph to represent the data, including: x-y graphs (bar, histogram, line, log scale, dual y), scatter plot, box and whisker plot, and pie chart.
This lesson maps all 2 essential knowledge statements of the topic to the part that teaches each one: 2 are checked by a scored question. The map is in the lesson file.