Unit 5 · Topic 5.8 · about 30 minutes · 7 parts · 12 scored checks, 3 of them multiple choice
AP Calculus AB 5.8: Sketching Graphs of Functions and Their Derivatives
Unit 5: 15 to 20% of the multiple-choice section
What you'll be able to do
- Justify where a function rises, falls, turns and changes its bend from what its first and second derivatives do, whether they come as a graph, a table or a formula.
Key vocabulary
| Term | What it means | The exam trap |
|---|---|---|
| Key features of a graph | The places and intervals that give a graph its shape: where it increases or decreases, its relative extrema, where it is concave up or down, and its points of inflection. | A feature of shows up as a different feature of , so say which graph you are reading before you name a feature. |
| Relative (local) extremum | A value that is the greatest (a relative maximum) or the least (a relative minimum) of the values of near . | "Where" asks for the -value , and "what value" asks for ; read which one the question wants. |
| Concave up and concave down | The graph of is concave up on an open interval where is increasing, and concave down on one where is decreasing. | Give the interval and a reason that names or ; a description of the picture alone is not a justification. |
| Point of inflection | A point on the graph of a continuous function where the graph changes from concave up to concave down, or from concave down to concave up. | alone does not make one: check that really changes sign at . |
| Graphical, numerical and analytical representations | A function or its derivative given as a graph, as a table of values, or as a formula. | From a table, claim only what the listed values and the stated facts support, and say which facts you used. |
 Tap to open the picture full size
Part 1 Think first When is the line longest?
Guess before you learn. A wrong guess still makes the answer stick.
Predict first
A coffee shop counts the people waiting in line. minutes after it opens, the length of the line changes at the rate people per minute, for . The rate is greatest at , falls to 0 at , and is negative after that. When is the line longest?
In short. Sketching a function from its derivatives means reading the sign of for the direction of , reading the sign of (or whether rises or falls) for its bend, and joining the pieces where either one changes.
- On an interval where the graph of rises, where it falls, and where changes sign has a relative extremum.
- On an interval where is increasing, or , the graph of is concave up; where is decreasing, or , it is concave down.
- Each key feature of is a different feature of , and you can find it in a graph, a table or a formula.
Part 2 Learn it Three readings of a derivative, each checked as you go
8a. The sign of gives the direction of
When you are handed instead of , read its sign first. Where , is increasing. Where , is decreasing. Where changes sign, turns: from positive to negative is a relative maximum of , and from negative to positive is a relative minimum.
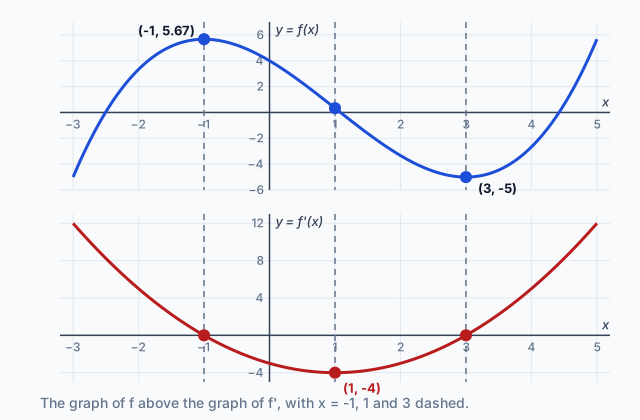
Take the graphs at the top of this page. In the lower panel, the graph of is above the -axis for , below it for , and above it again for . So in the upper panel rises, falls, then rises, with a relative maximum at and a relative minimum at .
The height of does not decide any of this. The lowest point of the graph of , at , is not a turning point of : , so is still falling there, at its steepest.
A zero of with no sign change is not a turning point either. If , then is negative just left of 0 and just right of it, because is positive on both sides and is negative. So keeps decreasing through , and it turns only at .
Quick check · Multiple choice
No calculator. The derivative of a function is . At which values of does have a relative extremum?
8b. Whether rises or falls gives the bend of
Direction is half a sketch. The other half is the bend. The graph of is concave up on an interval where is increasing, and concave down on an interval where is decreasing. When exists, that is the same as or there.
At the top of the page, the graph of falls until and rises after it. So the graph of is concave down for and concave up for . The point where the bend changes, , is a point of inflection of . In the panel it is the lowest point. In the panel it is where the curve falls most steeply.
Put the two readings together and every interval gets one of four shapes: rising and bending up, rising and bending down, falling and bending up, or falling and bending down. A sketch of joins those pieces at the -values where or changes sign, and uses any values of you are given to place them. Without at least one value of , the derivatives fix the shape but not the height.
Quick check · Sketch the graph
No calculator. A function is twice differentiable on , and . Its derivative is decreasing on the whole interval, and . Sketch the graph of from to . The first point is fixed at 0.
One shape that fits
Drag a point up or down, or tap it and use the arrow keys. Only the shape is checked.
8c. One feature, three ways to see it
The facts about a function can come as a graph, a table of values or a formula, and each feature of has a partner feature of in all three. A relative maximum or minimum of is a place where changes sign. An interval where increases is one where is positive. A point of inflection of is a place where changes from increasing to decreasing, or the reverse. A concave up stretch of is one where is increasing.
From a formula, find these with algebra: solve , then test the sign of (and of ) between the solutions. From a table, read the signs and trends of the listed values, and claim only what the table and the given facts support. From a graph, read them by eye, then say what you read in calculus terms: " is decreasing on because there," never "it goes down."
Name , or every time. With two graphs on the page, "it" leaves a reader guessing which one you mean, and the two say different things.
Quick check · Match
No calculator. Each statement about follows from one statement about . Tap a statement about , then its partner.
Part 3 Watch it done Describing a graph from its derivatives
Watch each step, then do the last one yourself.
Let . Use and to describe the graph of : where it rises and falls, its relative extrema, how it bends, and where the bend changes.
Step 1 · Find the first derivative and its zeros
, so at and at .
Step 2 · Read the sign of the first derivative
, and . So is increasing for , decreasing for , and increasing for . Because changes from positive to negative at , has a relative maximum ; because changes from negative to positive at 3, has a relative minimum .
Why this step?
Why does one test value of settle the sign on a whole interval?
is a polynomial, so it is continuous, and it is 0 only at and 3. A continuous function cannot change sign without passing through 0, so between those zeros keeps one sign, and any value you test shows it.
Step 3 · Find the second derivative
. It is negative at , since , and positive at , since .
Your step · Calculate
No calculator. Finish it. For , the second derivative is . At what value of does the graph of have a point of inflection?
Part 4 Try it Two new derivatives to read
Try it · Spot the error
No calculator. The derivative of a function is . A student describes the graph of . Tap the first line with a mistake.
Try it · Decide and justify
No calculator. A function is twice differentiable on . Its derivative is decreasing on and increasing on , with , and . A classmate says has a relative minimum at , because has its least value there. Is the classmate right?
Which reason supports your answer?
Part 5 Explain it Write it the way the exam asks
On the exam free response is handwritten, so work on paper first. Nothing you type here leaves this page. Then compare with the model answer and score each point.
Free response is 50% of the exam score. This one is shaped like Question 3, from free-response Part B (calculator not permitted).
Free-response practice · Question 3 style
No calculator. The depth of water in a tidal pool is centimeters, hours after 6 a.m., for . The depth changes at the rate centimeters per hour.
(a) Find . Using correct units, interpret the meaning of this value in the context of the problem.
(b) For , at what times does the depth of the water have a relative maximum or a relative minimum? Justify your answer.
(c) On what open intervals in is the graph of concave up? Justify your answer.
Model answer
(a) . At 9 a.m. (), the depth of the water is decreasing at a rate of 3 centimeters per hour.
(b) , which is 0 at and . for , for , and for . has a relative maximum at because changes from positive to negative there, and a relative minimum at because changes from negative to positive there.
(c) , which is negative for and positive for . The graph of is concave up on because there; equally, is increasing there.
Score your own answer. This is a self-check, not a grade. Tick each point your answer makes.
Part 6 Check yourself A function known only through a table
The two case questions use the same table. Answer them from it.
A function is twice differentiable for , with , and . The table gives the sign of and of at those points and on the intervals between them.
| Positive | Negative | |
| 0 | Negative | |
| Negative | Negative | |
| Negative | 0 | |
| Negative | Positive | |
| 0 | Positive | |
| Positive | Positive |
Case question 1 · Calculate
No calculator. Based on the table and the given values, what is the relative maximum value of on ?
Case question 2 · Sort it
No calculator. Using the table, tap an interval, then tap the shape of the graph of on it.
Increasing, concave up
Increasing, concave down
Decreasing, concave up
Decreasing, concave down
The rest stand on their own and do not use the case.
Check yourself · Fill the statement
No calculator. Tap a blank, then tap an answer.
The graph of crosses the -axis from above to below at , so has a at . The graph of falls until and rises after it, so the graph of has a at .
Check yourself · Multiple choice
No calculator. Let , so and . Which statement about is true?
Part 7 Keep it Bring back earlier ideas
This lesson stands on the second derivative test from earlier in this unit and on the chain rule from Unit 3. Pulling them back up is what makes them last.
Bring it back · Multiple choice
No calculator. A function is twice differentiable, with and . Which statement about must be true?
Bring it back · Calculate
No calculator. Let . Find .
In three lines
- The sign of says where rises or falls, and a sign change of marks a relative extremum of .
- Whether rises or falls, which is the sign of , says how the graph of bends, and a change marks a point of inflection.
- Each feature of has a partner feature of , whether you are given a graph, a table or a formula.
Exam strategy for this topic
- Section I Part A, Multiple Choice (calculator not permitted): 29 questions in 62 minutes.
- Section I Part B, Multiple Choice (graphing calculator required): 13 questions in 38 minutes.
- Section II Part A, Free Response (graphing calculator required): 2 questions in 30 minutes.
- Section II Part B, Free Response (calculator not permitted): 4 questions in 60 minutes.
When you justify a conclusion about from a derivative, name the derivative and say what it does: " has a relative minimum at because changes from negative to positive there." A sentence such as "it goes down" gives no calculus reason, and "it" leaves the reader unsure which function you mean.
Questions students ask
If I am given only the graph of , can I find the values of ?
Not from alone. tells you how changes, not where it starts, so you need at least one value of to place the graph. With one value you can sketch the shape; finding other values exactly takes integrals, which Unit 6 teaches.
Is a point where always a point of inflection?
No. has , but is positive on both sides of 0, so the graph is concave up throughout. Check that changes sign.
How do I find concavity from a graph of when I do not have ?
Look at whether the graph of is rising or falling. Where it rises, the graph of is concave up; where it falls, concave down. Which side of the -axis is on does not matter for this.
Why write instead of "the derivative" or "it" in a justification?
A reader has two or three graphs in mind at once. "It is positive" could be about or about , and those mean different things. Naming the function removes the doubt.
Can have a relative extremum where does not exist?
Yes, if is continuous there and changes sign, as does at 0. Look for sign changes of at the points where it is 0 and where it does not exist.
Course alignment, for teachers
AP Calculus AB topic 5.8, Unit 5: Analytical Applications of Differentiation.
- Skill 2.D: Identify how mathematical characteristics or properties of functions are related in different representations.
This lesson maps all 2 essential knowledge statements of the topic to the part that teaches each one: 2 are checked by a scored question. The map is in the lesson file.