Unit 3 · Topic 3.6 · about 30 minutes · 7 parts · 12 scored checks, 3 of them multiple choice
AP Macroeconomics 3.6: Changes in the AD–AS Model in the Short Run
Unit 3: 17 to 27% of the multiple-choice section
What you'll be able to do
- Explain how an aggregate demand shock or an aggregate supply shock changes output, employment and the price level in the short run, using a graph where it helps.
Key vocabulary
| Term | What it means | The exam trap |
|---|---|---|
| Positive and negative shocks | Events that shift aggregate demand or short-run aggregate supply to the right (positive) or the left (negative). | Positive means the curve shifts right, so a positive SRAS shock lowers the price level and a negative SRAS shock raises it. |
| Demand-pull inflation | A rise in the price level caused by an increase in aggregate demand. | Rising prices with rising output and falling unemployment mark demand-pull; if output fell while prices rose, the inflation is cost-push. |
| Cost-push inflation | A rise in the price level caused by a decrease in short-run aggregate supply, usually from higher production costs. | Higher wages or energy prices shift SRAS, not AD, so cost-push inflation comes with less output and more unemployment rather than a boom. |
| Short run | The period in which some wages and prices have not yet adjusted, so a shock can move output away from full employment. | LRAS does not move after a spending or cost shock, so in the short run the new equilibrium can sit off LRAS, where the shifted curve crosses the one that did not move. |
 Tap to open the picture full size
Part 1 Think first Oil doubles overnight
Guess before you learn. A wrong guess still makes the answer stick.
Predict first
In a country where trucks, farms and factories all run on diesel, the world price of oil suddenly doubles and stays there. Over the next year, what most likely happens to prices in stores and to the number of people with jobs?
In short. In the short run, a shock that moves aggregate demand pushes real output, employment and the price level the same way, while a shock that moves short-run aggregate supply pushes output and employment one way and the price level the other.
- A shift of aggregate demand moves real output, employment and the price level in the same direction.
- A shift of short-run aggregate supply moves real output and employment one way and the price level the other.
- Inflation from rising spending is demand-pull; inflation from rising production costs is cost-push.
Part 2 Learn it Four short ideas, each checked as you go
2a. A shock to aggregate demand
Start from short-run equilibrium, where the AD curve crosses the SRAS curve. A shock is any event that moves one of those curves. A positive shock to aggregate demand means households, firms, government or foreign buyers want to buy more real output at every price level, so AD shifts right. A negative shock shifts it left.
When AD shifts right along an SRAS curve that has not moved, the new crossing is up and to the right. Firms produce more real output to meet the extra spending and hire more workers to do it, so employment rises and unemployment falls. The price level rises too. A negative AD shock runs all three the other way: less output, fewer jobs, a lower price level.
So after an AD shock, output, employment and the price level all move in the same direction as the shift.
Quick check · Fill the statement
Tap a blank, then tap a word.
Businesses grow gloomy about future sales and cut spending on new equipment. That shifts to the , and in the short run the price level .
2b. A shock to short-run aggregate supply
SRAS moves when the cost of producing changes for many firms at once: wages, energy, raw materials. A positive shock to SRAS, such as cheaper energy, lets firms supply more real output at every price level, so SRAS shifts right. A negative shock, such as a jump in the price of oil, shifts it left.
Now AD stays put and the crossing slides along it. Because AD slopes down, output and the price level end up moving in opposite directions. When SRAS shifts left, real output falls, employment falls with it, and the price level rises. When SRAS shifts right, output and employment rise and the price level falls.
That is the answer to the diesel question: a negative supply shock gives you higher prices and fewer jobs at the same time.
Quick check · Match
Tap a shift, then tap what happens in the short run.
2c. Two kinds of inflation
Two of the four shifts raise the price level, and economists name the inflation after its cause.
Demand-pull inflation comes from aggregate demand: buyers want more output than the economy is producing at the old price level, and their spending pulls prices up. It arrives with rising output and falling unemployment.
Cost-push inflation comes from aggregate supply: higher production costs push firms to charge more for the same output. It arrives with falling output and rising unemployment, so prices and jobs get worse at the same time. It is the oil story.
The question to ask is always the same: did the shock start with spending, or with the cost of producing?
Quick check · Sort it
Each event happens on its own in an economy at full employment. Tap an event, then tap the kind of short-run effect it has on the price level.
Demand-pull inflation
Cost-push inflation
The price level falls
2d. Showing the shift on a graph
Free-response questions ask you to show a shock on a correctly labeled graph. A graph a grader can follow does four things:
- Labels the axes Price level (vertical) and Real output (horizontal), and draws a downward-sloping AD, an upward-sloping SRAS and a vertical LRAS at full-employment output, labeled YF.
- Marks the starting equilibrium where AD meets SRAS, with PL1 and Y1 on the axes.
- Draws the new curve on the correct side, labeled with a 2: AD2 or SRAS2, with an arrow showing which way it moved.
- Marks the new short-run equilibrium where the new curve crosses the curve that did not move, with PL2 and Y2 on the axes.
These shocks change spending or production costs, not what the economy can produce at full employment, so LRAS stays put and the new equilibrium can sit off it. That is the output gap, and 3.7 shows what happens to it next.
A positive demand shock
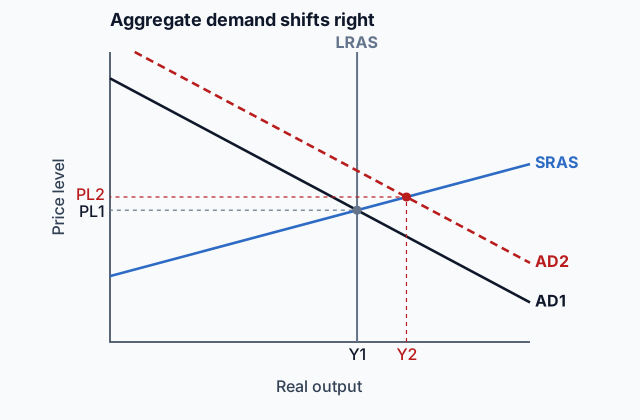
AD shifts right from AD1 to AD2. The new crossing with SRAS has higher real output (Y2) and a higher price level (PL2), to the right of LRAS.
Quick check · Spot the error
A student described how they showed a sharp rise in the price of steel, an input for many firms, on an AD-AS graph. Tap the first line with a mistake.
Part 3 Watch it done A drought raises the cost of food
Watch each step, then do the last one yourself.
An economy is in long-run equilibrium. A long drought sharply raises the price of grain, which farms, food makers and restaurants all buy. Show the short-run effect on the AD-AS graph and decide what kind of inflation follows.
Step 1 · Pick the curve
Grain is an input. Its price is part of what it costs many firms to produce, so the shock hits short-run aggregate supply, not spending.
Step 2 · Pick the side
Higher costs mean firms supply less real output at every price level, so SRAS shifts left, from SRAS1 to SRAS2.
Why this step?
Why does AD stay where it is?
Nothing in the story changes how much households, firms, government or foreign buyers want to spend at a given price level. The drought changes what it costs to produce, which is supply.
Step 3 · Find the new equilibrium
SRAS2 crosses the unchanged AD up and to the left of the old point. Real output falls from Y1 to Y2, so firms need fewer workers and unemployment rises. The price level rises from PL1 to PL2.
Your step · Decide and justify
Finish the analysis. What kind of inflation does the drought cause?
Which reason supports your choice?
The drought on the graph
SRAS shifts left from SRAS1 to SRAS2 along an unchanged AD. Real output falls from Y1 to Y2, below full-employment output (left of LRAS), and the price level rises from PL1 to PL2.
Part 4 Try it Draw it yourself
One step further. Real economies are rarely hit by one shock at a time. When two curves move at once, decide what each shift does on its own. Where the two agree, you know the direction. Where they disagree, the answer depends on which shift is bigger, and without sizes you cannot say.
Try it · Multiple choice
In the same year, consumer confidence rises sharply and the cost of shipping goods rises sharply for most firms. Compared with the starting equilibrium, what can you say for certain about the short run?
Part 5 Explain it Write it the way the exam asks
Nothing you type leaves this page.
Free response is 33.35% of the exam score. This one is shaped like Question 2, Short.
Free-response practice · Question 2 style
Assume the economy of Freedonia is in long-run equilibrium. (a) Draw a correctly labeled graph of aggregate demand and aggregate supply showing LRAS at full-employment output labeled YF, the equilibrium price level labeled PL1 and real output labeled Y1. (b) Suppose household wealth rises sharply after a boom in home prices. On your graph, show the short-run effect, labeling the new price level PL2 and real output Y2. (c) Will the unemployment rate increase, decrease, or stay the same in the short run? Explain. (d) Identify the type of inflation that results. Explain.
Model answer
(a) Price level on the vertical axis and real output on the horizontal, with a downward-sloping AD1, an upward-sloping SRAS and a vertical LRAS at full-employment output, YF. AD1 and SRAS cross on LRAS at PL1 and Y1, so Y1 equals YF. (b) AD shifts right to AD2, shown by an arrow from AD1. The new equilibrium, where AD2 crosses SRAS, shows PL2 above PL1 and Y2 to the right of Y1. (c) The unemployment rate falls, because firms produce more real output and hire more workers to do it. (d) It is demand-pull inflation, because the price level rises as higher spending from wealthier households raises aggregate demand.
Score your own answer. This is a self-check, not a grade. Tick each point your answer makes.
Part 6 Check yourself Read a shock from the data
Read the table first, then answer both questions from it.
Ostrava, a fictional economy, was in long-run equilibrium in Year 1. Nothing about government policy changed in Year 2. Its statistics agency reported:
| Measure | Year 1 | Year 2 |
|---|---|---|
| Real GDP (billions of base-year dollars) | 500 | 485 |
| Unemployment rate | 4.5% | 6.0% |
| Price level (Year 1 = 100) | 100 | 106 |
Case question 1 · Multiple choice
Which single short-run change best explains Ostrava's Year 2 data?
Case question 2 · Fill the statement
Tap a blank, then tap a phrase.
Read from the table, the inflation in Ostrava's Year 2 is inflation, and a likely cause is a rise in .
The rest stand on their own and do not use the case.
Check yourself · Select all
An economy is in long-run equilibrium when a recession abroad sharply cuts foreign purchases of its exports. Which two of these happen in the short run? Select two.
Select 2 answers, then check.
Check yourself · Put it in order
Tap the steps in the order they happen after nominal wages rise across the economy.
Part 7 Keep it Keep it
Bring it back · Fill the statement
Tap a blank, then tap a phrase.
Short-run equilibrium is where the AD curve crosses the curve. Full-employment output is shown by the curve, and short-run output greater than that is a output gap.
Bring it back · Multiple choice
Which of these shifts the short-run aggregate supply curve to the left?
In three lines
- AD shocks move real output, employment and the price level together.
- SRAS shocks move output and employment one way and the price level the other.
- Spending pulls prices up (demand-pull); costs push them up (cost-push).
Exam strategy for this topic
- Section I, Multiple Choice: 60 questions in 70 minutes.
- Section II, Free Response: 3 questions in 60 minutes.
- This lesson's Explain it is shaped like free-response question 2, Short.
- A four-function calculator is allowed on both sections of the exam.
Name the curve that moves and say why, then mark the new equilibrium where it crosses the curve that stayed put, with PL2 and Y2 on the axes. State the direction of output, employment and the price level in words, each with its reason.
Questions students ask
How can prices rise while people lose their jobs?
That is a negative supply shock. Higher costs, such as oil doubling, shift SRAS left, and the new crossing with AD has a higher price level and less output, so firms need fewer workers.
If oil prices jump, does AD move too?
Not in the short-run story. Nothing about the oil price changes how much buyers want to spend at a given price level, so only SRAS moves.
What happens if AD and SRAS shift at the same time?
Work out each shift on its own. Where they agree you know the direction, and where they disagree you cannot say without sizes. Rising consumer confidence with rising shipping costs raises the price level for sure, while output could go either way.
Does LRAS move after a demand or cost shock?
No. These shocks change spending or production costs, not what the economy can produce at full employment, so LRAS stays put and the new equilibrium can land off it.
How do I tell demand-pull from cost-push in a table of data?
Look at real output. If the price level rose and output rose, it is demand-pull. If the price level rose while output fell and unemployment climbed, it is cost-push.
Course alignment, for teachers
AP Macroeconomics topic 3.6, Unit 3: National Income and Price Determination.
- Skill 4.C: Demonstrate the effect of a change in an economic situation on an accurately labeled graph or visual.
This lesson maps all 3 essential knowledge statements of the topic to the part that teaches each one: 3 are checked by a scored question. The map is in the lesson file.