Unit 3 · Topic 3.5 · about 30 minutes · 7 parts · 10 scored checks, 2 of them multiple choice, plus 2 from earlier lessons
AP Macroeconomics 3.5: Equilibrium in the Aggregate Demand–Aggregate Supply (AD–AS) Model
Unit 3: 17 to 27% of the multiple-choice section
What you'll be able to do
- Explain where the short-run and long-run equilibrium price level and output level sit, using a graph where it helps.
Key vocabulary
| Term | What it means | The exam trap |
|---|---|---|
| Short-run equilibrium | The price level and real output at which the aggregate quantity of output demanded equals the aggregate quantity of output supplied, where AD crosses SRAS. | LRAS plays no part in setting it: the economy sits where AD crosses SRAS even when that point is off LRAS. |
| Long-run equilibrium | A short-run equilibrium that sits on LRAS, so AD and SRAS cross at the full-employment level of real output. | All three curves must meet at one point, so AD crossing LRAS is not enough if SRAS crosses LRAS at a different price level. |
| Full-employment level of real output | The real output an economy produces when unemployment equals the natural rate, shown by the vertical LRAS curve and labeled YF. | Unemployment at the natural rate, not zero unemployment, is what YF stands for, so an economy with 4.4 percent unemployment and a 4.4 percent natural rate is at full employment. |
| Positive (inflationary) output gap | The amount by which short-run equilibrium output is above the full-employment level of real output. | Low unemployment points to this gap: unemployment below the natural rate means output is above YF, so LRAS goes to the left of Y1. |
| Negative (recessionary) output gap | The amount by which short-run equilibrium output is below the full-employment level of real output. | Real GDP growing since last year does not rule this gap out, because the gap compares output with YF, not with last year's output. |
 Tap to open the picture full size
Part 1 Think first Calm prices, long lines at the job center
Guess before you learn. A wrong guess still makes the answer stick.
Predict first
In Doravia, stores sell everything they stock and no more: no unsold goods pile up and nothing runs short, so prices hold steady. But 8% of workers are unemployed, and economists put the natural rate there at 5%. Is Doravia's economy in equilibrium?
In short. In the AD-AS model the economy's short-run equilibrium is where aggregate demand crosses short-run aggregate supply, and it is in long-run equilibrium only when that crossing sits on long-run aggregate supply.
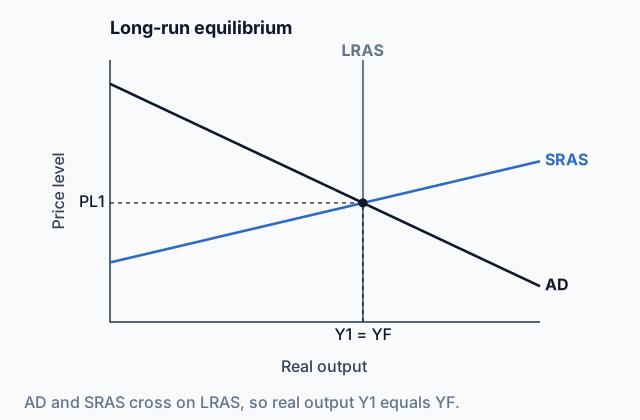
- Short-run equilibrium is where AD crosses SRAS, with the price level marked PL1 and real output Y1.
- Long-run equilibrium is where AD and SRAS cross on LRAS, at the full-employment level of real output, YF.
- The output gap is real output minus full-employment output: a positive gap is called inflationary and a negative gap recessionary.
Part 2 Learn it Where the curves meet, one idea at a time
2a. Short-run equilibrium: where AD meets SRAS
Put aggregate demand and short-run aggregate supply on one graph, with Price level up the side and Real output along the bottom. AD shows how much real output households, firms, government and foreign buyers want to buy at each price level. SRAS shows how much firms want to produce at each price level.
Short-run equilibrium is the price level where those two amounts are equal: the aggregate quantity of output demanded equals the aggregate quantity of output supplied. On the graph it is where AD crosses SRAS. Mark that price level PL1 on the vertical axis and that real output Y1 on the horizontal axis.
Why does the economy settle there? Suppose the price level were higher. Firms would want to produce more than buyers want to buy, unsold goods would pile up, and firms would cut prices. At a lower price level buyers want more than firms are producing, shelves empty, and prices climb. Only at the crossing is there no push either way.
Quick check · Decide and justify
In Ellora, an invented economy, AD and SRAS cross at a price level of 110. Suppose the price level were 125 instead, with neither curve moving. At a price level of 125, is the aggregate quantity of output supplied greater or less than the aggregate quantity of output demanded?
Which reason supports your choice?
2b. Long-run equilibrium: the crossing sits on LRAS
Now add the third curve. Long-run aggregate supply (LRAS) is a vertical line at the economy's full-employment level of real output, labeled YF. That is the output produced when unemployment equals the natural rate. The line is vertical because, once wages and prices have fully adjusted, the price level does not change what the economy can produce with its workers and equipment fully employed.
The economy is in long-run equilibrium when AD and SRAS cross on LRAS. All three curves then meet at one point, Y1 equals YF, unemployment equals the natural rate, and the price level is the one where AD meets LRAS.
YF is not the most an economy can ever make. People can work overtime and factories can run extra shifts, so for a while short-run output can sit to the right of LRAS. YF is the output the economy can keep up, which is why the vertical line is the long-run curve.
Quick check · Select all
Which two statements are true of any economy in long-run equilibrium? Select two.
Select 2 answers, then check.
2c. Output gaps, and which way they point
Short-run equilibrium can land at full-employment output, to its right or to its left. The output gap measures the difference, always in this order: real output minus full-employment output.
- Y1 greater than YF: a positive (inflationary) output gap. Producing more than the level the economy can keep up takes extra workers, so unemployment is below the natural rate.
- Y1 less than YF: a negative (recessionary) output gap. Firms need fewer workers, so unemployment is above the natural rate and cyclical unemployment is above zero.
- Y1 equal to YF: no gap, and unemployment equals the natural rate.
Real figures, from FRED (read October 14, 2026), in billions of chained 2017 dollars, with the Congressional Budget Office's estimate of potential output. In the second quarter of 2009, real GDP was $16,269.1 billion against $17,122.7 billion, a gap of about minus $854 billion, and June unemployment was 9.5% against CBO's natural-rate estimate of 5.0%. In the second quarter of 2026, real GDP was $24,408.0 billion against $24,070.9 billion, plus $337.1 billion, with June unemployment of 4.2% just under CBO's 4.4%.
Quick check · Multiple choice
Lusora's output gap, measured as real output minus full-employment output, is minus $30 billion. Which best describes Lusora's economy?
2d. Putting LRAS on the right side
A question can state the gap in four ways, and each one tells you where LRAS goes. Draw AD and SRAS first and mark PL1 and Y1 at their crossing. Then read the statement.
- Dollar amounts. Real GDP is $2,060 billion and full-employment real GDP is $2,000 billion. Y1 is above YF, so LRAS goes left of Y1.
- Unemployment against the natural rate. Unemployment is 7% and the natural rate is 5%. Output is below full employment, so LRAS goes right of Y1.
- Cyclical unemployment. Any cyclical unemployment above zero means a negative gap: LRAS goes right of Y1. Zero means LRAS goes at Y1.
- Words. A recession or a recessionary gap: right of Y1. An inflationary gap: left. Long-run equilibrium or full employment: at Y1.
Draw LRAS as a vertical line and label it YF where it meets the horizontal axis. It passes through the crossing of AD and SRAS only when the economy is at full employment.
Quick check · Sort it
Each card describes a different economy. Its AD and SRAS cross at real output Y1. Tap a card, then tap where that economy's LRAS belongs.
LRAS left of Y1
LRAS at Y1
LRAS right of Y1
Part 3 Watch it done Tarnby is running hot
Watch each step, then do the last one yourself.
Tarnby's real GDP is $2,380 billion. Economists estimate its full-employment real GDP at $2,300 billion and its natural rate of unemployment at 5%. Draw Tarnby's AD-AS graph, including LRAS, and say how its unemployment rate compares with 5%.
Step 1 · Draw the short-run equilibrium
Label the axes Price level and Real output. Draw a downward-sloping AD and an upward-sloping SRAS. Tarnby produces where they cross, so mark PL1 on the vertical axis and Y1 = $2,380 billion on the horizontal axis.
Step 2 · Find the gap
Real output minus full-employment output: $2,380 billion minus $2,300 billion = plus $80 billion. Tarnby is producing more than its full-employment level, a positive (inflationary) output gap.
Why this step?
Why must Tarnby's unemployment rate be below 5%?
Producing $80 billion more than at full employment takes more workers than full employment does, so fewer people are out of work than at the natural rate.
Your step · Decide and justify
Finish the graph. Where does Tarnby's LRAS, labeled YF, go?
Which reason supports your choice?
Tarnby's graph
AD and SRAS cross at Y1 = $2,380 billion and PL1 = 120. LRAS stands at full-employment output, $2,300 billion, to the left of Y1. Real output in billions of dollars.
Part 4 Try it Move LRAS yourself
Try it · Spot the error
Cendra's unemployment rate is 3.6% and its natural rate of unemployment is 4.4%. A student described how they drew Cendra's AD-AS graph. Tap the first line that goes wrong.
Part 5 Explain it Write it the way the exam asks
Nothing you type leaves this page.
Free response is 33.35% of the exam score. This one is shaped like Question 3, Short.
Free-response practice · Question 3 style
Selvane's real GDP is $3,395 billion. Economists estimate that Selvane's full-employment real GDP is $3,500 billion and its natural rate of unemployment is 4.5%. (a) Calculate Selvane's output gap, measured as real GDP minus full-employment real GDP. Show your work. (b) Draw a correctly labeled graph of aggregate demand and aggregate supply showing each of the following: (i) the current equilibrium price level, labeled PL1, and real output, labeled Y1; (ii) the long-run aggregate supply curve, with full-employment output labeled YF. (c) Is Selvane's unemployment rate greater than, less than, or equal to 4.5%? Explain.
Model answer
(a) $3,395 billion minus $3,500 billion = minus $105 billion, a negative (recessionary) gap. (b) Price level on the vertical axis and real output on the horizontal. AD slopes down and SRAS slopes up; they cross at PL1 and Y1, marked on both axes with dashed lines. LRAS is a vertical line to the right of Y1, labeled YF on the horizontal axis. (c) Greater than 4.5%. Real output is below the full-employment level, so firms need fewer workers than they would at full employment, and unemployment is above the natural rate.
Score your own answer. This is a self-check, not a grade. Tick each point your answer makes.
Part 6 Check yourself Read the gap from a graph
Read the graph first, then answer both questions from it.
Merovia is a fictional economy. The graph shows its aggregate demand, short-run aggregate supply and long-run aggregate supply curves this year, with real output in billions of dollars. The table lists where each pair of curves crosses.
Merovia's economy this year
Real output in billions of dollars. LRAS stands at Merovia's full-employment output.
| Curves | Real output ($ billions) | Price level |
|---|---|---|
| AD and SRAS | 840 | 94 |
| AD and LRAS | 900 | 85 |
| SRAS and LRAS | 900 | 97 |
Case question 1 · Calculate
Using the graph and table of Merovia's economy, what is Merovia's output gap, measured as real output minus full-employment output, in billions of dollars? Give a negative number for output below full employment.
Case question 2 · Multiple choice
Using the graph and table of Merovia's economy, at what real output is Merovia's short-run equilibrium, and why?
The rest stand on their own and do not use the case.
Check yourself · Decide and justify
Pravia's cyclical unemployment rate is 3%. On Pravia's AD-AS graph, where should LRAS be drawn compared with Y1, Pravia's current real output?
Which reason supports your choice?
Check yourself · Fill the statement
Tap a blank, then tap a word.
On an AD-AS graph the vertical axis is labeled and the horizontal axis is labeled . Where AD crosses SRAS, the equilibrium values are marked and Y1 on the axes.
Part 7 Keep it Keep it
From 3.4 Long-Run Aggregate Supply (LRAS) · Fill the statement
Tap a blank, then tap a word or phrase.
The long-run aggregate supply curve is at the full-employment level of output, labeled on the horizontal axis, because in the long run wages and prices .
From 2.7 Business Cycles · Calculate
Eskdale's real GDP this year is $2,460 billion, and its output gap, measured as actual output minus potential output, is plus $60 billion. What is Eskdale's potential output, in billions of dollars?
In three lines
- Short-run equilibrium is where AD crosses SRAS, marked PL1 and Y1.
- Long-run equilibrium is that crossing sitting on LRAS, at full-employment output YF.
- Output above YF is a positive (inflationary) gap; output below it is a negative (recessionary) gap.
Exam strategy for this topic
- Section I, Multiple Choice: 60 questions in 70 minutes.
- Section II, Free Response: 3 questions in 60 minutes.
- This lesson's Explain it is shaped like free-response question 3, Short.
- A four-function calculator is allowed on both sections of the exam.
Draw AD and SRAS first, mark PL1 and Y1 at their crossing with dashed lines to both axes, and only then place LRAS on the side the question's numbers put it. Label the vertical line LRAS and mark YF where it meets the horizontal axis.
Questions students ask
Can an economy be in equilibrium while lots of people are out of work?
Yes, in short-run equilibrium. Prices can hold steady with AD and SRAS crossing below full-employment output. It is not long-run equilibrium, because that crossing is off LRAS.
Which way do I subtract to get the output gap?
Real output minus full-employment output. If real GDP is $3,395 billion and full-employment real GDP is $3,500 billion, the gap is minus $105 billion, a negative (recessionary) gap.
Unemployment is 7 percent and the natural rate is 5 percent. Where does LRAS go?
To the right of Y1. Unemployment above the natural rate means output is below full employment, so YF is the bigger number.
What does cyclical unemployment tell me about the gap?
Any cyclical unemployment above zero means output is short of YF, a negative gap. Zero cyclical unemployment means the economy is at full employment.
Why does the economy settle where AD crosses SRAS?
At a higher price level firms offer more than buyers take, unsold goods pile up, and prices fall. At a lower one shelves empty and prices climb. Only at the crossing is there no push either way.
Course alignment, for teachers
AP Macroeconomics topic 3.5, Unit 3: National Income and Price Determination.
- Skill 4.B: Demonstrate your understanding of a specific economic situation on an accurately labeled graph or visual.
This lesson maps all 3 essential knowledge statements of the topic to the part that teaches each one: 3 are checked by a scored question. The map is in the lesson file.