Unit 7 · Topic 7.5 · about 30 minutes · 7 parts · 11 scored checks, 2 of them multiple choice, plus 2 from earlier lessons
AP Biology 7.5: Hardy–Weinberg Equilibrium
Unit 7: 13 to 20% of the multiple-choice section
What you'll be able to do
- Describe the conditions under which allele and genotype frequencies will change in a population.
Key vocabulary
| Term | What it means | The exam trap |
|---|---|---|
| Genotype frequency | The share of individuals in a population that have a given genotype, written as a decimal or a percentage. | Say whether a number describes individuals or gene copies before using it. |
| Allele frequency | How common one allele is among all the copies of a gene in a population. | Say which allele a frequency is for before squaring or doubling anything. |
| Null hypothesis | A statement that a factor has no effect, which an experiment or a set of data then tests. | Write the null hypothesis before looking at the results. |
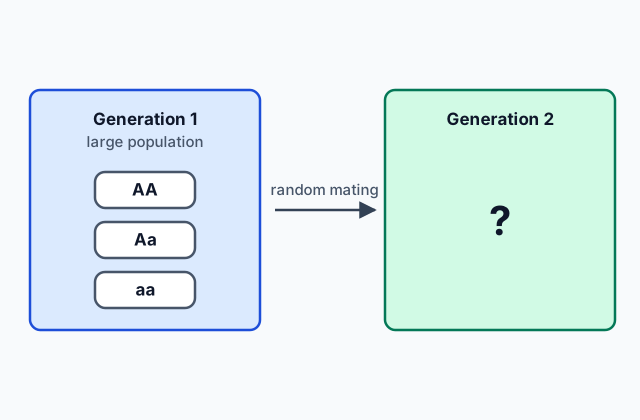 Tap to open the picture full size
Part 1 Think first Does dominant mean common?
Commit to a guess first. Being wrong now makes the right idea stick better.
Predict first
In a large population of wildflowers, the allele for purple flowers is dominant to the allele for white. The plants mate at random, no plants move in or out, no new mutations arise and flower color does not affect survival or reproduction. What will most likely happen to the share of each allele over many generations?
In short. Hardy-Weinberg equilibrium is a model for describing and predicting allele frequencies in a population that is not evolving; its conditions are never met, but it provides a valuable null hypothesis.
- The conditions are a large population size, no migration, no new mutations, random mating and no natural selection.
- p + q = 1, where p and q are the frequencies of the two alleles, and p² + 2pq + q² = 1 gives the three genotype frequencies.
- Allele frequencies in a nonevolving population can be calculated from genotype frequencies; a departure from the prediction means at least one condition is not being met.
Part 2 Learn it A population that is not evolving
2a. The five conditions
Hardy-Weinberg equilibrium is a model for describing and predicting allele frequencies in a non-evolving population. For a population, or an allele, to be in Hardy-Weinberg equilibrium, five conditions must hold:
- A large population size
- No migration
- No new mutations
- Random mating
- No natural selection
Each condition rules out one way allele frequencies change. A small population is open to genetic drift; migration brings gene flow; mutation adds new alleles; choosing mates by a trait changes which genotypes form; and selection favors some alleles over others.
Quick check · Sort it
Each card describes a population of frogs. Tap a card, then whether it meets the conditions of Hardy-Weinberg equilibrium or breaks one of them.
Meets the conditions
Breaks a condition
2b. A null hypothesis
These conditions are never met, but they provide a valuable null hypothesis. No real population meets all five at once.
The model's value is as a baseline. It predicts what a population's allele and genotype frequencies would be if nothing were changing them. When measured frequencies differ from that prediction, at least one condition is not being met. When allele frequencies change from one generation to the next, the population is evolving. Researchers then look for which condition is broken.
Quick check · Multiple choice
A researcher finds that the genotype frequencies in a population of beetles differ greatly from those the Hardy-Weinberg equations predict from its allele frequencies. What does this most directly suggest?
2c. The two equations
For a gene with two alleles, let p be the frequency of one allele and q the frequency of the other. Every copy of the gene is one or the other, so
p + q = 1
In a population in equilibrium, the genotype frequencies follow from the allele frequencies:
p² + 2pq + q² = 1
Here p² is the frequency of individuals homozygous for the first allele, 2pq the frequency of heterozygotes and q² the frequency of individuals homozygous for the second allele.
Allele frequencies in a nonevolving population can be calculated from genotype frequencies. If 25% of a population shows a recessive phenotype, then q² = 0.25, so q = 0.5 and p = 1 − 0.5 = 0.5.
Quick check · Fill the statement
A gene has two alleles, with frequencies p and q. Complete the statements about a population in Hardy-Weinberg equilibrium.
The two allele frequencies add up to . Individuals with two copies of the allele with frequency p make up of the population, individuals with one copy of each allele make up , and individuals with two copies of the allele with frequency q make up .
Part 3 Watch it done From white flowers to heterozygotes
Predict first, then watch each step, then finish the reasoning yourself.
In a large population of wildflowers in Hardy-Weinberg equilibrium, purple (A) is dominant to white (a). 16% of the plants have white flowers. What share of the plants are heterozygous, Aa? This population is a teaching example.
Predict first
Before you open the first step, predict: what share of the plants are heterozygous?
Step 1 · Start from the recessive phenotype
Only aa plants have white flowers, so q² = 0.16.
Step 2 · Find q
Take the square root: q = 0.4.
Why this step?
Why start from the white plants and not the purple ones?
Every white plant is aa, so their share is exactly q². Purple plants are a mix of AA and Aa, so their share alone does not give either genotype.
Step 3 · Find p
p + q = 1, so p = 1 − 0.4 = 0.6.
Step 4 · Find the heterozygotes
Heterozygotes are 2pq. Multiply it out.
Your step · Calculate
In a large population of wildflowers in Hardy-Weinberg equilibrium, purple (A) is dominant to white (a), and 16% of the plants have white flowers. What share of the plants are heterozygous, Aa? Give a decimal.
48% of the plants are heterozygous: 3 times as many as show the white phenotype. In equilibrium the white allele keeps its frequency of 0.4, much of it carried unseen in purple plants.
Part 4 Try it Counting snails
Two snail populations, both teaching examples. For the first, you are given the count of each genotype and find an allele frequency from them. For the second, you are given an allele frequency and use the equations to predict how many snails of one genotype to expect.
Try it · Calculate
A population of 500 snails has 320 with genotype BB, 160 with Bb and 20 with bb. What is the frequency of allele b? Give a decimal.
Try it · Calculate
A second population of 1,000 snails is in Hardy-Weinberg equilibrium, and allele b has a frequency of 0.3. How many snails would you expect to be heterozygous, Bb?
Part 5 Explain it White flowers become more common
On the exam this is handwritten, so answer on paper first. Nothing you type here leaves this page. Then check your answer against the model and each scoring point.
Free response is 50% of the exam score. This one is shaped like Question 6, Analyze Data.
Free-response practice · Question 6 style
In a large population of a wildflower, purple (A) is dominant to white (a). In the first year of a study, 36% of the plants have white flowers. Ten years later, 49% have white flowers. These numbers are a teaching example.
(a) Describe two of the conditions a population must meet to be in Hardy-Weinberg equilibrium.
(b) Assuming the population is in equilibrium in the first year, calculate the frequency of allele a that year.
(c) Ten years later, the frequency of a, worked out the same way, is 0.7. Explain what the change from your answer in (b) indicates about the population.
(d) Identify one condition that could have been broken to cause this change, and describe how it could change the frequency of a.
Model answer
(a) Any two of: a large population size; no migration; no new mutations; random mating; no natural selection.
(b) White plants are aa, so q² = 0.36 and q = 0.6.
(c) The frequency of a rose from 0.6 to 0.7. A change in allele frequency means the population is evolving: at least one of the conditions is not being met. The model works as a null hypothesis, and these data depart from it.
(d) Natural selection: if white plants survive or reproduce better, for example because a herbivore prefers purple flowers, a is passed on more often. (Migration of white-flowered plants into the population, or mate choice that favors white-flowered plants, sexual selection, also earns the point.)
Score your own answer. This is a self-check, not a grade. Tick each point your answer makes.
Part 6 Check yourself Mice over ten generations
All three case questions use the table.
Researchers count the genotypes for one gene, with alleles A and a, in a population of 200 mice in generation 1 and again in generation 10. These numbers are a teaching example.
| Generation | AA | Aa | aa | Total |
|---|---|---|---|---|
| 1 | 72 | 96 | 32 | 200 |
| 10 | 98 | 84 | 18 | 200 |
Case question 1 · Calculate
Using the table: what is the frequency of allele A in generation 10? Give a decimal.
Case question 2 · Multiple choice
Using the table: the frequency of allele A is different in generation 10 from generation 1. What does this change show?
Case question 3 · Decide and justify
Using the table: in generation 1 the frequency of A is 0.6. Are the generation 1 genotype counts consistent with Hardy-Weinberg equilibrium?
Which statement supports your decision?
The rest stand on their own and do not use the case.
Check yourself · Spot the error
A student works out allele frequencies for a large plant population in Hardy-Weinberg equilibrium, where 9% of the plants show the recessive phenotype. Tap the line with the mistake.
Check yourself · Rank it
In a large population in Hardy-Weinberg equilibrium, the recessive allele has a frequency of 0.6. Rank the three genotypes from most common to least common.
Most common first
Give each one a place, 1 for first. Give two the same place if they are equal.
Your ranking: none yet
Part 7 Keep it Bring back earlier ideas
The model asks what happens when none of the last topic's random processes act, and its genotype terms build on the probabilities of a single cross. Pulling back drift, and a Punnett square, sets the population view beside the family view.
From 7.4 Population Genetics · Multiple choice
A meadow holds 30 wildflowers, some red and some white. One spring, a deer happens to trample and kill 12 of them, without regard to flower color. No plants, seeds or pollen arrive from other meadows. In the next generation, the share of the white allele has changed. Which process best accounts for the change?
From 5.3 Mendelian Genetics · Fill the statement
Two plants with genotype Aa are crossed, and A is dominant to a. Complete the probabilities for one offspring.
The probability that the offspring is aa is . The probability that it is Aa is . The probability that it shows the dominant phenotype is .
In three lines
- Hardy-Weinberg equilibrium models a population that is not evolving: large, no migration, no new mutations, random mating, no selection.
- The conditions are never met, but they provide a valuable null hypothesis; changing allele frequencies show a population is evolving.
- p + q = 1 and p² + 2pq + q² = 1; allele frequencies can be calculated from genotype frequencies.
Exam strategy for this topic
- Section I, Multiple Choice: 60 questions in 90 minutes.
- Section II, Free Response: 6 questions in 90 minutes.
- This lesson's Explain it is shaped like free-response question 6, Analyze Data.
- A four-function, scientific, or graphing calculator is allowed on both sections of the exam.
Start from the homozygous recessive share: it is q². Take the square root for q, use p = 1 − q, then build any genotype from p², 2pq and q². To judge whether a population is evolving, compare frequencies across generations or with the model's prediction.
Questions students ask
What are the conditions for Hardy-Weinberg equilibrium?
A large population size, no migration, no new mutations, random mating and no natural selection. These conditions are never met, but they provide a valuable null hypothesis.
What do p and q stand for?
p is the frequency of one allele in the population and q the frequency of the other. Together, p + q = 1.
What does each term of p² + 2pq + q² = 1 mean?
p² is the frequency of individuals homozygous for the first allele, 2pq the frequency of heterozygotes and q² the frequency of individuals homozygous for the second allele.
How do you find an allele frequency from the recessive phenotype?
In a population in equilibrium, individuals with the recessive phenotype are homozygous recessive, so their share is q². Take its square root to get q, and p = 1 − q.
Why use a model whose conditions are never met?
It predicts what allele and genotype frequencies would be with no evolution. Comparing real data with that null hypothesis shows whether a population is evolving.
Course alignment, for teachers
AP Biology topic 7.5, Unit 7: Natural Selection.
- Skill 1.C: Explain biological concepts and processes in applied contexts.
- Skill 5.A: Perform mathematical calculations, including:
This lesson maps all 2 essential knowledge statements of the topic to the part that teaches each one: 2 are checked by a scored question. The map is in the lesson file.