Unit 7 · Topic 7.9 · about 30 minutes · 7 parts · 12 scored checks, 3 of them multiple choice, plus 2 from earlier lessons
AP Biology 7.9: Phylogeny
Unit 7: 13 to 20% of the multiple-choice section
What you'll be able to do
- Describe the kinds of evidence that can be used to infer an evolutionary relationship.
- Explain how phylogenetic trees and cladograms can be used to infer how closely lineages are related.
Key vocabulary
| Term | What it means | The exam trap |
|---|---|---|
| Phylogenetic tree | A branching diagram of evolutionary relationships among lineages. | Trace each branch back from its tip before comparing two lineages. |
| Cladogram | A branching diagram of hypothesized relationships, read by the order in which lineages branch. | Say which traits each branch point is based on. |
| Lineage | A line of descent from an ancestor to its descendants. | Name the lineages being compared before reading a diagram. |
| Molecular clock | An estimate of how long ago two lineages split, made from the number of differences in their DNA or protein sequences. | Say what the clock is set against before reading a date from it. |
| Morphological trait | A feature of an organism's form or structure, such as the shape of a bone. | Describe a trait the same way for every lineage you compare. |
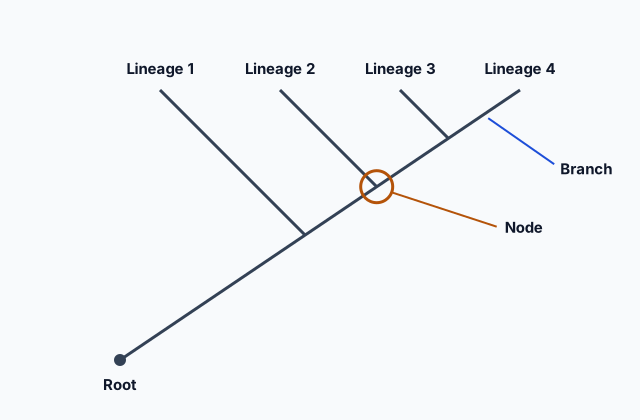 Tap to open the picture full size
Part 1 Think first A shark, a dolphin and a mouse
Commit to a guess first. Being wrong now makes the right idea stick better.
Predict first
A shark and a dolphin both have streamlined bodies and fins, and both swim in the ocean. A dolphin and a mouse both have hair at some stage of life and feed their young on milk. Which two are more closely related?
In short. Phylogenetic trees and cladograms show hypothetical evolutionary relationships among lineages, built from morphological similarities and from DNA and protein sequence similarities, and revised as new evidence comes in.
- Each node represents the most recent common ancestor of the groups that branch from it.
- Shared derived characters indicate common ancestry; the out-group is the lineage least closely related to the rest.
- Phylogenetic trees can show the amount of change over time; cladograms do not, and molecular data are typically more reliable than morphological traits.
Part 2 Learn it Drawing evolutionary relationships
2a. Reading a tree
Phylogenetic trees and cladograms show hypothetical evolutionary relationships among lineages, relationships that can be tested.
- Each tip is a lineage, living or known from fossils.
- Each branch point, a node, represents the most recent common ancestor of any two groups or lineages that branch from it.
- A split at a node can illustrate speciation that has occurred: one ancestral lineage became two.
To judge how closely two lineages are related, trace them back to the node where they meet. Two lineages that meet at a more recent node are more closely related than either is to a lineage that joins them only at an older node.
Quick check · Multiple choice
On a cladogram, lineages K and L branch apart at the same node. What does that node represent?
2b. Building one from shared derived characters
Trees and cladograms can be constructed from morphological similarities of living or fossil species, and from DNA and protein sequence similarities.
Traits that are gained or lost during evolution can be used to build them. A trait gained in an ancestor and passed to its descendants is a shared derived character: it can be present in more than one lineage, and it indicates common ancestry. These characters are informative for building trees and cladograms.
The out-group represents the lineage least closely related to the rest of the organisms in the tree. A trait that the out-group and every other lineage share was present before they split, so it cannot sort them into groups. Losing a trait can be a derived change too, but lacking a trait the out-group also lacks does not group lineages.
Quick check · Decide and justify
A biologist builds a cladogram of four lineages of plants, with a fifth lineage as the out-group. One trait is present in the out-group and in all four lineages. Is that trait useful for working out which of the four lineages are most closely related to one another?
Which statement supports your decision?
2c. Time on the diagram
The two kinds of diagram differ in what their branches mean.
- Phylogenetic trees show the amount of change over time, calibrated by fossils or a molecular clock. Branch lengths carry information.
- Cladograms do not show time scale or the evolutionary difference between groups. Only the branching order carries information.
Both show which lineages share more recent common ancestors, and both can be built from morphological or molecular data.
Quick check · Sort it
Each card describes something a branching diagram of evolutionary relationships can show. Tap a card, then the diagrams it is true of.
Phylogenetic trees only
Both trees and cladograms
2d. Hypotheses that change
Phylogenetic trees and cladograms represent hypotheses that are constantly being revised based on evidence. A tree built from bone shapes can be redrawn when DNA from the same lineages is compared.
When the two kinds of evidence disagree, molecular data typically provide more accurate and reliable evidence than morphological traits. Similar shapes can arise in lineages that are not closely related, while a comparison of many DNA or protein sequences draws on far more characters.
Quick check · Multiple choice
A cladogram built from the shapes of bones places lineage R closest to lineage S. A later study comparing many DNA sequences from the same lineages places R closest to lineage T. What should biologists most likely conclude?
Part 3 Watch it done Counting differences in DNA
Predict first, then watch each step, then finish the reasoning yourself.
The same 12-base stretch of one gene is read from four species, a teaching example. P: ATG GCA TTC GAA. Q: ATG GCG TTC GAT. R: ATG GCG TTA GAT. S: TTG ACG TAC GAA. At how many sites do P and S differ?
Predict first
Before you open the first step, predict: which species will turn out to be the most closely related to P?
Step 1 · Line up the sequences
Write the four stretches one above the other, so site 1 of each is in the same column, and compare one column at a time.
Step 2 · Compare P with Q, then with R
P and Q differ at sites 6 and 12: 2 differences. P and R differ at sites 6, 9 and 12: 3 differences.
Why this step?
Why does a smaller number of differences suggest a closer relationship?
DNA sequences change over time. Two lineages that split from a common ancestor more recently have had less time to build up differences, so their sequences are more similar.
Step 3 · Compare P with S
Go through the 12 sites of P and S, and count the columns where the bases are not the same.
Your step · Calculate
The same 12-base stretch of one gene is read from two species. Species P: ATG GCA TTC GAA. Species S: TTG ACG TAC GAA. At how many sites do P and S differ?
sites
P differs from Q at 2 sites, from R at 3 and from S at 4. By this stretch of DNA, Q is the most closely related to P and S the least. A real study compares far longer sequences, and the tree it gives is a hypothesis.
Part 4 Try it Two kinds of evidence
Two new comparisons, each a teaching example. In the first, a protein's amino acid sequence is compared between species; rank how closely they are related. In the second, a trait is found in some lineages and not others; decide what it shows.
Try it · Rank it
In a teaching example, one protein's amino acid sequence is compared between species J and three other species: L differs from J at 9 sites, M at 15 sites and K at 2 sites. Rank L, M and K from the most closely related to J to the least closely related.
Most closely related to J first
Give each one a place, 1 for first. Give two the same place if they are equal.
Your ranking: none yet
Try it · Decide and justify
In a teaching example, lineages E, F and G all have trait T, while lineage H and the out-group lack it, and no lineage has lost the trait. A student concludes that E, F and G share a more recent common ancestor with one another than any of them shares with H. Is the conclusion supported?
Which statement supports your decision?
Part 5 Explain it Revising a cladogram
On the exam this is handwritten, so answer on paper first. Nothing you type here leaves this page. Then check your answer against the model and each scoring point.
Free response is 50% of the exam score. This one is shaped like Question 5, Analyze Model or Visual Representation of a Biological Concept or Process.
Free-response practice · Question 5 style
A cladogram of five lineages, built from morphological traits, shows lineage V branching off first, then W, then X, with Y and Z branching apart at the most recent node.
(a) Identify the out-group.
(b) Describe what the node where Y and Z branch apart represents.
(c) Explain why this cladogram cannot be used to say how long ago Y and Z diverged.
(d) A new study of DNA sequences places X closer to Y than Y is to Z. Explain why biologists would revise the cladogram, and which kind of data they would typically rely on.
Model answer
(a) Lineage V, which branches off first and is least closely related to the rest.
(b) The most recent common ancestor of Y and Z; the split there illustrates speciation.
(c) Cladograms do not show time scale or the amount of evolutionary change. Only a phylogenetic tree calibrated by fossils or a molecular clock shows change over time.
(d) Cladograms are hypotheses that are constantly revised based on evidence. Molecular data typically provide more accurate and reliable evidence than morphological traits, so biologists would most likely redraw the cladogram with X and Y sharing the most recent node.
Score your own answer. This is a self-check, not a grade. Tick each point your answer makes.
Part 6 Check yourself Four lineages and an out-group
All three case questions use the table.
A biologist scores four lineages, A to D, and an out-group for four traits. A yes means the lineage has the trait. The data are a teaching example.
| Lineage | Trait 1 | Trait 2 | Trait 3 | Trait 4 |
|---|---|---|---|---|
| Out-group | No | No | No | No |
| A | Yes | No | No | No |
| B | Yes | Yes | No | No |
| C | Yes | Yes | Yes | No |
| D | Yes | Yes | Yes | Yes |
Case question 1 · Calculate
Using the table: how many derived characters do lineages C and D share?
Case question 2 · Multiple choice
Using the table: which branching order do the traits best support?
Case question 3 · Decide and justify
Using the table: a student says lineage A is more closely related to the out-group than to lineage B, because A and the out-group both lack traits 2, 3 and 4. Is the student right?
Which statement supports your decision?
The rest stand on their own and do not use the case.
Check yourself · Spot the error
A student describes a cladogram of five lineages. Tap the line with the mistake.
Check yourself · Fill the statement
Complete the description of the evidence used to build trees and cladograms.
Trees and cladograms can be built from similarities of living or fossil species and from DNA and sequence similarities. Molecular data provide more accurate and reliable evidence than similarities of structure.
Part 7 Keep it Bring back earlier ideas
Trees are drawn from the shared features and changing genomes of the last two topics. Pulling back how lineages keep evolving, and how shared body structures point to common ancestry, sets up reading a tree of their branches.
From 7.8 Continuing Evolution · Multiple choice
Fossils of a clam lineage show its shell shape changing step by step through rock layers spanning several million years, and DNA from one living population of the clams, sampled 30 years apart, differs in sequence. What do the two observations together best show?
From 7.6 Evidence of Evolution · Fill the statement
Complete the description of evidence from body structures.
The arm of a human and the wing of a bat are built from the same set of bones in the same arrangement, which makes them morphological . A small, reduced body part with little or no function that matches a working part in related species is called a structure. Both kinds of evidence point to common .
In three lines
- Trees and cladograms show hypothetical relationships; each node is the most recent common ancestor of its branches.
- Shared derived characters, measured against an out-group, and DNA and protein sequences are used to build them.
- Only phylogenetic trees show change over time; molecular data are typically more reliable, and trees are revised with evidence.
Exam strategy for this topic
- Section I, Multiple Choice: 60 questions in 90 minutes.
- Section II, Free Response: 6 questions in 90 minutes.
- This lesson's Explain it is shaped like free-response question 5, Analyze Model or Visual Representation of a Biological Concept or Process.
- A four-function, scientific, or graphing calculator is allowed on both sections of the exam.
To find the closest relatives on a tree, trace both lineages back to the node where they meet; the more recent the node, the closer the relationship. To build one, group lineages by shared derived characters, not by traits the out-group shares with every lineage or lacks along with them.
Questions students ask
What does a node on a phylogenetic tree represent?
The most recent common ancestor of the groups or lineages that branch from it. A split at a node can illustrate speciation.
What is the difference between a phylogenetic tree and a cladogram?
Phylogenetic trees show the amount of change over time, calibrated by fossils or a molecular clock. Cladograms do not show time scale or the evolutionary difference between groups.
What evidence is used to build them?
Morphological similarities of living or fossil species, and DNA and protein sequence similarities. Shared derived characters indicate common ancestry and are informative for building them.
What is an out-group?
The lineage least closely related to the rest of the organisms in the tree or cladogram.
Why do trees change?
They represent hypotheses that are constantly being revised based on evidence. Molecular data typically provide more accurate and reliable evidence than morphological traits.
Course alignment, for teachers
AP Biology topic 7.9, Unit 7: Natural Selection.
- Skill 2.D: Represent relationships within biological models, including mathematical models, diagrams, flowcharts, and systems.
This lesson maps all 6 essential knowledge statements of the topic to the part that teaches each one: 6 are checked by a scored question. The map is in the lesson file.