Unit 1 · Topic 1.2 · about 30 minutes · 7 parts · 12 scored checks, 3 of them multiple choice
AP Calculus AB 1.2: Defining Limits and Using Limit Notation
Unit 1: 10 to 15% of the multiple-choice section
What you'll be able to do
- Write a limit in correct notation, , from a graph, a table or a sentence.
- Interpret a limit written in notation: say what it tells you about the outputs near an input, and what it does not tell you.
Key vocabulary
| Term | What it means | The exam trap |
|---|---|---|
| Limit | The real number that can be made arbitrarily close to by taking sufficiently close to , but not equal to . | A limit at and the value of the function at answer two different questions; check which one you are asked. |
| Limit notation | , read "the limit of as approaches is ." | The two numbers play different roles, so say which is the input and which is the output before you write either one. |
| Approaches | " approaches " means takes values closer and closer to , on both sides, without equaling . | Approaching describes the inputs and the outputs separately; keep track of which one is approaching what. |
| Graphical, numerical and analytical | The three ways to express a limit: by a graph, by a table of values, or by a formula and limit notation. | Each form puts the input and the output in a different place, so find both before you read off a limit. |
 Tap to open the picture full size
Part 1 Think first What does the spreadsheet show near zero?
Guess before you learn. A wrong guess still makes the answer stick.
Predict first
Maya types the formula into a spreadsheet and fills a column with inputs. At the cell shows an error, because the formula would divide 0 by 0. What do the outputs do for inputs very close to 0, such as 0.01 and ?
In short. The limit says that the outputs can be made as close to the real number as you like by taking the inputs close enough to , with .
- The definition uses inputs close to but never itself, so the value , and whether it exists, plays no part.
- In the notation, the number beside the arrow is the input approached, and the number after the equals sign is the output approached.
- A limit can be shown graphically, numerically or analytically, and all three can describe the same limit.
Part 2 Learn it Three short ideas, each checked as you go
2a. What a limit describes
A limit answers one question: as the inputs get close to a number , do the outputs get close to one number?
Here is the definition. The limit of as approaches is the real number if can be made arbitrarily close to by taking sufficiently close to , but not equal to .
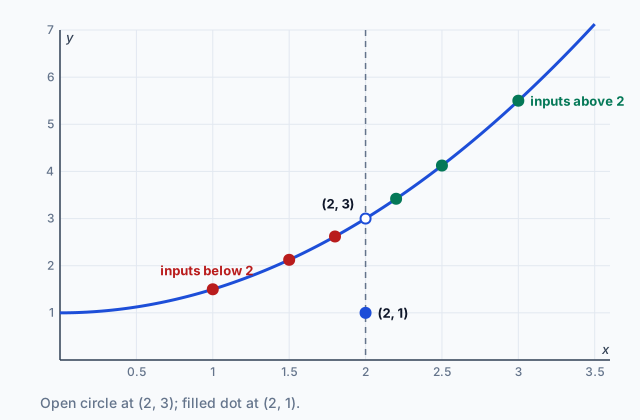
Read the graph at the top with that in mind. The inputs 1.8 and 2.2 give outputs 2.62 and 3.42, and inputs closer to 2 on either side give outputs closer to 3. Want every output within 0.01 of 3? Keep close enough to 2 and you get it. So the limit of as approaches 2 is 3.
The last words of the definition, but not equal to , do the most work. The limit never asks for the output at . On that graph , the filled dot, and the limit is still 3, the height of the open circle. A function can have a limit at when is some other number, and also when does not exist at all, as the spreadsheet table suggests for that formula at .
Quick check · Decide and justify
No calculator. Let , which has no value at . A classmate says cannot exist, because does not exist. Is the classmate right?
Which reason supports your answer?
2b. Writing a limit in notation
When the limit exists and is a real number , it is written
and read "the limit of as approaches is ." For the graph at the top, .
Each number has one job. The beside the arrow is the input that approaches. The after the equals sign is the output that approaches. Swap them and you have written a statement about different inputs.
Two statements look alike and say different things:
- is about the outputs at inputs near 2.
- is about the one output at the input 2.
Write the whole limit every time. A bare does not say which input is approached. Keep inside the limit, not : is the limit of one fixed number, 1, which is just 1.
If the outputs near do not close in on one real number, there is no to write, and we say the limit does not exist.
Quick check · Match
No calculator. Tap a statement in notation, then the sentence that says the same thing.
2c. One limit, three ways to show it
The same limit can be shown three ways, and you need to move between them.
- Graphically. Follow the graph toward from both sides and see what height the points approach. An open circle marks a height the graph approaches but does not take at .
- Numerically. A table of inputs closing in on from both sides, and the outputs they give.
- Analytically. A formula for the function, and the limit written in notation.
For the function at the top, all three agree. The graph's points crowd toward the open circle at . A table gives and . The formula for , with , says the same thing in symbols.
When you translate, keep the two numbers in their places. The input is a horizontal position on a graph and the left column of a table. The limit is a height on the graph and a number the right column closes in on. The point at itself, a filled dot or the table's row for , plays no part.
Quick check · Multiple choice
No calculator. Near , the graph of behaves as follows: as moves toward from either side, the points on the graph approach the height 3. There is an open circle at and a filled dot at . Which set of values suggests the same limit as , and gives the same value , as the graph?
Part 3 Watch it done Reading a limit from a table of values
Watch each step, then do the last one yourself.
The function is given by for with , and . Some of its values, rounded to five decimal places, are:
: 2.9, 2.99, 2.999, 3, 3.001, 3.01, 3.1
: 0.25158, 0.25016, 0.25002, 1, 0.24998, 0.24984, 0.24846
Write, in correct notation, the limit of as approaches 3 that these values suggest, and say what it means.
Step 1 · Name the input being approached
The inputs close in on 3 from below (2.9, 2.99, 2.999) and from above (3.1, 3.01, 3.001). So the limit to write is the one as .
Step 2 · Read the outputs on both sides
From below the outputs are 0.25158, 0.25016, 0.25002. From above they are 0.24846, 0.24984, 0.24998. Both lists close in on 0.25.
Why this step?
Why is the row for , where , left out of the decision?
The definition takes close to 3 but not equal to 3. is the one output at the input 3, so it could be any number, or missing, without changing what the outputs near 3 approach.
Step 3 · Write the limit
. A table suggests a limit rather than proving it; later in this unit you will confirm limits like this one with algebra.
Your step · Fill the statement
No calculator. Finish it. Tap a blank, then tap an answer.
The statement means that can be made as close as we like to by taking close enough to , but not equal to it.
Part 4 Try it A formula and a context
Try it · Calculate
No calculator. Let for every , and let . What is ?
Try it · Multiple choice
No calculator. is a runner's average speed, in meters per second, over the time interval between 2 seconds and seconds, so exists for every except . A coach writes . Which sentence interprets that statement?
Part 5 Explain it Write it the way the exam asks
Free response on the exam is written by hand, so do this on paper first. Nothing you type here leaves this page. Then open the model answer and score yourself on each point.
Free response is 50% of the exam score. This one is shaped like Question 4, from free-response Part B (calculator not permitted).
Free-response practice · Question 4 style
No calculator. A sensor records the concentration of a medicine in a patient's blood hours after a dose. Its reading, in milligrams per liter, is . At exactly the sensor glitched and recorded . The readings at times near 2 hours were:
(hours): 1.9, 1.99, 1.999, 2.001, 2.01, 2.1
(milligrams per liter): 8.243, 8.024, 8.002, 7.998, 7.976, 7.763
(a) Using correct limit notation, represent the value that the readings suggest approaches as approaches 2.
(b) Using correct units, interpret the statement from part (a) in the context of the problem.
(c) Explain why the recorded value does not change your answer to part (a).
Model answer
(a) . From below 2 the readings are 8.243, 8.024, 8.002, and from above they are 7.763, 7.976, 7.998, so both sides close in on 8.
(b) As the time after the dose gets close to 2 hours, the recorded concentration of the medicine gets close to 8 milligrams per liter.
(c) The limit as approaches 2 depends only on readings at times close to 2 but not equal to 2. is the reading at itself, so it plays no part, and the limit is 8 whatever the sensor recorded at that one instant.
Score your own answer. This is a self-check, not a grade. Tick each point your answer makes.
Part 6 Check yourself A table with one odd row
Both case questions are about this one table.
A function is defined for all real numbers. The table gives some of its values.
| 2.9 | 4.41 |
|---|---|
| 2.99 | 4.9401 |
| 2.999 | 4.994001 |
| 3 | |
| 3.001 | 5.006001 |
| 3.01 | 5.0601 |
| 3.1 | 5.61 |
Case question 1 · Calculate
No calculator. Based on the table, what does appear to be?
Case question 2 · Multiple choice
No calculator. Which statement is written in correct limit notation and agrees with the table?
The rest stand on their own and do not use the case.
Check yourself · Spot the error
No calculator. Let for every . A student is asked to write, in correct notation, the limit of as approaches 1. Tap the first line with a mistake.
Check yourself · Sort it
No calculator. All you know about a function is that . Tap a card, then tap whether it must be true or is not necessarily true.
Must be true
Not necessarily true
Part 7 Keep it Bring back earlier ideas
Limits were built to answer the question Topic 1.1 raised. Two questions from it, to keep it fresh.
Bring it back · Calculate
No calculator. An object moves along a line. Its average velocity, in meters per second, is 5.7 over the time interval , 5.97 over , 6.03 over and 6.3 over . What do these averages suggest is its velocity at the instant , in meters per second?
Bring it back · Decide and justify
No calculator. A student says the average rate of change of over the interval from to is 0, because . Is the student right?
Which reason supports your answer?
In three lines
- means can be made as close to as you like by taking close enough to , with .
- The value , and whether it exists, plays no part in the limit at .
- A graph, a table and a formula with notation can all show the same limit; read the input and the output in each.
Exam strategy for this topic
- Section I Part A, Multiple Choice (calculator not permitted): 29 questions in 62 minutes.
- Section I Part B, Multiple Choice (graphing calculator required): 13 questions in 38 minutes.
- Section II Part A, Free Response (graphing calculator required): 2 questions in 30 minutes.
- Section II Part B, Free Response (calculator not permitted): 4 questions in 60 minutes.
When a question gives a limit in notation, say it in words first: which input approaches, and which number the outputs approach. When you write a limit, write all of it, , with inside, not , and in a context give the units of both numbers.
Questions students ask
Can a limit equal the value of the function at that input?
Yes, and for many functions it does. For , and . The definition just does not require the two to agree, because it never uses .
Does a function need a value at to have a limit there?
No. The spreadsheet formula has no value at 0, yet it does have a limit there: its outputs near 0 close in on a number near 0.693, as the table suggests.
What does "arbitrarily close" mean?
As close as anyone asks. Name any distance, 0.1 or 0.000001, and there is a stretch of inputs around , other than , whose outputs are all within that distance of .
Is a table enough to find a limit?
A table suggests a limit; it does not prove one, because it shows only a few inputs. Later in this unit you will confirm limits with algebra and with theorems.
What does it mean when a limit does not exist?
It means the outputs near do not close in on one real number. Topic 1.3 shows the ways this can happen.
Beyond the AP Exam
College Board sets this limit on what the AP Exam asks about this topic. Anything past it is not on the exam.
The epsilon-delta definition of a limit is not assessed on the AP Calculus AB or BC Exam. However, teachers may include this topic in the course if time permits.
Course alignment, for teachers
AP Calculus AB topic 1.2, Unit 1: Limits and Continuity.
- Skill 2.B: Identify mathematical information from graphical, numerical, analytical, and/or verbal representations.
This lesson maps all 2 essential knowledge statements of the topic to the part that teaches each one: 2 are checked by a scored question. The map is in the lesson file.