Unit 1 · Topic 1.3 · about 30 minutes · 7 parts · 13 scored checks, 3 of them multiple choice
AP Calculus AB 1.3: Estimating Limit Values from Graphs
Unit 1: 10 to 15% of the multiple-choice section
What you'll be able to do
- Estimate a limit and each one-sided limit from the graph of a function, and say when and why the limit does not exist.
Key vocabulary
| Term | What it means | The exam trap |
|---|---|---|
| Limit | means can be made arbitrarily close to the real number by taking sufficiently close to , but not equal to . | Write the input the limit approaches, , under the limit sign every time; without it the statement is incomplete. |
| One-sided limit | A limit taken from one side only: uses inputs less than , and uses inputs greater than . | The minus and plus signs say which side of the input the values come from; they do not make the inputs or the limit negative or positive. |
| Unbounded | A function is unbounded near when its outputs grow past every bound, above or below, as gets close to . | A graph that is steep near a point but then levels off is bounded. Zoom in and check whether the outputs keep growing. |
| Oscillating | A function oscillates near when its outputs keep swinging between values as gets close to , without settling on one. | Wiggles whose size shrinks toward zero can still settle on one height, so judge by whether the swings die out. |
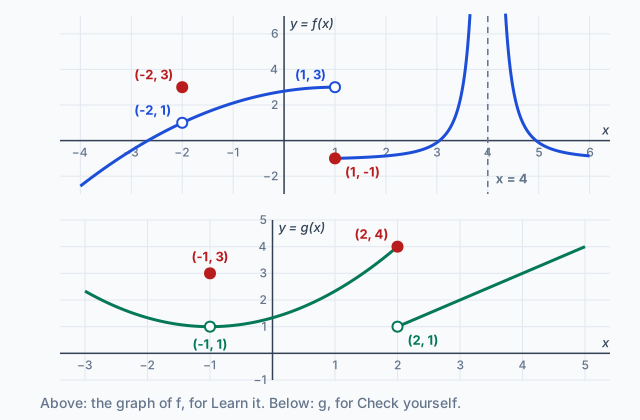 Tap to open the picture full size
Part 1 Think first A parking fee near two hours
Guess before you learn. A wrong guess still makes the answer stick.
Predict first
A parking garage charges 6 dollars for any stay of up to 2 hours, and 9 dollars for a stay of more than 2 hours, up to 3 hours. Think of the fee as a function of the parking time. As the parking time gets closer and closer to 2 hours, what fee does it get closer to?
In short. A limit read from a graph is the height the graph approaches as closes in on from both sides, whatever happens at itself.
- One-sided limits follow the graph from one side only: from the left and from the right.
- A limit does not exist when the two sides disagree, when the function is unbounded, or when it oscillates.
- A graph on a screen can hide a missing point or behavior too small for its scale, so look close to .
Part 2 Learn it Four short ideas, each checked as you go
3a. Follow the graph to the height it approaches
To estimate from a graph, put a finger on the graph a little to the left of and slide it toward . Then do the same from the right. The limit is the height, the -value, that your fingers close in on. It is an output, never the input .
What happens exactly at plays no part, because a limit looks at inputs close to but not equal to .
Look at the top graph, of , near . From both sides the curve heads to the open circle at . An open circle marks a point that is not on the graph; the filled dot at is the actual value. So
The two numbers differ, and that is allowed. A limit can exist where the function has a different value, or no value at all.
A graph gives an estimate, as good as its scale. If the open circle sat between grid lines, you would read its height as closely as the grid lets you and report that.
Quick check · Decide and justify
No calculator. The graph of approaches an open circle at from both sides, and it has a filled dot at . A classmate says . Is the classmate right?
Which reason supports your answer?
3b. One-sided limits
Sometimes the graph closes in on one height from the left and a different height from the right. Each side then has its own one-sided limit:
- , the left-hand limit, follows the graph through inputs less than ;
- , the right-hand limit, follows it through inputs greater than .
The small minus and plus say which side. They do not mean negative or positive inputs.
On the top graph at , the curve rises from the left toward the open circle at , and the graph to the right starts at the filled dot . So
The two-sided limit exists only when both one-sided limits exist and are equal. Here they are not, so does not exist, even though does. At , by contrast, both sides approach 1, so the two-sided limit there is 1.
A common slip is to average the two sides and call the limit at 1 equal to 1. No single height is approached, so there is no limit to report.
Quick check · Match
No calculator. From the left, the graph of approaches an open circle at . To the right of 2, it starts at an open circle at and falls. A filled dot sits at . Tap each expression, then its value.
3c. Three ways a limit can fail to exist
A limit does not exist when the graph approaches no single real number. On a graph that happens in three ways.
The two sides disagree. You saw it at on the top graph: one height from the left, another from the right.
The function is unbounded. Near the top graph climbs past every height as gets close to 4 from either side. No real number is approached, so does not exist. In 1.14 you will describe this kind of failure with the symbol , but is not a number, so the limit still does not exist. If one side rose and the other fell, you would describe each side on its own: growing without bound on one side, falling without bound on the other.
The function oscillates. The graph of swings between and 1 faster and faster as gets close to 0. On any interval around 0, however short, it takes every height from to 1 and never settles on one, so does not exist.
Wiggling alone does not rule out a limit. A graph whose swings shrink toward nothing can still settle on one height; what matters is whether the heights settle.
Quick check · Sort it
No calculator. None of these limits exists. Tap a card, then tap the reason it fails.
The two sides disagree
The function is unbounded
The function oscillates
3d. What a graph on a screen can miss
A graphing calculator draws a graph by lighting pixels, one sample of for each column of the screen. That is plenty for most functions, but at the wrong scale a graph can miss important behavior.
A single missing point is invisible. has no value at , where the formula gives . Everywhere else it equals . On the screen you see an unbroken line, because one missing point is narrower than a pixel.
A jump across an asymptote can look like part of the graph. In connected mode, a calculator may join the last pixel left of a vertical asymptote to the first pixel right of it, drawing a near-vertical segment that is not on the graph at all.
Small or fast behavior can disappear. A bump a thousandth of a unit tall, or swings that fall between two pixel columns, will not show in a window 20 units wide.
So when you estimate a limit with a calculator, choose a window centered on , narrow it until the graph settles near one height on each side, and trace on both sides. Treat the screen as evidence, and check it against what the formula says.
Quick check · Decide and justify
No calculator. A student graphs in a standard window and sees an unbroken straight line through . The student concludes that . Is the student right?
Which reason supports your answer?
Part 3 Watch it done Estimating a limit on a graphing calculator
Watch each step, then do the last one yourself on your calculator.
Estimate from the graph of , to three decimal places.
Step 1 · Check the point itself
At the expression is , so the function has no value there. The limit asks only about inputs near 0, so a graph can still answer it.
Step 2 · Graph in a wide window
Enter and use the window , . The graph rises from about 0.44 at to 4 at , and it looks unbroken where it crosses the -axis, a little above 1.
Why this step?
The graph looks unbroken at . Why is that not evidence that the function has a value there?
One missing point is narrower than a pixel, so the screen cannot show the gap, and the first step showed the expression is at 0. What the picture can show is the height the graph approaches, and that is all a limit needs.
Step 3 · Zoom in around 0
Change the window to , . The graph is now nearly a straight line, and on both sides of it heads to the same height, so the two one-sided limits agree. A narrow window is what lets you read that height to three decimal places.
Your step · Calculate
Graphing calculator required. Finish it. Trace the graph of at and at , and estimate . Give your answer to three decimal places.
Part 4 Try it Two new functions
Try it · Calculate
Graphing calculator required. In radian mode, graph in a window close to , and estimate . Give your answer to three decimal places.
Try it · Multiple choice
No calculator. As approaches 2 from the left, the graph of rises past every height. As approaches 2 from the right, it falls below every height. Which statement is true?
Part 5 Explain it Write it the way the exam asks
On the exam free response is handwritten, so work on paper with your graphing calculator in radian mode. Nothing you type here leaves this page. Then compare with the model answer and score each point.
Free response is 50% of the exam score. This one is shaped like Question 2, from free-response Part A (graphing calculator required).
Free-response practice · Question 2 style
Graphing calculator required. The temperature in a greenhouse, in degrees Fahrenheit, hours after 6 a.m. is modeled by . Your calculator is in radian mode. Let
the average rate of change of the temperature from to .
(a) A student graphs in the window , and sees no break in the graph at . Explain why does not exist, and why the graph does not show this.
(b) Use the graph of , in a window you choose close to , to estimate and . Explain how your estimates show that exists, and give its value to three decimal places.
(c) A classmate graphs in the window , . Near the graph seems to end at a height above 5 on the left and start again near 2 on the right, so the classmate says does not exist. Explain why this window cannot settle the question.
Model answer
(a) divides by zero, so does not exist. The calculator plots one point for each column of pixels, and a single missing point is far too narrow to see at this scale, so the graph looks unbroken.
(b) In the window , , tracing gives and . From the left and from the right the graph approaches the same height, so and . The one-sided limits are equal, so exists, and it is approximately 4.180.
(c) The window is 200 units wide, and a calculator plots one point for each of about 100 columns of pixels, so the plotted points nearest are about 2 units away from it: and . Those are average rates over intervals about 2 hours long. The limit depends only on close to 0, and at this scale the graph shows nothing that close. The narrow window in part (b) does, and there both sides approach 4.180, so the limit exists.
Score your own answer. This is a self-check, not a grade. Tick each point your answer makes.
Part 6 Check yourself Reading the graph of g
The two case questions use the graph of , the lower graph in the figure. Answer them from it.
The lower graph in the figure, the same one shown at the top of this lesson, is the graph of for . An open circle marks a point that is not on the graph; a filled dot is a value of .
Tap to open the picture full sizeCase question 1 · Calculate
No calculator. Use the graph of . What is ?
Case question 2 · Multiple choice
No calculator. Use the graph of . Which of the following statements are true?
I.
II.
III.
The rest stand on their own and do not use the case.
Check yourself · Spot the error
No calculator. Near , the graph of approaches the height 2 from the left and from the right, and it has a filled dot at . A student reads the limits from the graph. Tap the first line with a mistake.
Check yourself · Fill the statement
No calculator. Tap a blank, then tap an answer.
A two-sided limit exists only when both one-sided limits exist and . Near , a function whose graph climbs past every height from both sides is , so its limit at 4 does not exist.
Part 7 Keep it Bring back earlier ideas
This lesson stands on two earlier ideas: limit notation, and rates of change at an instant. Pulling them back up is what makes them last.
Bring it back · Multiple choice
No calculator. As gets close to 5 from either side, gets close to 8. Which notation states this?
Bring it back · Calculate
No calculator. A ball is thrown upward, and its height after seconds is meters. Its average rate of change of height from to is 10.5 for , 10.05 for , 9.95 for and 9.5 for , in meters per second. What is the ball's instantaneous rate of change of height at , in meters per second?
In three lines
- A limit read from a graph is the height the graph approaches from both sides of , not the value at .
- One-sided limits follow the graph from the left or from the right, and the two-sided limit exists only when they agree.
- A limit does not exist when the sides disagree or the function is unbounded or oscillates, and a screen can hide a missing point.
Exam strategy for this topic
- Section I Part A, Multiple Choice (calculator not permitted): 29 questions in 62 minutes.
- Section I Part B, Multiple Choice (graphing calculator required): 13 questions in 38 minutes.
- Section II Part A, Free Response (graphing calculator required): 2 questions in 30 minutes.
- Section II Part B, Free Response (calculator not permitted): 4 questions in 60 minutes.
When a question gives a graph, read each one-sided limit from its own side before you write a two-sided limit, and keep the value at the point separate from the limit there. On a calculator question, write down the window you used or the traced values, so your estimate shows its setup.
Questions students ask
Does a limit have to equal the value of the function?
No. The limit uses inputs near , and is the value at . On the top graph while . When the two agree the function is continuous there, an idea later in Unit 1.
Is writing the same as saying the limit exists?
No. That notation, which 1.14 introduces, describes how the limit fails: the outputs grow past every bound. is not a real number, so the limit does not exist.
How do I choose a calculator window for a limit?
Center it on and make it narrow, then narrow it again until the graph settles near one height on each side. Trace on both sides of , never exactly at , where there may be no value.
Can a limit exist at an input where the function has no value?
Yes. The limit only needs the graph to approach one height from both sides. has no value at 0, yet its graph approaches a height of about 1.099 there.
How exact is a limit read from a graph?
It is an estimate, as good as the scale of the graph. Read to the grid on paper, or zoom in on a calculator for more decimal places. Later topics find many limits exactly, with algebra.
Course alignment, for teachers
AP Calculus AB topic 1.3, Unit 1: Limits and Continuity.
- Skill 2.B: Identify mathematical information from graphical, numerical, analytical, and/or verbal representations.
This lesson maps all 4 essential knowledge statements of the topic to the part that teaches each one: 4 are checked by a scored question. The map is in the lesson file.