Unit 1 · Topic 1.4 · about 30 minutes · 7 parts · 12 scored checks, 3 of them multiple choice
AP Calculus AB 1.4: Estimating Limit Values from Tables
Unit 1: 10 to 15% of the multiple-choice section
What you'll be able to do
- Estimate a limit, and each one-sided limit, from a table of values of a function.
Key vocabulary
| Term | What it means | The exam trap |
|---|---|---|
| Limit, | A real number such that can be made arbitrarily close to by taking sufficiently close to , but not equal to . | Write the arrow and the value every time; names an output, and is an input. |
| One-sided limit | A limit taken from one side only: uses inputs less than , and uses inputs greater than . | The minus or plus sign names the side the inputs come from, not the sign of the outputs. |
| Numerical information | Values of a function at chosen inputs, usually given in a table. | A table lists outputs at a few inputs only; it says nothing about the inputs between its rows. |
| Estimate | A value read from the evidence, here the trend in a table, rather than found exactly. | When a number comes from a table, say so: write "about" or use the word estimate. |
 Tap to open the picture full size
Part 1 Think first How much can compounding add?
Commit to a guess first. Even a wrong one makes the reveal easier to remember.
Predict first
A savings account pays 100 percent interest a year, added in equal pieces. If the year is split into pieces years long, 1 dollar grows to dollars by the end of the year. The table shows the amount as the pieces get shorter.
As shrinks toward 0, what happens to the amount?
In short. Estimating a limit from a table means reading the outputs at inputs closer and closer to , on each side, and naming the number they approach.
- Rows with estimate the left-hand limit , and rows with estimate the right-hand limit .
- When both sides close in on one number, that number estimates ; when they approach different numbers or grow without bound, the table points to no limit.
- A table samples only a few inputs, so what it gives is an estimate, not a proof.
Part 2 Learn it Three short ideas, each checked as you go
4a. Read the outputs as the inputs close in
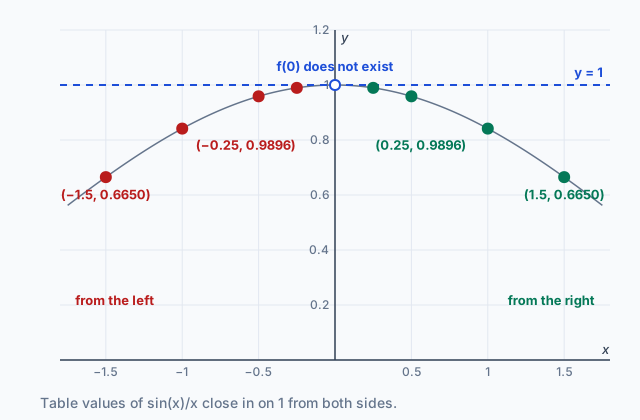
A limit asks what does as gets close to a number . A table cannot take all the way to , but it can take it close. The inputs , , creep up on 1 from the left, and , , creep down on it from the right.
Here is near . The table has no row at 0, where the quotient would divide by zero.
| -0.1 | 0.95163 |
|---|---|
| -0.01 | 0.99502 |
| -0.001 | 0.99950 |
| 0.001 | 1.00050 |
| 0.01 | 1.00502 |
| 0.1 | 1.05171 |
Read each side toward 0. From the left the outputs climb: 0.95163, 0.99502, 0.99950. From the right they fall: 1.05171, 1.00502, 1.00050. Both sides close in on 1, and each row is about ten times closer to 1 than the row before it. So the table suggests
That number is an estimate: the value the outputs approach, not any one entry. The entry 1.00050 is close to 1, but the limit is the number the whole column is heading for.
Quick check · Calculate
No calculator. The table gives values of a function near .
Use the table to estimate .
4b. One side at a time
A table near holds two tables: the rows with and the rows with . Each one estimates a one-sided limit. The rows left of estimate the left-hand limit, , and the rows right of estimate the right-hand limit, .
When both sides close in on the same number, that number is the estimate of . When they do not, the table points to no limit at :
- The two sides close in on different numbers. If the outputs are 2.9, 2.99, 2.999 left of 1 and 0.1, 0.01, 0.001 right of it, the left-hand limit is about 3 and the right-hand limit is about 0, so does not exist.
- The outputs grow without bound, such as 100, 10,000 and 1,000,000. They close in on no number.
- The outputs keep jumping around as the inputs get closer, and never settle.
An output can approach its number from above on one side and from below on the other. Only the number matters.
Quick check · Sort it
No calculator. Each card lists at , , (left of 2), then at , , (right of 2). Tap a card, then tap what the table suggests about .
The limit is about 5
No limit: the two sides disagree
No limit: the values are unbounded
4c. The row at c, and what a table can miss
Some tables include a row at itself. Read it, then set it aside. A limit is about inputs close to but not equal to , so can be any number, or not exist at all, without changing the limit. If the outputs near 3 close in on 8 from both sides and the table also says , the estimate of is still 8. The row at 3 answers a different question: what is ?
A table is also only a sample. It lists a handful of inputs and says nothing about the ones between them. The function is exactly 0 at , and , so a table of those rows looks like it closes in on 0 from both sides. Between those inputs the outputs swing back and forth between and 1, as at , where , and the limit at 0 does not exist.
So read rows on both sides, closer and closer to , and call what you find an estimate.
Quick check · Multiple choice
No calculator. The table gives values of a function near .
Which is the best estimate of ?
Part 3 Watch it done A limit read from both sides
Watch each step, then do the last one yourself.
The table gives values of near . Use it to estimate .
Step 1 · Split the table at 0
The rows , , approach 0 from the left, and , , approach it from the right. There is no row at 0, where the quotient is .
Step 2 · Read the left side
In order toward 0: 0.251582, 0.250156, 0.250016. The outputs fall toward 0.25, and their distance from it shrinks from about 0.0016 to 0.00016 to 0.000016. So is about 0.25.
Step 3 · Read the right side
In order toward 0: 0.248457, 0.249844, 0.249984. The outputs rise toward 0.25 from below, with gaps shrinking the same way. So is about 0.25.
Why this step?
Why read the two sides separately instead of only the two rows nearest 0?
A two-sided limit exists only when both one-sided limits exist and agree. The two nearest entries, 0.250016 and 0.249984, are close to each other, but a pair of entries cannot show where each side is heading. A whole column on each side can.
Your step · Calculate
No calculator. Finish it. Both one-sided estimates for are about 0.25. What is the best estimate of ? Give a decimal.
Part 4 Try it Two new tables
Try it · Decide and justify
No calculator. A table gives only three values: , and . A classmate says the table shows that is about 3. Is the classmate right?
Which reason supports your answer?
Try it · Calculate
No calculator. A switch in a circuit closes at time seconds. The table gives the current , in amperes, at times near 0.
Use the table to estimate , in amperes.
Part 5 Explain it Write it the way the exam asks
Free response is written by hand on the exam, so answer on paper first. Nothing you type here leaves this page. Then open the model answer and tick each point you earned.
Free response is 50% of the exam score. This one is shaped like Question 5, from free-response Part B (calculator not permitted).
Free-response practice · Question 5 style
No calculator. A cart moves along a straight track. For , is the cart's average velocity, in meters per second, over the time interval from to seconds. A second cart is bumped at , and is its average velocity, in meters per second, over the same interval. Selected values are in the table.
(a) Use the table to estimate and . Explain your reasoning.
(b) Use your answers from part (a) to estimate . Using correct units, interpret the meaning of this limit in the context of the problem.
(c) Does the table support the claim that exists? Justify your answer.
Model answer
(a) For , , the values of are 2.0127, 2.0013, 2.0001, closing in on 2, so is about 2. For , , they are 1.9877, 1.9988, 1.9999, also closing in on 2, so is about 2.
(b) Both one-sided estimates are 2, so is about 2. The average velocities over shorter and shorter intervals with one end at approach 2, so at the instant seconds the cart's velocity is about 2 meters per second.
(c) No. For the values of , 1.525, 1.5025, 1.50025, close in on 1.5, and for the values 2.55, 2.505, 2.5005 close in on 2.5. The one-sided limits appear to be 1.5 and 2.5, which are not equal, so the table does not support the claim that exists.
Score your own answer. This is a self-check, not a grade. Tick each point your answer makes.
Part 6 Check yourself A table with a gap at 3
Both case questions use the same table. Answer them from it.
The table gives values of a function near , including the value at 3 itself.
| 2.9 | 0.7 |
|---|---|
| 2.99 | 0.97 |
| 2.999 | 0.997 |
| 3 | 5 |
| 3.001 | 4.003 |
| 3.01 | 4.03 |
| 3.1 | 4.3 |
Case question 1 · Fill the statement
No calculator. Tap a blank, then tap an answer.
From the table, is about and is about .
Case question 2 · Multiple choice
No calculator. Which statement about is best supported by the table?
The rest stand on their own and do not use the case.
Check yourself · Spot the error
No calculator. A student uses a table to decide whether exists. Tap the first line with a mistake.
Check yourself · Match
No calculator. A table gives at , , , , , and . Tap each quantity, then the rows you read to estimate or find it.
Part 7 Keep it Bring back earlier ideas
Reading a limit from a table rests on two earlier ideas in this unit. Pulling them back up is what makes them last.
Bring it back · Multiple choice
No calculator. On the graph of , as approaches 1 from the left the graph approaches the open circle at , and as approaches 1 from the right it approaches the closed dot at . Which statement is true?
Bring it back · Calculate
No calculator. For every , the average velocity of a ball over the time interval from to seconds is meters per second. What is the ball's velocity, in meters per second, at the instant ?
In three lines
- Rows on each side of c estimate the one-sided limits: the number the outputs approach as the inputs close in.
- When both sides approach the same number, that number estimates the limit; when they differ or grow without bound, there is no limit.
- A row at c gives the value of the function there, which is not part of the limit, and a table only ever gives an estimate.
Exam strategy for this topic
- Section I Part A, Multiple Choice (calculator not permitted): 29 questions in 62 minutes.
- Section I Part B, Multiple Choice (graphing calculator required): 13 questions in 38 minutes.
- Section II Part A, Free Response (graphing calculator required): 2 questions in 30 minutes.
- Section II Part B, Free Response (calculator not permitted): 4 questions in 60 minutes.
When a question gives a table, say which rows you read: name the inputs on each side of c and the number the outputs approach there. Give each one-sided estimate before the two-sided one, and when the two sides disagree, name both values and say they are not equal.
Questions students ask
How close to do the inputs in a table need to be?
Close enough that the pattern on each side is clear. Inputs that move ten times closer each row, such as , and away from , usually make the trend plain. If the rows still disagree, look at inputs closer still.
Can a table prove that a limit has a certain value?
No. A table shows a few inputs, so it supports an estimate. The function is 0 at , and but has no limit at 0. Exact values come from algebra and the properties of limits, which start in the next topic.
Do the values have to approach from the same direction on both sides?
No. The outputs can rise toward the number on one side and fall toward it on the other, as in the table for . What matters is that both sides close in on the same number.
Should I write the estimate as the number the values approach or as the last entry?
The number they approach. In the table for no entry equals 1, but 1 is where both columns are heading, so 1 is the estimate.
Are left-hand and right-hand limits the same thing as one-sided limits?
Yes. A left-hand limit, , uses inputs less than , and a right-hand limit, , uses inputs greater than . Both are one-sided limits.
Course alignment, for teachers
AP Calculus AB topic 1.4, Unit 1: Limits and Continuity.
- Skill 2.B: Identify mathematical information from graphical, numerical, analytical, and/or verbal representations.
This lesson maps the one essential knowledge statement of the topic to the part that teaches each one: 1 is checked by a scored question. The map is in the lesson file.