Unit 1 · Topic 1.9 · about 30 minutes · 7 parts · 12 scored checks, 3 of them multiple choice
AP Calculus AB 1.9: Connecting Multiple Representations of Limits
Unit 1: 10 to 15% of the multiple-choice section
Key vocabulary
| Term | What it means | The exam trap |
|---|---|---|
| Limit | The real number that can be made arbitrarily close to by taking sufficiently close to (but not equal to ), written . | The limit is about inputs near ; decide what the outputs approach before you look at what happens at itself. |
| One-sided limit | A limit from one side only: uses inputs less than , and uses inputs greater than . | The small minus or plus sign names a side, not a negative or positive number; match it to the right rows or the right part of the curve. |
| Graphical representation | A graph of the function, from which a limit is estimated by the height the curve heads toward near . | A window's scale can hide behavior, so change the window before you trust what you see. |
| Numerical representation | A table of inputs and outputs, from which a limit is estimated by the outputs as the inputs close in on . | A table can only suggest a limit; confirm its pattern with a formula or a graph when you can. |
| Analytical representation | A formula for the function, from which a limit can be found exactly with the limit theorems or by rewriting. | Substitution that gives is a signal to rewrite, not a result. |
 Tap to open the picture full size
Part 1 Think first What does the fee close in on?
Guess before you learn. A wrong guess still makes the answer stick.
Predict first
A parking garage charges 4 dollars for a stay of up to 1 hour, and 7 dollars for a stay of more than 1 hour, up to 2 hours. As the length of a stay gets closer and closer to 1 hour, what amount does the fee get close to?
In short. Connecting representations of limits means reading one limit from words, notation, a graph, a table or a formula, and checking that they agree.
- Every representation of looks at inputs near , never at itself.
- Tables and graphs suggest a limit; a formula, rewritten when it needs to be, can confirm it.
- The value at and the limit at are separate facts, and either one can exist without the other.
Part 2 Learn it Three short ideas, each checked as you go
9a. One limit, four ways to show it
The statement says that as gets close to 2, from either side and never equal to 2, gets close to 5. A question can hand you that fact in any of four forms.
- In words: as approaches 2, approaches 5.
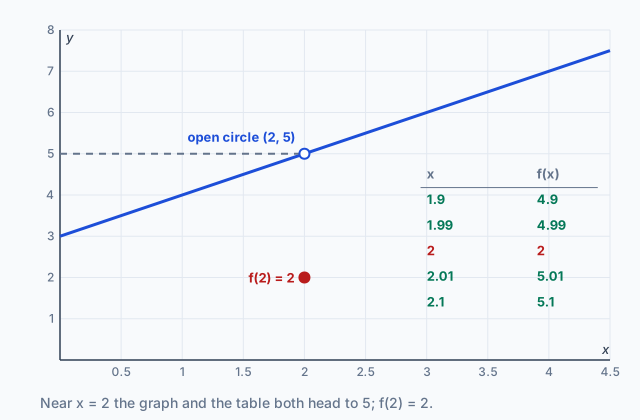
- On a graph: the curve heads toward height 5 from both the left and the right of . The graph at the top closes in on the open circle at .
- In a table: inputs closing in on 2 from both sides give outputs closing in on 5. In the table at the top, 1.99 gives 4.99 and 2.01 gives 5.01.
- In a formula: for , , and approaches 5.
None of the four says what happens at . In the picture, : a filled dot below the circle, and the row for in the table. The limit is still 5. The value at an input and the limit at that input are separate facts, and every representation keeps them apart.
Quick check · Match
No calculator. Each description shows a function near . Tap a description, then the statement in limit notation that it shows.
9b. Tables and graphs suggest, and can mislead
A table or a graph gives you an estimate of a limit. Read it with care.
A table needs inputs that close in on from both sides. Rows on one side only estimate a one-sided limit, from the left or from the right, and the two can differ, as the parking fee's did.
A table also shows only the inputs someone chose. For , the inputs 0.1, 0.01 and 0.001 all give exactly 0, yet between any two of them reaches both 1 and . Near 0 it oscillates and never settles.
A graph has a different weakness: scale. A hole is a single missing point, so the graph may show it as a one-pixel gap or not at all, and a wiggle much smaller than the window can vanish. Zooming in, or changing the window, can show behavior the first picture missed.
Whichever representation you have, watch for the three ways a limit can fail to exist:
- the two one-sided limits differ;
- the outputs grow without bound, so the function is unbounded;
- the outputs keep oscillating.
Quick check · Decide and justify
No calculator. Let . A classmate evaluates , and , gets 1 each time, and concludes that . Is the classmate right?
Which reason supports your answer?
9c. A formula confirms what the others suggest
A table or a graph suggests a limit. A formula, the analytical representation, lets you find it exactly, and that is how you confirm an estimate.
- For a polynomial, or a quotient of polynomials whose denominator is not 0 at , the limit theorems give the limit by substitution. Limits also combine: the limit of a sum, a product or a constant multiple is the sum, product or multiple of the limits, when those exist.
- If substitution gives , that is not an answer. Rewrite the expression in an equivalent form, by factoring or by multiplying by a conjugate, and then substitute.
- If the formula is piecewise, find each one-sided limit from the piece that holds on that side.
Suppose a table of gives and . Substituting 3 gives , so factor: for , . Then , and the formula confirms what the table suggested.
Quick check · Calculate
No calculator. A table of gives and . Find exactly, as a decimal.
Part 3 Watch it done From a formula to one-sided limits to a graph
Watch each step, then do the last one yourself.
Let for , , and for . Find , and describe the graph of at .
Step 1 · Left of 2
For , , a polynomial, so .
Why this step?
Why use for the left-hand limit, when comes from a different part of the formula?
The left-hand limit looks only at inputs just below 2, never at 2 itself, and every one of those inputs uses the piece . The part of the formula that says is about the input 2 alone, which no limit looks at.
Step 2 · Right of 2
For , , so .
Step 3 · Compare the sides
Both one-sided limits are 5, so . The value does not change that.
Your step · Fill the statement
No calculator. Finish it. Tap a blank, then tap an answer.
On the graph of this , both pieces head to an open circle at height above , and a filled dot sits at height .
Part 4 Try it Two new representations
Try it · Calculate
Graphing calculator required. Let . In radian mode, graph in the window , , and use the graph to estimate . Give your answer to three decimal places.
Try it · Multiple choice
No calculator. Let . Which describes the graph of near ?
Part 5 Explain it Write it the way the exam asks
On the exam free response is handwritten, so work on paper first. Nothing you type here leaves this page. Then compare with the model answer and score each point.
Free response is 50% of the exam score. This one is shaped like Question 3, from free-response Part B (calculator not permitted).
Free-response practice · Question 3 style
No calculator. Water flows into a tank. The volume of water in the tank, in liters, minutes after a valve is opened is for . For , let
the average rate of change of , in liters per minute, between 9 minutes and minutes.
(a) Values of near are , , and . Use these values to estimate .
(b) A student graphs on a calculator, sees no break in the curve near , and concludes that . Explain why does not exist, and why a calculator graph cannot be relied on to show whether a single point is missing.
(c) Determine exactly, by rewriting in an equivalent form. Show your work. Using correct units, interpret this limit in the context of the problem.
Model answer
(a) From the left, and . From the right, and . Both sides close in on 10, so .
(b) would be , which divides by zero, so does not exist: an average rate of change needs a change in . A calculator plots only a sample of inputs. If is not one of them, nothing marks the missing point; if it is, the gap is one pixel wide and easy to miss. So the graph shows where the outputs head, but the graph alone cannot settle .
(c) For , . So . At minutes, the volume of water in the tank is increasing at a rate of 10 liters per minute.
Score your own answer. This is a self-check, not a grade. Tick each point your answer makes.
Part 6 Check yourself One function, one table
The two case questions use the same table. Answer them from it.
A function is defined for all real numbers. The table gives some of its values near .
| 0.9 | 2.81 |
|---|---|
| 0.99 | 2.9801 |
| 0.999 | 2.998001 |
| 1 | 5 |
| 1.001 | |
| 1.01 | |
| 1.1 |
Case question 1 · Multiple choice
No calculator. Which statement is best supported by the table?
Case question 2 · Calculate
No calculator. Use the table to estimate .
The rest stand on their own and do not use the case.
Check yourself · Spot the error
No calculator. A student finds . Tap the first line with a mistake.
Check yourself · Sort it
No calculator. Each card describes a function near . Tap a card, then the bin for what it shows about .
The limit is 2
The limit does not exist
Part 7 Keep it Bring back earlier ideas
These two questions come from earlier lessons. Pulling them back up is what makes them last.
Bring it back · Multiple choice
No calculator. A runner's average speed from seconds to a later time is 6.2301 meters per second for , 6.2030 for and 6.2003 for . Which best describes the runner's speed at the instant ?
Bring it back · Calculate
No calculator. A function satisfies for all in an open interval containing 1. Find .
In three lines
- A limit can be shown in words, in notation, on a graph, in a table or by a formula, and each shows the same fact.
- Tables and graphs give estimates; a formula, rewritten when substitution gives , confirms the value.
- The limit at an input and the value there are separate facts, and a limit fails to exist when the sides differ, the outputs are unbounded or they oscillate.
Exam strategy for this topic
- Section I Part A, Multiple Choice (calculator not permitted): 29 questions in 62 minutes.
- Section I Part B, Multiple Choice (graphing calculator required): 13 questions in 38 minutes.
- Section II Part A, Free Response (graphing calculator required): 2 questions in 30 minutes.
- Section II Part B, Free Response (calculator not permitted): 4 questions in 60 minutes.
When a question gives a limit in one representation and asks about another, write down what you read before you answer: the left-hand limit, the right-hand limit and the value at the input, as three separate facts. On a graphing calculator question, say what you graphed and give a decimal estimate to three places.
Questions students ask
If a table and a graph seem to disagree, which do I trust?
Neither on its own, because both are estimates. Look for the reason: a table may use only special inputs or only one side, and a graph's window may hide a small feature. A formula, when you have one, settles it.
Can a limit exist where does not?
Yes. The limit looks only at inputs near . has no value at 2, yet its limit there is 5.
How close to should the inputs in a table be?
Close enough that the outputs settle, on both sides. A good table uses inputs such as , and and checks that both sides head to the same number.
What does the small minus sign in mean?
It names the side: inputs less than , closing in on it from the left. It does not make anything negative. A plus sign means inputs greater than .
Can I use a calculator to find a limit?
On the calculator parts of the exam you can graph the function in a window you choose and read where it heads, and a written answer says what you graphed. On the parts without a calculator, work from the formula.
Course alignment, for teachers
AP Calculus AB topic 1.9, Unit 1: Limits and Continuity.
- Skill 2.C: Identify a re-expression of mathematical information presented in a given representation.
This lesson maps the topic's 0 learning objectives, since the course framework gives it no essential knowledge statements, to the part that teaches each one: 0 are checked by a scored question. The map is in the lesson file.