Unit 2 · Topic 2.3 · about 30 minutes · 7 parts · 11 scored checks, 3 of them multiple choice, plus 2 from earlier lessons
AP Calculus AB 2.3: Estimating Derivatives of a Function at a Point
Unit 2: 10 to 15% of the multiple-choice section
What you'll be able to do
- Estimate the derivative of a function at a point from a table of values, from a graph, or with a graphing calculator.
Key vocabulary
| Term | What it means | The exam trap |
|---|---|---|
| Derivative at a point, | The instantaneous rate of change of at : the limit of the difference quotient as the interval shrinks to , provided that limit exists. | A table or a graph gives only an estimate of , so write in front of a value you get from one. |
| Difference quotient | A change in output divided by the change in input, such as , the average rate of change from to . | Write the quotient with its values before you simplify it, so a reader can see which inputs you chose. |
| Tangent line | Where exists, the line through whose slope is , the line the graph runs along near that point. | When the tangent line is drawn, read your two points from the line itself, not from the curve. |
| Numerical derivative | A graphing calculator's estimate of , worked out from a difference quotient over a very small interval around . | Write the derivative you evaluated, such as and its value, rather than the keys you pressed. |
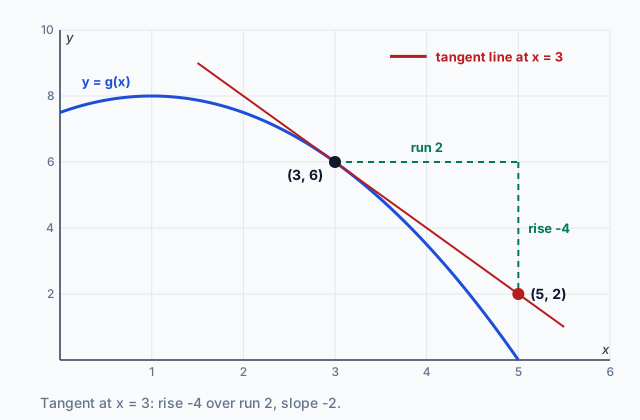 Tap to open the picture full size
Part 1 Think first How fast is the battery charging?
Guess before you learn. A wrong guess still makes the answer stick.
Predict first
A phone is plugged in at . The table gives its battery charge , in percent, minutes later.
About how fast is the charge rising at minutes?
In short. When you cannot find exactly, estimate it: from a table or a graph with the slope between two points close to , or from a formula with a graphing calculator's numerical derivative.
- From a table, use the inputs closest to on each side, and write the difference quotient with their values before the number.
- From a graph, use the slope of the tangent line at , or the slope between two points on the curve close to .
- A calculator's numerical derivative is a difference quotient over a tiny interval, so it is an estimate, and it means something only where exists.
Part 2 Learn it Three ways to estimate a derivative
2a. From a table: the closest values on each side
A table gives a function at only a few inputs, so it cannot give exactly. It can estimate it. The derivative is the limit of average rates over intervals that shrink to , so the best the table can do is the average rate over the shortest interval it gives around .
When falls between two inputs in the table, use those two. That is what Think first did:
When is itself in the table, the inputs just before and just after it give an interval centered on it: .
Write the difference quotient with the table's values before the number, as above. It shows which values you used and why the number is a rate, and on a free-response question the number alone does not earn the point. The units are the output's units per unit of input, so read the estimate back in words: about 25 minutes after it is plugged in, the charge is rising at about 1.2 percent per minute.
Quick check · Calculate
No calculator. The table gives values of a function .
Use the table to estimate .
2b. From a graph: the slope of the tangent line
On a graph, is the slope of the line tangent to the graph at . When the tangent line is drawn, pick two points on it that you can read clearly, not too close together, and divide the rise by the run.
On the graph at the top, the tangent line at passes through and , so
The slope is negative because the line falls from left to right. Read both points from the tangent line, not from the curve: away from the curve bends away from the line, and at the curve is at 0, not 2.
When no tangent line is drawn, read two points on the curve close to , one on each side, and find the slope between them. That is the same difference quotient a table gives, and the closer the two points, the better the estimate, as long as you can still read them accurately.
Quick check · Multiple choice
No calculator. An oven is cooling. On the graph of its temperature , in degrees Fahrenheit, minutes after it is turned off, the points and lie on the curve, and no tangent line is drawn. Which estimate of do these two points give?
2c. With a graphing calculator: the numerical derivative
When a function is given by a formula, a graphing calculator can estimate for you. Its numerical derivative works out a difference quotient over a very small interval around , so the result is an estimate, and where the derivative exists it is a very close one.
For at , the quotient over the interval from 2.999 to 3.001 is
and the calculator's numerical derivative gives to three decimal places.
On a free-response question, the expression you evaluated is part of the answer, so write the derivative and its value, , not the keys you pressed. Give three decimal places, rounded or truncated, as the question asks. For a function with sine or cosine, put the calculator in radian mode first.
One caution. A numerical derivative works out one difference quotient and never takes a limit, so it can show a number even where the derivative does not exist. At a sharp corner, such as the graph of at , there is no derivative, but a quotient centered on 2 gives 0, and a calculator that uses one shows 0.
Quick check · Calculate
Graphing calculator required. In radian mode, let . Use the calculator's numerical derivative to find . Give your answer to three decimal places.
Part 3 Watch it done An estimate from a table with uneven gaps
Watch each step, then do the last one yourself.
A gate is opened at the bottom of a reservoir. The table gives the depth of the water, feet, hours later.
Use the table to estimate . Show the work, and give units.
Step 1 · Find the inputs around 4
4 is not in the table. The closest input before it is 3 and the closest after it is 5. Other inputs, such as 0 and 9, also lie on either side of 4, but they are farther away.
Why this step?
Why use 3 and 5 rather than 3 and 9, which also lie on either side of 4?
The derivative is the limit of average rates as the interval shrinks to 4. From 3 to 5 is the shortest interval around 4 the table gives, so its average rate is the closest the data come to that limit. From 3 to 9 averages over six hours, while the rate keeps changing.
Step 2 · Write the difference quotient
Your step · Calculate
No calculator. Finish it. Evaluate to estimate , in feet per hour.
Part 4 Try it A formula and a corner
Try it · Calculate
Graphing calculator required. The concentration of a medicine in a patient's blood is milligrams per liter, hours after it is taken. Find , in milligrams per liter per hour. Give your answer to three decimal places.
Try it · Decide and justify
No calculator. Let . A student enters in a graphing calculator, and its numerical derivative at shows 0. The student concludes that . Is the student right?
Which reason supports your answer?
Part 5 Explain it Write it the way the exam asks
On the exam free response is handwritten, so work on paper with your graphing calculator ready. Nothing you type here leaves this page. Then compare with the model answer and score each point.
Free response is 50% of the exam score. This one is shaped like Question 2, from free-response Part A (graphing calculator required).
Free-response practice · Question 2 style
Graphing calculator required. A pot of soup is heating on a stove. Its temperature, in degrees Fahrenheit, is given by a differentiable function of time , in minutes, after the burner is turned on. Values of at selected times are given in the table.
(a) Use the data in the table to estimate . Show the computation that leads to your answer. Using correct units, interpret the meaning of in the context of the problem.
(b) For , the temperature of the soup is modeled by degrees Fahrenheit. Find . Give your answer to three decimal places.
(c) According to the model, is the temperature of the soup increasing faster at minutes or at minutes? Justify your answer.
Model answer
(a) degrees Fahrenheit per minute. At minutes after the burner is turned on, the temperature of the soup is increasing at about 7.833 degrees Fahrenheit per minute.
(b) degrees Fahrenheit per minute, from the calculator's numerical derivative of at .
(c) and degrees Fahrenheit per minute. Both are positive, so the temperature is increasing at both times, and since , it is increasing faster at minutes.
Score your own answer. This is a self-check, not a grade. Tick each point your answer makes.
Part 6 Check yourself A runner on a straight path
The three case questions use the same table. Answer them from it.
A runner sets off along a straight path. Her distance from the start, meters, seconds later, is given at selected times.
| (seconds) | (meters) |
|---|---|
| 0 | 0 |
| 4 | 22 |
| 10 | 61 |
| 12 | 74 |
| 20 | 128 |
Case question 1 · Calculate
No calculator. Use the table to estimate , in meters per second.
Case question 2 · Multiple choice
No calculator. Which expression gives the best estimate of that the table supports?
Case question 3 · Multiple choice
No calculator. From the table, . Which statement does this estimate support?
The rest stand on their own and do not use the case.
Check yourself · Spot the error
No calculator. A table gives and . A student uses it to estimate . Tap the first line with a mistake.
Check yourself · Match
No calculator. Each line is tangent to the graph of a function at the first point named, and passes through the second. Tap a tangent line, then the derivative it estimates at its point of tangency.
Part 7 Keep it Bring back earlier ideas
This lesson stands on the average rate of change from 2.1 and on estimating from a table, which you first did for limits in Unit 1.
From 2.1 Defining Average and Instantaneous Rates of Change at a Point · Calculate
No calculator. Let . What is the value of when ? Give an exact decimal.
From 1.4 Estimating Limit Values from Tables · Calculate
No calculator. The table gives values of a function near .
Use the table to estimate .
In three lines
- From a table, estimate with the difference quotient over the shortest interval around , written out before the number.
- From a graph, use the slope of the tangent line at , or of a line through two points on the curve close to .
- A graphing calculator's numerical derivative estimates closely, but only where the derivative exists.
Exam strategy for this topic
- Section I Part A, Multiple Choice (calculator not permitted): 29 questions in 62 minutes.
- Section I Part B, Multiple Choice (graphing calculator required): 13 questions in 38 minutes.
- Section II Part A, Free Response (graphing calculator required): 2 questions in 30 minutes.
- Section II Part B, Free Response (calculator not permitted): 4 questions in 60 minutes.
When a question gives a table and asks you to estimate a derivative, write the difference quotient with the table's values before the number, and give units. When the work needs a calculator, write the derivative you are evaluating, such as , and its value to three decimal places.
Questions students ask
Why use the closest values in the table?
The derivative is the limit of average rates over intervals that shrink to the point. The shortest interval the table gives around the point is as close to that limit as the data allow, so its average rate is the best estimate the table supports.
What if the point I need is one of the inputs in the table?
Then the inputs just before and just after it give an interval centered on it, as for in the lesson. If a question tells you which values to use, use those.
Is a calculator's numerical derivative exact?
No. It is a difference quotient over a tiny interval, so it is an estimate. Where the derivative exists, it is usually accurate well past three decimal places, which is all a question here asks for.
Should I round or truncate a calculator answer?
Follow the question. The questions here ask for three decimal places and accept the value rounded or truncated there. Keep the full value stored in the calculator while you work, and shorten it only for the final answer.
Can I estimate a derivative from a graph with no tangent line drawn?
Yes. Read two points on the curve close to the point you want, one on each side, and find the slope between them. It is the same difference quotient you would use with a table.
Course alignment, for teachers
AP Calculus AB topic 2.3, Unit 2: Differentiation: Definition and Fundamental Properties.
- Skill 1.E: Apply appropriate mathematical rules or procedures, with and without technology.
This lesson maps all 2 essential knowledge statements of the topic to the part that teaches each one: 2 are checked by a scored question. The map is in the lesson file.