Unit 4 · Topic 4.6 · about 30 minutes · 7 parts · 13 scored checks, 3 of them multiple choice
AP Calculus AB 4.6: Approximating Values of a Function Using Local Linearity and Linearization
Unit 4: 10 to 15% of the multiple-choice section
What you'll be able to do
- Use the equation of a tangent line to approximate a value of a function near the point of tangency, and decide whether that approximation is an overestimate or an underestimate.
Key vocabulary
| Term | What it means | The exam trap |
|---|---|---|
| Tangent line | The line through a point on the graph of whose slope is the derivative there; at it is . | The line touches the graph at the point of tangency, but away from it the two can drift far apart. |
| Point of tangency | The point where the tangent line touches the graph. | Name it before writing anything else; the line's point and slope both come from there. |
| Local linearity | The property that the graph of a function differentiable at a point looks like a line when you zoom in near that point. | It needs a derivative at the point; at a corner, no amount of zooming makes the graph straight. |
| Locally linear approximation (linearization) | Using the tangent line's value in place of the function's value for inputs near the point of tangency. | It is an estimate, not the function's value, so say "approximately" and write , never . |
| Underestimate and overestimate | An estimate below the true value it approximates is an underestimate; one above it is an overestimate. | Compare the estimate with the true value in that order: an estimate that is too big is the overestimate. |
 Tap to open the picture full size
Part 1 Think first Ten minutes from now
Commit to a guess before reading on. The lesson starts from it.
Predict first
At 2:00 pm your phone's battery reads 80 percent, and the battery screen says it is draining at 0.5 percent per minute right now. You have no formula for the charge. What is a sensible estimate of the charge at 2:10 pm?
In short. A tangent line approximation estimates for an input near by the value of the tangent line there, .
- Near the point of tangency, the graph of a differentiable function looks almost straight, so its tangent line stays close to it.
- The estimate is trusted only near ; for inputs far from the line and the graph can be far apart.
- How the graph bends near , read from the sign of , can show whether the line's value is too low or too high.
Part 2 Learn it Three ideas, each checked as you go
4a. Up close, a smooth curve looks like a line
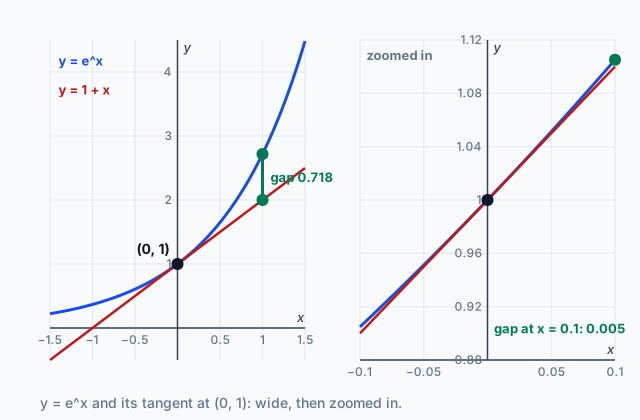
Look at the picture at the top. On the left, the graph of and its tangent line at soon part company: at the curve is at about 2.718 and the line is at 2, a gap of about 0.718. On the right is the same pair zoomed in to . There they are almost one line, and at the gap is about 0.005.
That happens at any point where a function is differentiable. Zoom in far enough and the graph looks straight, and the straight line it looks like is the tangent line. This is called local linearity.
So near the point of tangency, the tangent line is a locally linear approximation of the function: you can read an approximate value of off the line instead of off the curve. The word locally matters. The approximation is trusted only for inputs close to the point of tangency. Far away, as at here, the line and the curve can be well apart.
Why approximate at all? Because often you cannot evaluate exactly. There may be no formula, as with the phone battery, or the value, such as , may not be one you can work out by hand.
Quick check · Fill the statement
No calculator. Fill each blank from the list.
Zoom in on the graph of near a point where is differentiable, and the graph looks almost like a . So the tangent line at that point is a locally approximation of , and it is trusted only for inputs the point of tangency.
4b. Writing the line and using it
To use the tangent line you need its equation. At the line passes through with slope , so in point-slope form it is
To approximate at an input near , put that into the line. Keep three things straight:
- and are both taken at the point of tangency , not at the input you are estimating.
- The slope multiplies , the distance from , not itself.
- The point of tangency should be an input where you know and exactly, close to the input you want.
Example: approximate for . Use . Then and , so . The tangent line is , and at it gives . The true value is , so the estimate is off by about 0.016.
At the same line gives 3, while . Farther from the point of tangency, the estimate is much worse.
Quick check · Calculate
No calculator. Let . Use the line tangent to the graph of at to approximate . Give an exact decimal.
4c. Overestimate or underestimate?
A tangent line value is an estimate, so ask which side of the true value it lands on. The answer comes from how the graph bends near the point of tangency, and the second derivative from Unit 3 measures that.
is the rate of change of . Suppose on an interval around , so the slopes of grow as you move right. To the right of its slopes are greater than the line's, so it rises faster (or falls more slowly) and ends up above. To the left of its slopes are smaller than the line's, so walking back from it loses less height than the line (or gains more) and again ends up above. A graph that bends up like this is concave up, a term Unit 5 builds on. The tangent line lies below the graph near , and its value is an underestimate.
If near , everything flips: the graph is concave down, the line lies above it, and its value is an overestimate.
The picture at the top shows the first case: has second derivative , and the curve sits above its tangent line on both sides of 0.
This is a local statement: it holds for inputs in an interval around where the sign of does not change. If changes sign between and your input, its sign at alone does not settle it.
Quick check · Decide and justify
No calculator. Let . Its tangent line at is , which gives 0.5 as an approximation of . A classmate says 0.5 is an overestimate of . Is the classmate right?
Which reason supports your answer?
Part 3 Watch it done A square root by hand
Open each step in turn, then do the last one yourself.
Use a tangent line to to approximate , and say whether the approximation is an overestimate or an underestimate.
Step 1 · Pick the point of tangency
Use . It is close to 26, and is exact.
Why this step?
Why not use , the input you actually want?
The line at needs , the very number you are trying to find. The point of tangency has to be an input where and are known exactly, and 25 is the nearest such input.
Step 2 · Find the slope
, so .
Step 3 · Write the tangent line
.
Step 4 · Evaluate at 26
, so .
Step 5 · Decide over or under
, which is negative for every . The graph of is concave down, so it lies below its tangent line, and 5.1 is an overestimate of .
Your step · Calculate
No calculator. Finish it. Use the same tangent line, , to approximate . Give an exact decimal.
Part 4 Try it A draining tank and a cube root
Try it · Calculate
No calculator. Water drains from a tank. The tank holds gallons minutes after noon, where is differentiable, with and . Use the line tangent to the graph of at to estimate the time , in minutes after noon, at which the tank holds 322 gallons.
Try it · Spot the error
No calculator. A student uses a tangent line to approximate , with and . Tap the first line with a mistake.
Try it · Multiple choice
No calculator. You want to approximate by hand with a line tangent to the graph of . Which tangent line should you use?
Part 5 Explain it Write it as on the exam
Free response on the exam is written by hand, so work this on paper. Nothing you type here leaves the page. Then open the model answer and score yourself against each point.
Free response is 50% of the exam score. This one is shaped like Question 6, from free-response Part B (calculator not permitted).
Free-response practice · Question 6 style
No calculator. A bowl of soup is served and begins to cool. Its temperature, in degrees Fahrenheit, minutes after it is served is , where is twice differentiable. It is known that , , and for .
(a) Write an equation for the line tangent to the graph of at .
(b) Use the tangent line from part (a) to approximate . Show the work that leads to your answer, and give units.
(c) Is the approximation in part (b) an overestimate or an underestimate of ? Justify your answer.
Model answer
(a) .
(b) degrees Fahrenheit.
(c) An underestimate. for , an interval containing both 10 and 12, so the graph of is concave up there and lies above its tangent line at . So .
Score your own answer. This is a self-check, not a grade. Tick each point your answer makes.
Part 6 Check yourself A hike up a ridge
Both case questions use the table and the fact above it.
A hiker climbs a ridge. Her elevation is meters above sea level hours after she starts, where is twice differentiable. Some values of and are in the table, and for .
| (hours) | (meters) | (meters per hour) |
|---|---|---|
| 0 | 1200 | 300 |
| 1 | 1450 | 200 |
| 2 | 1620 | 120 |
| 3 | 1700 | 40 |
Case question 1 · Calculate
No calculator. Use the line tangent to the graph of at to approximate the hiker's elevation, in meters, at hours.
Case question 2 · Multiple choice
No calculator. Which statement about the approximation of from the line tangent to the graph of at is true?
The rest stand on their own and do not use the case.
Check yourself · Sort it
No calculator. In each case, the line tangent to the graph of the function at the given point is used to approximate the function at the given input. Sort each approximation.
Underestimate
Overestimate
Check yourself · Decide and justify
No calculator. The line tangent to the graph of at is . A classmate says this line approximates and equally well. Is the classmate right?
Which reason supports your answer?
Part 7 Keep it Pull back two earlier ideas
This lesson leaned on the second derivative from Unit 3 and on the derivative of from Unit 2. Recalling them now is what keeps them.
Bring it back · Calculate
No calculator. Let . Find . Give an exact decimal.
Bring it back · Multiple choice
No calculator. What is ?
In three lines
- The tangent line at , , approximates for inputs near .
- Choose a point of tangency where and are known exactly, close to the input you want.
- If between the point and the input, the line gives an underestimate; if , an overestimate.
Exam strategy for this topic
- Section I Part A, Multiple Choice (calculator not permitted): 29 questions in 62 minutes.
- Section I Part B, Multiple Choice (graphing calculator required): 13 questions in 38 minutes.
- Section II Part A, Free Response (graphing calculator required): 2 questions in 30 minutes.
- Section II Part B, Free Response (calculator not permitted): 4 questions in 60 minutes.
Write the tangent line in point-slope form with the point named, , before you substitute; there is no need to simplify it, and leaving it in that form shows where each number came from. When a question asks whether an estimate is too high or too low, state the sign of on an interval containing both inputs and what that means for the graph and its tangent line, and only then give your answer.
Questions students ask
Why approximate when I could just evaluate the function?
Often you cannot. The function may be known only from a table or a rate, as with the phone battery, or its value, such as , cannot be found exactly by hand. The tangent line needs only and .
How close to the point of tangency is close enough?
There is no fixed distance. It depends on how sharply the graph bends. For with the tangent line at 1, the estimate was off by about 0.016 at 1.05 and by about 2.06 at 1.5.
Is a linearization the same thing as a tangent line approximation?
Yes. The tangent line is the graph of the linearization, and its value at an input is the tangent line approximation there.
What if the second derivative is 0 near the point?
If on a whole interval, is linear there, the tangent line is the graph itself, and the estimate is exact on that interval. If is 0 only at the point and changes sign there, as for at 0, the line can be below the graph on one side and above it on the other.
What reason should I give for over or under?
Use the information you were given. A clear reason says that is positive (or negative) on an interval containing the point of tangency and the input, so the graph lies above (or below) its tangent line there.
Course alignment, for teachers
AP Calculus AB topic 4.6, Unit 4: Contextual Applications of Differentiation.
- Skill 1.F: Explain how an approximated value relates to the actual value.
This lesson maps all 2 essential knowledge statements of the topic to the part that teaches each one: 2 are checked by a scored question. The map is in the lesson file.