Unit 6 · Topic 6.1 · about 30 minutes · 7 parts · 13 scored checks, 3 of them multiple choice
AP Calculus AB 6.1: Exploring Accumulations of Change
Unit 6: 15 to 20% of the multiple-choice section
What you'll be able to do
- Interpret the area between the graph of a rate of change and the horizontal axis as the accumulated change in a quantity, with correct units, in context.
Key vocabulary
| Term | What it means | The exam trap |
|---|---|---|
| Rate of change function | A function whose output tells how fast a quantity is changing per unit of its input, such as liters per minute. | A value of a rate function is a rate at one input, not an amount; check the units before you give it as an answer. |
| Accumulation of change | The total change in a quantity over an interval, built up from its rate of change. | It is a change, not an ending amount. To get the amount at the end, add the change to the amount at the start. |
| Region between a graph and the x-axis | The region bounded by the graph of a function, the horizontal axis and the vertical lines at the two ends of an interval. | Read both ends of the interval from the question before you measure; a region that starts late or stops early gives a different change. |
 Tap to open the picture full size
Part 1 Think first How much water is in the tank?
Commit to a guess before you read on. Even a wrong guess makes the answer easier to keep.
Predict first
A hose starts filling an empty tank. The flow begins at 0 liters per minute and rises steadily, so that 4 minutes later water is pouring in at 6 liters per minute. How much water is in the tank after those 4 minutes?
In short. The area of the region between the graph of a rate of change and the horizontal axis over an interval gives the accumulated change in the quantity over that interval.
- When the graph is made of line segments or pieces of a circle, geometry gives the area.
- Where the rate is positive the accumulated change is positive, and where it is negative the accumulated change is negative.
- The unit of the area is the unit of the rate multiplied by the unit of the input.
Part 2 Learn it Three ideas, each checked as you go
2a. The area under a rate graph is the change
If water flows into a tank at a constant 5 liters per minute for 3 minutes, 15 liters come in: rate times time. Graph that rate against time and you get a horizontal line at height 5. The rectangle between that line and the time axis, from 0 to 3, has height 5 and width 3, so its area is 15. The area is the amount that came in.
The same holds when the rate changes. The area of the region between the graph of a rate of change and the horizontal axis over an interval gives the accumulation of change: how much the quantity changed over that interval. You can think of a changing rate as many short stretches where it is nearly constant, each adding a thin rectangle of area.
The units come from that same multiplication. The height of the graph is a rate, in liters per minute, and the width is a time, in minutes, so the area is in (liters per minute)(minutes), which is liters. The unit of the area is the unit of the rate multiplied by the unit of the input.
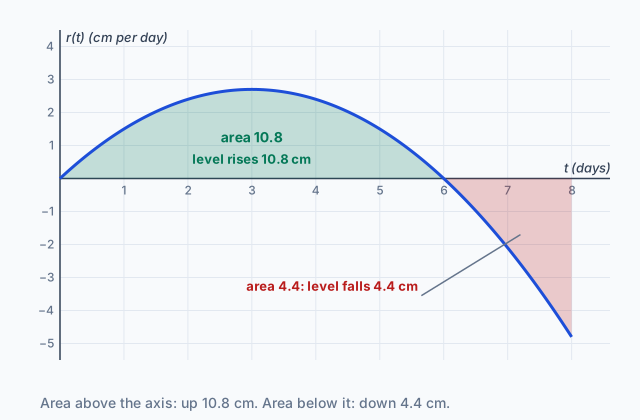
In the graph at the top, is in centimeters per day and is in days. The region above the axis from day 0 to day 6 has area 10.8, so the pond's water level rose 10.8 centimeters over those 6 days.
Quick check · Match
No calculator. Each rate is graphed against its input. Tap a rate, then what the area between its graph and the horizontal axis gives.
2b. When geometry gives the area
Finding an area exactly can take calculus you have not met yet. But in some cases geometry is enough. When the graph of the rate is made of line segments, or pieces of a circle, the region splits into shapes whose areas you already know:
- a rectangle: base times height;
- a triangle: times base times height;
- a trapezoid: , the average of the two parallel sides times the width;
- a quarter circle of radius : .
A cyclist speeds up steadily from 4 meters per second to 10 meters per second over 6 seconds. The velocity graph is the segment from to , and the region under it is a trapezoid with parallel sides 4 and 10 and width 6:
The cyclist travels 42 meters. Using the final speed for the whole time, , adds a triangle above the graph that the cyclist never covered.
When the region has several pieces, split the interval where the graph bends, find each piece's area, and combine them.
Quick check · Calculate
No calculator. During a storm, the depth of snow on a deck increases at a rate of centimeters per hour, for , with in hours. By how many centimeters does the depth of the snow increase over those 4 hours?
2c. Below the axis, the change is negative
A rate of change can be negative, and then the quantity is going down. So if a rate of change is positive over an interval, the accumulated change is positive, and if it is negative, the accumulated change is negative.
A region below the horizontal axis still has an area, which is a positive number, but it stands for a loss. Give it a minus sign when you combine it with other pieces.
In the graph at the top, the rate of change of the pond's level is positive for the first 6 days and negative for the next 2. The region above the axis has area 10.8 and the region below has area 4.4, so over the 8 days the level changes by
a rise of 6.4 centimeters. Adding the areas, , answers a different question: how far the level moved up and down in all, not where it ended up.
Watch the difference between a rate that is falling and a rate that is negative. A rate whose graph drops but stays above the axis still adds to the quantity, only more slowly.
Quick check · Multiple choice
No calculator. The volume of water in a tank changes at a rate of liters per minute, with in minutes. The graph of is above the -axis for , where the region between the graph and the axis has area 18, and below the axis for , where that region has area 25. What is the change in the volume of water from to ?
Part 3 Watch it done An amount from a rate graph made of segments
Watch each step, then do the last one yourself.
Water is pumped into a storage tank at a rate of gallons per hour, with in hours. The graph of is made of line segments joining , , and . How many gallons of water are pumped into the tank from to ?
Step 1 · Say what the area means
for , so the water pumped in is the area of the region between the graph of and the -axis from to . Its unit is (gallons per hour)(hours), which is gallons.
Step 2 · Split the region at the corners
The corners at and cut the region into a trapezoid on , a rectangle on and a triangle on .
Step 3 · The trapezoid on $[0, 3]$
Its parallel sides are and , and its width is 3, so its area is gallons.
Why this step?
Why is the trapezoid's area a number of gallons and not gallons per hour?
Its heights are rates, in gallons per hour, and its width is a time, in hours. Multiplying them cancels the hours, so the area is an amount of water: 15 gallons came in during the first 3 hours.
Step 4 · The rectangle on $[3, 5]$
Its height is 8 and its width is 2, so its area is gallons.
Your step · Calculate
No calculator. Finish it. The last piece is the triangle on , with height . How many gallons of water are pumped into the tank from to ?
Part 4 Try it A curved rate, then a claim to judge
Try it · Calculate
Graphing calculator required. A jogger's velocity is meters per second for , with in seconds, and the whole time. How many meters does the jogger travel from to ? Give your answer to three decimal places.
Try it · Decide and justify
No calculator. The number of fish in a pond changes at a rate of fish per week, with in weeks. A classmate says there were fewer fish at than at . Is the classmate right?
Which reason supports your answer?
Part 5 Explain it Answer it on paper, then score it
Free response is handwritten on the exam, so write your answer on paper first. Nothing you type here leaves this page. Then open the model answer and score yourself on each point.
Free response is 50% of the exam score. This one is shaped like Question 1, from free-response Part A (graphing calculator required).
Free-response practice · Question 1 style
Graphing calculator required. The volume of water in a reservoir changes at a rate of thousand cubic meters per day, where is measured in days and . Use radian mode.
(a) for . Using correct units, interpret the meaning of the area of the region between the graph of and the -axis over in the context of the problem.
(b) Find the area described in part (a). Show the setup you use on your calculator, and give your answer to three decimal places.
(c) Is the change in the volume of water from to positive or negative? Justify your answer.
Model answer
(a) The area is the number of thousand cubic meters by which the volume of water in the reservoir increased over the first 10 days, from to .
(b) The area is under the graph of from to : thousand cubic meters.
(c) Negative. On the calculator, at and , and between them, so for every in . A rate of change that is negative over an interval gives a negative accumulated change, so the volume of water decreased from to . (The calculator also gives the signed area directly: , which is negative.)
Score your own answer. This is a self-check, not a grade. Tick each point your answer makes.
Part 6 Check yourself An elevator ride
The first three questions use the same table. Answer them from it.
An elevator moves up and down a shaft. Its velocity is meters per second, seconds after it starts, and a positive velocity means the elevator is moving up. The graph of consists of line segments joining the points in the table.
| (seconds) | (meters per second) |
|---|---|
| 0 | 0 |
| 2 | 3 |
| 6 | 3 |
| 8 | 0 |
| 10 | -2 |
| 12 | 0 |
Case question 1 · Calculate
No calculator. How many meters does the elevator rise from to ?
Case question 2 · Multiple choice
No calculator. What is the change in the elevator's position from to ?
Case question 3 · Fill the statement
No calculator. Tap a blank, then tap an answer.
From to , the area of the region between the graph of and the -axis is measured in , and the elevator's change in position over that time is .
The rest stand on their own and do not use the case.
Check yourself · Spot the error
No calculator. The volume of water in a tank changes at a rate of liters per minute for , with in minutes. A student finds the change in the volume over that time. Tap the first line with a mistake.
Check yourself · Sort it
No calculator. Tap a situation, then the sign of the accumulated change over the interval it describes.
Positive
Negative
Cannot tell
Part 7 Keep it Bring back earlier ideas
This lesson turns two earlier ideas around: the sign of a rate and the unit of a rate. Recalling them now is what makes them last.
Bring it back · Multiple choice
No calculator. The derivative of a function is . On which interval is decreasing?
Bring it back · Fill the statement
No calculator. Tap a blank, then tap an answer.
A town has people years after 2020, and . So in 2023 the population is at a rate of 250 .
In three lines
- The area between the graph of a rate of change and the horizontal axis over an interval gives the accumulated change over that interval.
- Area above the axis is a positive change and area below it a negative change, and geometry gives the area when the graph is made of simple shapes.
- The unit of the area is the unit of the rate times the unit of the input.
Exam strategy for this topic
- Section I Part A, Multiple Choice (calculator not permitted): 29 questions in 62 minutes.
- Section I Part B, Multiple Choice (graphing calculator required): 13 questions in 38 minutes.
- Section II Part A, Free Response (graphing calculator required): 2 questions in 30 minutes.
- Section II Part B, Free Response (calculator not permitted): 4 questions in 60 minutes.
When a question asks what an area under a rate graph means, answer in a sentence that names the quantity, the interval and the units, such as the number of gallons pumped into the tank from to hours. When a calculator finds the area, write the definite integral you entered, with its integrand, both limits and the differential, before the number.
Questions students ask
Why is the area under a rate graph an amount and not a rate?
Because it is a height times a width. The height is a rate, such as gallons per hour, and the width is an amount of the input, such as hours, so the product is gallons.
Is the area in square units?
Not on a rate graph. Its unit is the rate's unit times the input's unit, such as (meters per second)(seconds), which is meters. Square units come up only when both axes measure length.
What if part of the graph is below the axis?
There the rate is negative and the quantity is going down, so that region stands for a negative change. Give each region its sign, then combine them.
What if the graph is curved and no shape fits?
Then geometry cannot give the exact area. A graphing calculator can, and Topic 6.2 shows how to estimate it by hand with rectangles and trapezoids.
Is the area under a rate graph the amount at the end?
Only when the amount started at 0. The area is the change; add it to the starting amount to get the amount at the end.
Course alignment, for teachers
AP Calculus AB topic 6.1, Unit 6: Integration and Accumulation of Change.
- Skill 4.B: Use appropriate units of measure.
This lesson maps all 4 essential knowledge statements of the topic to the part that teaches each one: 4 are checked by a scored question. The map is in the lesson file.