Unit 6 · Topic 6.2 · about 30 minutes · 7 parts · 13 scored checks, 3 of them multiple choice
AP Calculus AB 6.2: Approximating Areas with Riemann Sums
Unit 6: 15 to 20% of the multiple-choice section
What you'll be able to do
- Approximate a definite integral with left, right and midpoint Riemann sums and trapezoidal sums, from a table, a formula or a description, on equal or unequal subintervals, and tell when an approximation must be too high or too low.
Key vocabulary
| Term | What it means | The exam trap |
|---|---|---|
| Riemann sum | A sum of products, each a value of the function at a point in a subinterval times the width of that subinterval, used to approximate a definite integral. | Every term needs its width; a sum of heights alone is not an area. |
| Left, right and midpoint Riemann sums | Riemann sums whose heights are taken at the left end, the right end or the middle of each subinterval. | Left and right name the ends of each subinterval, not the ends of the whole interval. |
| Trapezoidal sum | An approximation that replaces each rectangle with a trapezoid whose area is the width times the average of the function's values at the two ends of the subinterval. | It needs the function's value at both ends of every subinterval, so check that the data gives them. |
| Partition (uniform or nonuniform) | The points that cut an interval into subintervals: uniform when the subintervals all have the same width, nonuniform when they do not. | In a table the inputs decide the widths, so read them before any arithmetic. |
| Definite integral, | The exact accumulated change of a rate from to , the value a Riemann or trapezoidal sum approximates. | A sum gives an approximation, so write between the integral and its estimate, not . |
| Underestimate and overestimate | An approximation is an underestimate if it is less than the exact value of the integral and an overestimate if it is greater. | Name the behavior of the function that decides it; the type of sum alone does not. |
 Tap to open the picture full size
Part 1 Think first How far did the car go?
Commit to an answer first. The lesson starts from your guess, right or wrong.
Predict first
A car starts from a stop at the bottom of an on-ramp. Its speed is read every 10 seconds: 0, 12, 20 and 24 meters per second at , 10, 20 and 30 seconds. The speed rose the whole time, and nothing else about it is known. About how far did the car travel in those 30 seconds?
In short. A Riemann sum approximates a definite integral by cutting the interval into subintervals and adding width times height over every one of them.
- Left, right and midpoint sums take each rectangle's height at the left end, the right end or the middle of its subinterval; a trapezoidal sum averages the heights at both ends.
- When the subintervals have different widths, as they often do in a table, each product uses its own width.
- How the function behaves on the interval, rising or falling for left and right sums and bending up or down for trapezoids, can show whether an approximation is too high or too low.
Part 2 Learn it Building an approximation, one idea at a time
2a. Rectangles: left, right and midpoint sums
In the last lesson the area under a rate graph gave an accumulated change, found with geometry. Most graphs are curved, so you approximate instead. The exact value is the definite integral of from to , written ; the next lesson defines it fully.
A Riemann sum approximates it with rectangles. Cut into subintervals at a list of points called a partition. Over each subinterval stand a rectangle whose width is the subinterval's length and whose height is a value of in it. Then add the areas, each one width times height.
- A left Riemann sum takes each height at the left end of its subinterval.
- A right Riemann sum takes it at the right end.
- A midpoint Riemann sum takes it at the middle.
Take on with three subintervals of width 1. The left sum is , the right sum is , and the midpoint sum, with heights at 0.5, 1.5 and 2.5, is . Three rules, three different estimates of one integral.
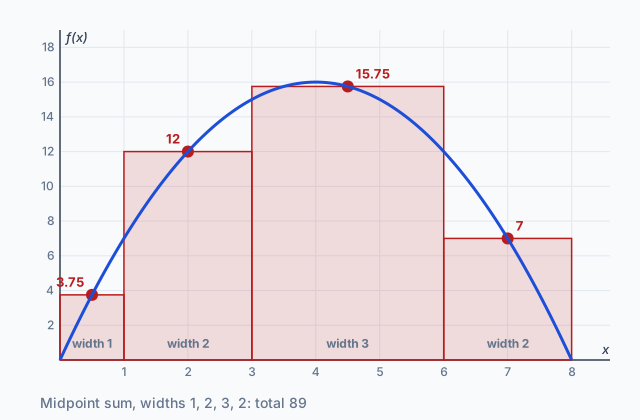
The picture at the top reads a midpoint sum off a graph: each dot is the height at the middle of a subinterval.
Quick check · Calculate
No calculator. Let . Use a midpoint Riemann sum with two subintervals of equal length to approximate .
2b. Tables and uneven widths
A Riemann sum needs only widths and heights. So you can approximate an integral when is given numerically, by a table, or described in words, not only when you have a formula or a graph. With a table the work is arithmetic you can do by hand; a calculator would only speed up the same sums.
A table's inputs set the partition. When they are evenly spaced the partition is uniform. When they are not, it is nonuniform, and every rectangle takes its own width.
A cart rolls along a track with velocity meters per second:
| (seconds) | (meters per second) |
|---|---|
| 0 | 4 |
| 1 | 7 |
| 3 | 9 |
| 6 | 8 |
The widths are 1, 2 and 3 seconds. The left sum is meters, and the right sum is meters. Giving every piece width 2, because three subintervals share 6 seconds, would misread this table.
A midpoint sum from a table needs the value at the middle of each subinterval, so it works only when the table lists those inputs. With readings at , 2, 4, 6 and 8, a midpoint sum on and uses the readings at 2 and 6, each times width 4.
Quick check · Calculate
No calculator. A function has , , , and . Use a right Riemann sum with the subintervals , , and to approximate .
2c. Trapezoids
A trapezoidal sum replaces each rectangle with a trapezoid. Its top is the segment joining the function's values at the two ends of the subinterval, so each piece has area
For the cart table above, the pieces are , and , so the trapezoidal sum is 47 meters.
That 47 is the average of the left sum, 45, and the right sum, 49. On the same partition it always is, because each trapezoid's area is the average of the left and right rectangles on its subinterval. That makes a handy check on your arithmetic.
Two slips come up again and again. One drops the , which doubles every piece. The other multiplies by the input at the end of a subinterval instead of its width; with uneven gaps those are different numbers.
Quick check · Multiple choice
No calculator. A function has , , and . Which expression is the trapezoidal sum approximation of with the subintervals , and ?
2d. Too high or too low?
Without the exact value you can sometimes still say which side of it an approximation lands on. The behavior of decides.
- Left and right sums: increasing or decreasing. If is increasing on , its smallest value on each subinterval is at the left end, so every left rectangle lies under the graph and the left sum is an underestimate. Every right rectangle reaches above the graph, so the right sum is an overestimate. If is decreasing, the two switch.
- Trapezoidal sums: concavity. If the graph is concave up, the segment joining two of its points lies above the curve between them, so each trapezoid holds a little extra and the sum is an overestimate. If it is concave down, the segments lie below the curve and the trapezoidal sum is an underestimate.
- Mixed behavior. If rises on part of the interval and falls on another, a left or right sum errs in both directions at once, and from that alone you cannot say which way the total misses. A trapezoidal sum is the same when the concavity changes or is unknown.
The behavior can come from a graph, from the sign of or , or from a sentence that describes .
Quick check · Decide and justify
No calculator. A function is decreasing on . A classmate says a right Riemann sum with three subintervals of equal length gives an underestimate of . Is the classmate right?
Which reason supports your answer?
Part 3 Watch it done A trapezoidal sum from a table
Open the steps one at a time, then do the last one yourself.
Water is pumped into a tank at a rate of liters per minute, where is in minutes. The readings are , , and . Use a trapezoidal sum with the three subintervals given by these times to approximate , and say what it means.
Step 1 · Read off the subintervals and widths
The times cut into , and , with widths 4, 2 and 6 minutes. The partition is nonuniform, so each piece keeps its own width.
Step 2 · Build the first two trapezoids
and . Each is in liters: liters per minute times minutes.
Why this step?
Why does each piece use the average of two rates instead of just one of them?
Over the rate starts at 20 and ends at 26. A left or right rectangle would use one of those for all 4 minutes. The trapezoid's top joins the two readings, so its area is the width times their average, and it uses both readings the table gives for that subinterval.
Your step · Calculate
No calculator. Finish it. The first two trapezoids give 92 and 56 liters. Build the third, on , and add all three. What is the trapezoidal sum, in liters?
Part 4 Try it A draining tub, then a sorting job
Try it · Calculate
No calculator. A bathtub drains at a rate of liters per minute, where is in minutes. The readings are , , , and . Use a left Riemann sum with the four subintervals given by these times to approximate the number of liters that drain out from to .
Try it · Sort it
No calculator. Each card names an approximation of a definite integral and what is known about the function. Tap a card, then whether the approximation must be an underestimate, must be an overestimate, or cannot be decided from that information.
Underestimate
Overestimate
Cannot tell
Part 5 Explain it Write it as a free-response answer
Free response is handwritten on the exam, so write your answer on paper first. Nothing you type here leaves this page. Then open the model answer and score yourself on each point.
Free response is 50% of the exam score. This one is shaped like Question 3, from free-response Part B (calculator not permitted).
Free-response practice · Question 3 style
No calculator. Rainwater runs off a roof into a storage tank. The rate at which water enters the tank is modeled by a differentiable, increasing function , where is measured in gallons per hour and is measured in hours. Selected values are , , , and .
(a) Use a right Riemann sum with the four subintervals indicated by the data to approximate . Show the computations that lead to your answer. Using correct units, explain the meaning of in the context of the problem.
(b) Use a trapezoidal sum with the same four subintervals to approximate . Show the computations that lead to your answer.
(c) Is the approximation in part (a) an overestimate or an underestimate of ? Justify your answer.
Model answer
(a) gallons. is the total amount of rainwater, in gallons, that entered the tank from to hours.
(b) gallons.
(c) Overestimate. is increasing, so on each subinterval the value at the right end is the largest value of there, and each rectangle reaches above the graph of .
Score your own answer. This is a self-check, not a grade. Tick each point your answer makes.
Part 6 Check yourself Sand on a pile
Answer both case questions from the sentence and the table.
Sand is poured onto a pile at a rate of kilograms per minute, where is in minutes. is increasing, and its graph is concave down for . Selected values are in the table.
| (minutes) | (kilograms per minute) |
|---|---|
| 0 | 10 |
| 2 | 14 |
| 4 | 17 |
| 6 | 19 |
| 8 | 20 |
Case question 1 · Calculate
No calculator. Use a midpoint Riemann sum with two subintervals of equal length to approximate , the kilograms of sand poured in the first 8 minutes.
Case question 2 · Multiple choice
No calculator. With the four subintervals in the table, the left Riemann sum for is 120, the right Riemann sum is 140 and the trapezoidal sum is 130. Which must be true of ?
The rest stand on their own and do not use the case.
Check yourself · Spot the error
No calculator. A function has , , and . A student approximates with a trapezoidal sum on the subintervals these inputs give. Tap the first line with a mistake.
Check yourself · Match
No calculator. Let . Each sum approximates with two subintervals of equal length. Tap a sum, then its value.
Part 7 Keep it Bring back earlier ideas
Riemann sums stand on area as accumulated change, from the last lesson, and they share an idea with tangent line approximations: knowing the shape of a function can tell you which way an estimate errs.
Bring it back · Multiple choice
No calculator. Water flows into a tank at a positive rate of gallons per hour, where is in hours. What does the area of the region between the graph of and the -axis from to give?
Bring it back · Calculate
No calculator. A differentiable function has and . Use the line tangent to the graph of at to approximate .
In three lines
- A Riemann sum adds width times height over the subintervals of a partition, with heights from left ends, right ends or midpoints.
- A trapezoidal sum averages the two end heights on each subinterval, and with uneven widths every piece keeps its own width.
- Increasing or decreasing can show whether a left or right sum is too low or too high, and concavity can show it for a trapezoidal sum.
Exam strategy for this topic
- Section I Part A, Multiple Choice (calculator not permitted): 29 questions in 62 minutes.
- Section I Part B, Multiple Choice (graphing calculator required): 13 questions in 38 minutes.
- Section II Part A, Free Response (graphing calculator required): 2 questions in 30 minutes.
- Section II Part B, Free Response (calculator not permitted): 4 questions in 60 minutes.
When you approximate from a table, write every product, width times height, before you add, as in , so a reader can see which subintervals and heights you used, and give units. When you call an approximation an overestimate or an underestimate, name the behavior that decides it: increasing or decreasing for a left or right sum, concave up or down for a trapezoidal sum.
Questions students ask
Do the subintervals in a Riemann sum have to be the same width?
No. A partition can be uniform or nonuniform. Tables often have uneven gaps, and then each rectangle or trapezoid uses the width of its own subinterval.
Which kind of sum is the most accurate?
No one kind wins for every function. How far each misses depends on how the function behaves on each subinterval. For a function that only increases or only decreases, though, the left and right sums trap the integral between them.
Can a midpoint sum be shown to be too high or too low?
Yes, and concavity decides it, the opposite way from trapezoids: on a graph that is concave up a midpoint sum is an underestimate, and on one that is concave down it is an overestimate.
Do I need a calculator for a Riemann sum?
No. A sum from a table, or from a few values of a formula, is arithmetic, and definite integrals can be approximated with or without technology. Where a calculator is allowed it can do the same arithmetic faster.
What happens if the function is negative on part of the interval?
Then the products on those subintervals are negative, and the sum counts them as negative, just as the definite integral counts area below the axis as negative.
Course alignment, for teachers
AP Calculus AB topic 6.2, Unit 6: Integration and Accumulation of Change.
- Skill 1.F: Explain how an approximated value relates to the actual value.
This lesson maps all 4 essential knowledge statements of the topic to the part that teaches each one: 4 are checked by a scored question. The map is in the lesson file.