Unit 6 · Topic 6.5 · about 30 minutes · 7 parts · 13 scored checks, 4 of them multiple choice
AP Calculus AB 6.5: Interpreting the Behavior of Accumulation Functions Involving Area
Unit 6: 15 to 20% of the multiple-choice section
What you'll be able to do
- Represent an accumulation function as a definite integral, , and use a graph, a table, a formula or a description of to find values of and to describe where increases, decreases, has extreme values and bends.
Key vocabulary
| Term | What it means | The exam trap |
|---|---|---|
| Accumulation function | A function defined by a definite integral with a variable upper limit, . | and are different numbers; say which one a question is asking about before you read the graph. |
| Definite integral | , which for a graph made of lines and circles is the area between the graph and the -axis from to , counted with signs. | Before you add pieces of area, check which side of the axis each piece is on. |
| Graphical, numerical, analytical and verbal representations | A function given by a graph, a table of values, a formula, or a description in words. | Each one carries the same kind of facts about the accumulation function; work from the one you are given rather than looking for a formula. |
 Tap to open the picture full size
Part 1 Think first When is the rain barrel fullest?
Commit to a guess before you read on. Trying first, even when the guess is wrong, makes the lesson easier to remember.
Predict first
Water runs into a rain barrel from a gutter. At noon the flow is 0 gallons per hour. It climbs steadily to 6 gallons per hour at 2 p.m., then slows steadily to 0 at 5 p.m. At 5 p.m. someone opens the tap, and from then until 7 p.m. water leaves the barrel at a steadily growing rate, reaching 4 gallons per hour going out at 7 p.m. At what time between noon and 7 p.m. does the barrel hold the most water?
In short. An accumulation function keeps a running total of the signed area between the graph of and the axis from to , so any graph, table, formula or description of tells you about .
- , and for each value is the area above the axis minus the area below it, from to .
- When is continuous, , so the sign of says where increases or decreases.
- Whether is increasing or decreasing says where the graph of is concave up or concave down.
Part 2 Learn it Reading g from f
2a. A running total of signed area
Pick a starting input , and for each let
The number is the area between the graph of and the -axis from to , counted as positive where the graph is above the axis and negative where it is below. For now, take to the right of ; 6.6 shows what changes when is to the left. The letter is only the variable of integration; is where the total stops. Such a function is an accumulation function; in Think first it was the water gained since noon.
At no area has been collected yet, so .
When the graph of is made of lines and circles, geometry gives every area: a triangle is , and a half circle of radius is . A formula can hide a circle, too: is the top half of a circle of radius centered at the origin.
For example, let the graph of run level from to and then straight down to , crossing the axis at , and let . The rectangle from 0 to 2 gives . The triangle above the axis from 2 to 3.5 adds 2.25, so . The triangle below the axis from 3.5 to 5 subtracts 2.25, so .
Quick check · Calculate
No calculator. The graph of is made of two line segments: one from to and one from to . Let . What is ?
2b. The sign of f says where g rises and falls
By the Fundamental Theorem of Calculus from the last topic, when is continuous, . So a graph of is a graph of , and what Unit 5 says about a derivative applies to :
- where , is increasing, and where , is decreasing;
- where changes from positive to negative, has a relative maximum, and where changes from negative to positive, has a relative minimum.
The height of says how fast is growing, not how large is. In the example from the last section, is at its highest on , yet keeps growing past , all the way to , where crosses from positive to negative. That is where has its relative maximum, .
For an absolute maximum or minimum on a closed interval, use the Candidates Test: compare at those points with at both endpoints.
Quick check · Decide and justify
No calculator. Let for . A classmate says has a relative maximum at . Is the classmate right?
Which reason supports your answer?
2c. Whether f rises or falls says how g bends
Concavity comes from the derivative. The graph of is concave up where is increasing and concave down where is decreasing. So for concavity, read whether the graph of is going up or down, not which side of the axis it is on. A point of inflection of sits where changes from increasing to decreasing, or the other way, which on a graph of is a peak or a valley.
A table works the same way. Suppose the graph of is made of segments joining these points:
| 0 | 1 | 2 | 3 | 4 | |
|---|---|---|---|---|---|
| 1 | 3 | 4 | 3 | 0 |
Every value before is positive, so increases on . The values climb to 2 and then fall, so the graph of is concave up on , concave down on , and has a point of inflection at .
Words carry the same facts. If a pump's rate is positive but falling, the total pumped still goes up, just more slowly each minute: increasing and concave down.
Quick check · Match
No calculator. Let , where is continuous. Tap a fact about , then the fact about it gives.
Part 3 Watch it done The smallest value of an accumulation function
Watch each step, then finish the last one yourself.
Let for . Find the absolute minimum value of on .
Step 1 · Find the derivative
The integrand is continuous, so . It is 0 only at .
Step 2 · Read the sign
on and on . So rises and then falls, and its only critical point, , is a relative maximum.
Why this step?
Why must the absolute minimum be at an endpoint?
On a closed interval, a continuous function takes its absolute minimum at a critical point or at an endpoint. The only critical point here is a maximum, so the minimum has to be at or at .
Step 3 · Find the areas
. From 0 to 2 the line is above the axis, a triangle of area . From 2 to 5 it is below the axis, a triangle of area .
Your step · Calculate
No calculator. Finish it. For , , the region from 0 to 2 has area 2 above the axis, and the region from 2 to 5 has area 4.5 below the axis. What is the absolute minimum value of on ?
Part 4 Try it A circle and a sketch
Try it · Multiple choice
No calculator. Let for . What is ?
Try it · Sketch the graph
No calculator. Let , and let for . Sketch the shape of the graph of : drag the points so it rises or falls, and bends, the way does. The first point is fixed at . The exact heights are up to you.
One shape that fits
Drag a point up or down, or tap it and use the arrow keys. Only the shape is checked.
Part 5 Explain it From the graph of f to the behavior of g
Free response is written by hand on the exam, so answer on paper first. Nothing you type here is sent anywhere. Then open the model answer and score yourself one point at a time.
Free response is 50% of the exam score. This one is shaped like Question 6, from free-response Part B (calculator not permitted).
Free-response practice · Question 6 style
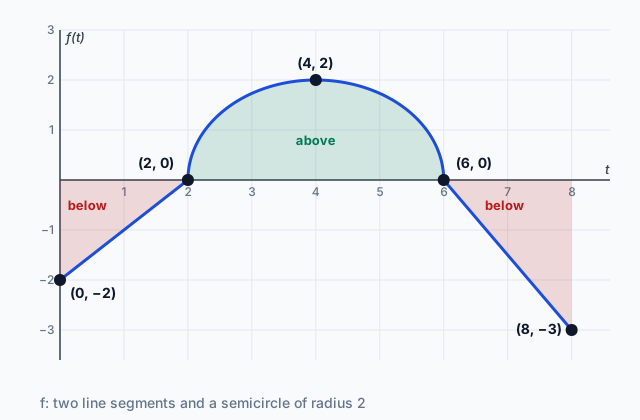
No calculator. The graph of the continuous function at the top of this lesson is made of a line segment from to , a semicircle above the -axis from to , and a line segment from to . Let for .
(a) Find and .
(b) Find the -coordinate of each point at which has a relative maximum on the interval . Justify your answer.
(c) Find the open intervals on which the graph of is concave down. Give a reason for your answer.
(d) Water flows into and out of a tank, and is the rate of flow in liters per minute, minutes after noon, with positive values meaning water flows in. Using correct units, interpret the meaning of in the context of the problem.
Model answer
(a) .
.
(b) . changes from positive to negative only at , so has a relative maximum at . (At , changes from negative to positive, which gives a relative minimum.)
(c) is decreasing on , so the graph of is concave down on .
(d) , about 1.28 liters, is the net change in the water in the tank from noon to 12:08 p.m.: the tank holds liters more water at than at .
Score your own answer. This is a self-check, not a grade. Tick each point your answer makes.
Part 6 Check yourself A function given by a table
All three case questions use the same table. Answer them from it.
The graph of a continuous function is made of line segments joining the points in the table. Let for .
| 0 | 1 | 2 | 3 | 4 | 5 | 6 | |
|---|---|---|---|---|---|---|---|
| 0 | 3 | 4 | 1 | 0 |
Case question 1 · Calculate
No calculator. What is ?
Case question 2 · Multiple choice
No calculator. Which open interval is the full set of in where the graph of is concave down?
Case question 3 · Multiple choice
No calculator. At which value of does attain its absolute maximum on the interval ?
The rest stand on their own and do not use the case.
Check yourself · Spot the error
No calculator. A student finds where the graph of is concave up on . Tap the first line with a mistake.
Check yourself · Fill the statement
No calculator. Tap a blank, then tap an answer.
Let . Then . On any interval where the graph of is below the -axis, is .
Part 7 Keep it Bring back earlier ideas
Two questions from earlier topics, so they stay fresh.
Bring it back · Calculate
No calculator. Water flows into a tank at liters per hour, where is in hours. Measurements give , , and . Using a right Riemann sum with the three subintervals these values mark, estimate , in liters.
Bring it back · Multiple choice
No calculator. If , what is ?
In three lines
- is the signed area from to , so and geometry gives its values.
- , so the sign of gives where rises, falls and has relative extrema.
- Whether increases or decreases gives where the graph of is concave up or down.
Exam strategy for this topic
- Section I Part A, Multiple Choice (calculator not permitted): 29 questions in 62 minutes.
- Section I Part B, Multiple Choice (graphing calculator required): 13 questions in 38 minutes.
- Section II Part A, Free Response (graphing calculator required): 2 questions in 30 minutes.
- Section II Part B, Free Response (calculator not permitted): 4 questions in 60 minutes.
When a question gives you and asks about , write first, then justify every claim about with or : " has a relative maximum at because changes from positive to negative at ." A justification that names only "the graph" or "it" does not say which function you mean.
Questions students ask
Why is the variable inside the integral and not ?
is already the upper limit, the place where the total stops. Using a second letter for the variable of integration keeps the two jobs apart. Any letter other than would work.
Is always 0?
Yes. From to there is no width, so there is no area, and for every .
Can be negative and increasing at the same time?
Yes. If the area below the axis comes first, is negative for a while, and as soon as turns positive, starts rising even though its values are still below 0. Increasing is about ; negative is about .
What if the graph of has a corner?
If is continuous, still holds everywhere, so is smooth. At a corner of , does not exist, but you can still read the concavity of on each side from whether is increasing or decreasing.
How do I find values of when is only a table?
If you are told the graph is made of segments joining the points, the pieces are trapezoids and triangles, and the sum is exact. Otherwise the table only lets you estimate , with a Riemann or trapezoidal sum.
Course alignment, for teachers
AP Calculus AB topic 6.5, Unit 6: Integration and Accumulation of Change.
- Skill 2.D: Identify how mathematical characteristics or properties of functions are related in different representations.
This lesson maps the one essential knowledge statement of the topic to the part that teaches each one: 1 is checked by a scored question. The map is in the lesson file.