Unit 8 · Topic 8.4 · about 30 minutes · 7 parts · 11 scored checks, 3 of them multiple choice, plus 1 from earlier lessons
AP Calculus AB 8.4: Finding the Area Between Curves Expressed as Functions of x
Unit 8: 10 to 15% of the multiple-choice section
What you'll be able to do
- Calculate the area of a region in the plane between two curves written as functions of x, with a definite integral.
Key vocabulary
| Term | What it means | The exam trap |
|---|---|---|
| Region in the plane | A part of the coordinate plane closed off by graphs, such as the points between two curves from one x-value to another. | Read every boundary a question names, including the -axis or a vertical line, before you set up an integral. |
| Area between two curves | The size of the region enclosed by two graphs over an interval, found with a definite integral. | Find where the graphs meet and which one is higher before you write the integral, and check that it stays higher across the whole interval. |
| Limits of integration | The numbers and in , which for an area in are where the region starts and stops along the -axis. | Make sure the limits and the differential describe the same variable. |
 Tap to open the picture full size
Part 1 Think first A piece of glass between two edges
Guess before you learn. A wrong guess still makes the answer stick.
Predict first
A glass artist cuts a leaf-shaped piece of glass. On a grid marked in feet, its upper edge is the line and its lower edge is the curve , and the edges meet at and . The region under the line from to , down to the -axis, has area square foot. The region under the curve over the same interval has area square foot. What is the area of the piece of glass?
In short. The area of the region between and from to , where on , is the definite integral .
- A thin vertical strip of the region has height top minus bottom, , and the integral adds up all the strips.
- The limits are the -values where the region starts and stops: given vertical lines, or the solutions of .
- Top minus bottom is a height even where the region dips below the -axis, so an area set up this way is never negative.
Part 2 Learn it Three short ideas, each checked as you go
4a. Top minus bottom, one strip at a time
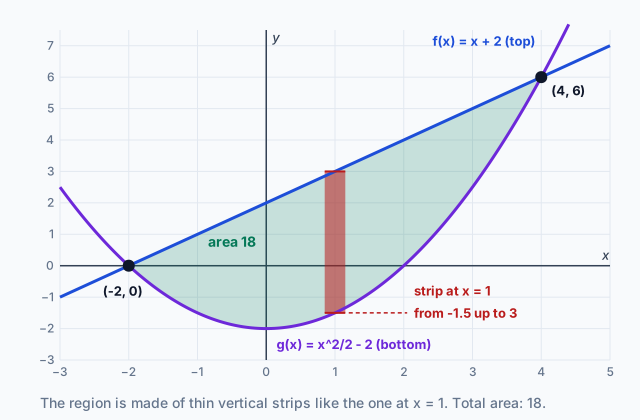
Cut the region between two curves into thin vertical strips, like the one in the graph at the top. A strip at runs from the bottom curve up to the top curve, so its height is top minus bottom, . Its width is a small , so its area is about .
Adding the strips is a Riemann sum, and as the strips get thinner the sum becomes a definite integral. If for every in , the area between the curves from to is
In the graph, is on top of from to , so the shaded area is
Think first's glass is the same idea in one integral: square foot.
Quick check · Calculate
No calculator. From to , the graph of lies above the graph of . What is the area of the region between the two graphs from to ?
4b. Where the region starts and stops
Often no vertical lines are given, and the region is closed off where the two curves meet. Then the limits of integration are the -values of the meeting points, and you find them by setting the functions equal.
Take and . Setting gives , so , and the curves meet at and . The meeting points are and , but the integral is in , so only and are limits. The 4 and the 9 play no part.
Next decide which curve is on top. Pick any between the limits and compare: at , and , so the line is on top. The curves meet only at and , so they cannot trade places in between, and one test value settles it for the whole interval. The area is
Be careful with a curve's own -intercepts. Where meets the -axis tells you nothing here, because the region's bottom is the parabola, not the axis.
Quick check · Multiple choice
No calculator. The region is bounded by the graphs of and . Which integral gives the area of ?
4c. Regions below the x-axis
Top minus bottom does not depend on where the -axis is. In the graph at the top, the strip at runs from up to . Part of it is below the axis, and its height is still , a positive length.
The -axis can be one of the two curves: it is the line . The region between and the -axis lies below the axis from to . Its top is and its bottom is the parabola, so its area is
The integral is : the right size with the wrong sign, because it is bottom minus top. A definite integral can be negative, but an area cannot, so a negative answer to an area question means the subtraction is upside down.
Quick check · Decide and justify
No calculator. A classmate says the area of the region bounded by the graph of and the -axis is . Is the classmate right?
Which reason supports your answer?
Part 3 Watch it done The area of a region closed off by two curves
Watch each step, then do the last one yourself.
Find the area of the region bounded by the graphs of and .
Step 1 · Find where the curves meet
gives , so , and or .
Step 2 · Decide which curve is on top
At , between the limits, and . The line is on top.
Why this step?
Why is one test value enough to know the line is on top for all of ?
The curves meet only at and . To trade places in between, the parabola would have to cross the line, and a crossing would be another meeting point. So the line stays on top for every between and .
Step 3 · Write the integral, top minus bottom
Step 4 · Find an antiderivative and its values at the limits
, so and .
Your step · Calculate
No calculator. Finish it. With , and , what is the area of the region bounded by and ?
Part 4 Try it A calculator region and a setup to sort
Try it · Calculate
Graphing calculator required. Let be the region bounded by the graphs of and . Find the area of , with your calculator in radian mode. Give your answer to three decimal places.
Try it · Sort it
No calculator. The region is bounded by the graphs of and , which meet at and . Sort each expression: does it give the area of , or not? Tap a card, then a bin.
Gives the area of
Does not give the area of
Part 5 Explain it Answer it in free-response form
On the exam free response is handwritten, so work on paper first. Nothing you type here leaves this page. Then compare with the model answer and score each point.
Free response is 50% of the exam score. This one is shaped like Question 5, from free-response Part B (calculator not permitted).
Free-response practice · Question 5 style
No calculator. A garden bed is the region between two curved edges. On a grid marked in meters, one edge is the graph of and the other is the graph of .
(a) Find the -coordinates of the two points where the edges meet. Show the work that leads to your answer.
(b) Find the area of the garden bed. Show the integral you use, and indicate units of measure.
(c) A gardener lays a row of bricks along the vertical line . Verify that this line divides into two regions of equal area.
Model answer
(a) gives , so and . The edges meet at and .
(b) At , and , so is on top on . The area is square meters.
(c) . The part of to the left of has area 4.5 square meters, so the part to the right has area square meters. The two parts are equal.
Score your own answer. This is a self-check, not a grade. Tick each point your answer makes.
Part 6 Check yourself A pond between two shores
The two case questions use the same pond. Answer them from the formulas and the table.
A pond in a park is drawn on a grid marked in meters. Its north shore is the graph of and its south shore is the graph of . The table gives some values of both.
| (meters) | (meters) | (meters) |
|---|---|---|
| 0 | 8 | 8 |
| 1 | 9 | 4.5 |
| 2 | 8 | 2 |
| 3 | 5 | 0.5 |
| 4 | 0 | 0 |
Case question 1 · Calculate
No calculator. The table shows where the two shores meet. What is the area of the pond, in square meters?
Case question 2 · Multiple choice
No calculator. Which expression gives the area of the part of the pond between the vertical lines and ?
The rest stand on their own and do not use the case.
Check yourself · Spot the error
No calculator. A student finds the area of the region bounded by and . Tap the first line with a mistake.
Check yourself · Fill the statement
No calculator. Tap a blank, then tap an answer.
The region bounded by the graph of and the -axis runs from to . On that interval its top boundary is , so each vertical strip has height .
Part 7 Keep it Bring back earlier ideas
Every area in this lesson rested on evaluating a definite integral, and on reading one as an accumulation. Pulling both back up is what makes them last.
From 6.5 Interpreting the Behavior of Accumulation Functions Involving Area · Calculate
No calculator. The graph of is made of two line segments: one from to and one from to . Let . What is ?
Bring it back · Multiple choice
No calculator. Cars enter a parking garage at a rate of cars per hour, where is the number of hours since the garage opened. What does give?
In three lines
- The area between two curves is the integral of the top function minus the bottom one.
- The limits are the -values where the region starts and stops, often the solutions of .
- Top minus bottom is a height even below the -axis, so a negative result means the order is reversed.
Exam strategy for this topic
- Section I Part A, Multiple Choice (calculator not permitted): 29 questions in 62 minutes.
- Section I Part B, Multiple Choice (graphing calculator required): 13 questions in 38 minutes.
- Section II Part A, Free Response (graphing calculator required): 2 questions in 30 minutes.
- Section II Part B, Free Response (calculator not permitted): 4 questions in 60 minutes.
Before you integrate, show the equation you solved for the meeting points and one test value that shows which function is on top. Then write the integral with both limits, top minus bottom in parentheses, and . On a calculator question, store the meeting points instead of retyping rounded values, give the area to three decimal places, and attach square units when there is a context.
Questions students ask
Do I have to graph the curves first?
It helps, but it is not required. What you need is where the curves meet and which one is on top, and both come from algebra: solve , then compare the two functions at one between the solutions.
What if my area comes out negative?
Then the integrand is bottom minus top. The size is right, but the expression you wrote is not the area. Rewrite it as top minus bottom, so what you show and what you report agree.
Does the x-axis count as one of the curves?
Yes. It is the line . For a region between a curve and the axis, the axis is the top when the curve is below it, and the bottom when the curve is above it.
When do I need a calculator to find an area?
When cannot be solved by hand, or the integrand has no antiderivative you can write. Then solve for the meeting points and evaluate the integral on the calculator, and show the integral you evaluated, with its limits and .
What if the curves cross more than twice?
Then the top and bottom curves trade places inside the region, and one integral of top minus bottom no longer works across the whole of it. Topic 8.6 takes up that case.
Course alignment, for teachers
AP Calculus AB topic 8.4, Unit 8: Applications of Integration.
This lesson maps the one essential knowledge statement of the topic to the part that teaches each one: 1 is checked by a scored question. The map is in the lesson file.