Unit 8 · Topic 8.6 · about 30 minutes · 7 parts · 11 scored checks, 3 of them multiple choice, plus 1 from earlier lessons
AP Calculus AB 8.6: Finding the Area Between Curves That Intersect at More Than Two Points
Unit 8: 10 to 15% of the multiple-choice section
What you'll be able to do
- Calculate the area of a region between two curves that cross inside the interval, either as a sum of definite integrals, one for each piece, or as one definite integral of the absolute value of the difference of the two functions.
Key vocabulary
| Term | What it means | The exam trap |
|---|---|---|
| Area between two curves | The area of the region bounded by two graphs, calculated with one or more definite integrals. | Before you write a single integral, check whether the top graph stays on top across the whole interval. |
| Point of intersection | A point where the graphs of and meet, at an input where . | On a calculator, find every one in the interval, not only the ones in the first window you see. |
| Absolute value of the difference, | The vertical distance between the graphs of and at , whichever one is on top. | Read where the bars sit before you evaluate: bars around the integrand and bars around the whole integral are different expressions. |
| Sum of definite integrals | An area written as several definite integrals over pieces of the interval that are added together. | Each piece needs its own top and bottom; one that comes out negative has them reversed. |
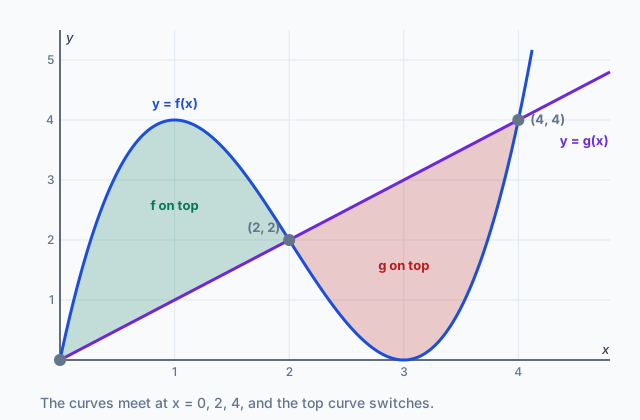 Tap to open the picture full size
Part 1 Think first How much metal is in the two pieces?
Guess before you learn. A wrong guess still makes the answer stick.
Predict first
A sign maker cuts two leaf-shaped pieces from a sheet of metal. On her plan, measured in feet, each piece lies between the line and the curve for , and the two graphs meet at , 0 and 1. Her apprentice works out . How many square feet of metal do the two pieces use together?
In short. When the graphs of and cross, the area between them is a sum of definite integrals of top minus bottom, one for each piece between meeting points, which equals .
- Solve to find where the graphs meet; those inputs split the interval into pieces.
- On each piece one function stays on top, so integrate top minus bottom there and add the results.
- One integral of gives the same area, and a graphing calculator evaluates it directly.
Part 2 Learn it Three short ideas, each checked as you go
2a. Find where the graphs meet, then which is on top
In Topic 8.4 the area between two curves was one integral of top minus bottom, , with on top across the whole interval. When the graphs cross, the top and bottom curves trade places, so first you need to know where they cross.
Solve . Each solution in the interval is a point where the graphs meet, and those inputs cut the interval into pieces.
Test one input in each piece. Between two meeting points is continuous and never 0, so it keeps one sign there. Its sign at any one input of the piece tells you which graph is on top across the whole piece.
The graph at the top of this page shows and on . Setting them equal gives , which factors as , so the graphs meet at , 2 and 4. At , and , so is on top on . At , and , so is on top on .
Quick check · Sort it
No calculator. Let and . Their graphs meet at , and . On each interval, which graph is on top? Tap a card, then a bin.
The graph of is on top
The graph of is on top
2b. One integral for each piece, then add
For the pair in the graph, a single integral over gives , though the shaded region plainly has area. On the difference is negative, so that piece counts as a negative amount and cancels the first piece. A definite integral of adds signed values; an area adds positive ones.
So write one integral per piece, each with top minus bottom:
Here , with antiderivative . Then , and . The first piece is . The second is . The area is .
Every piece of an area comes out positive when it is set up as top minus bottom. If a piece comes out negative, the top and bottom are reversed on that piece.
Quick check · Calculate
No calculator. Let and . Their graphs meet at , and . Find the area of the region between the graphs from to . Give an exact decimal.
2c. Or one integral of the absolute value
The height of the region at is the distance between the graphs, whichever is on top, and that distance is . So one integral gives the whole area:
On each piece the absolute value is just top minus bottom, so this integral equals the sum from 2b. For the pair in the graph, .
Which form you use depends on the tool. By hand you still split at the meeting points, because the absolute value changes formula there: on each piece it is just top minus bottom, and that is what you can find an antiderivative for. On a graphing calculator you can enter as it stands. When the region runs between meeting points the calculator finds by solving , store those values and use them as the limits, so no rounding creeps into the answer.
Watch where the bars go. In the bars come after the integral has added the signed pieces, so the canceling has already happened. For the pair in the graph that expression is .
Quick check · Multiple choice
No calculator. The functions and are continuous, and their graphs cross at and at , with no other meeting points between and . Which expression gives the area of the region between the graphs from to ?
Part 3 Watch it done An area that needs the calculator
Watch each step, then do the last one yourself.
Graphing calculator required. Let and . The graphs of and meet at three points. In radian mode, find the area of the region enclosed between the graphs from the first meeting point to the last.
Step 1 · Find the meeting points
Solve on the calculator. The solutions are , and , with , and . Store all three; do not retype the rounded values.
Step 2 · See which is on top
At , between and : and , so is on top. At , between and : and , so is on top.
Step 3 · Write the area
, which equals .
Why this step?
Why not enter and stop there?
Between and the integrand is negative, because is on top there, so that piece would subtract. The calculator gives : the two pieces partly cancel, and an area cannot be negative.
Your step · Calculate
Graphing calculator required. Finish it. With and the first and last solutions of , stored on your calculator, evaluate in radian mode. Give your answer to three decimal places.
Part 4 Try it A pendant and a classmate's shortcut
Try it · Calculate
Graphing calculator required. A jeweler cuts a pendant from silver sheet. On her plan, in centimeters, the pendant is the region between and from , where the graphs meet, to the last point where they meet for . In radian mode, find the area of the pendant in square centimeters. Give your answer to three decimal places.
Try it · Decide and justify
No calculator. The functions and are continuous, and their graphs meet only at for . A classmate says . Is the classmate right?
Which reason supports your answer?
Part 5 Explain it Answer it on paper, then score it
Free response is handwritten on the exam, so write your answer on paper first. Nothing you type here leaves this page. Then open the model answer and score yourself on each point.
Free response is 50% of the exam score. This one is shaped like Question 1, from free-response Part A (graphing calculator required).
Free-response practice · Question 1 style
Graphing calculator required. A garden plan, drawn with both axes in meters, has a curved path edge and a straight path edge , where and for . Between the points where the two edges meet lie two flower beds. Use radian mode.
(a) Find the -coordinates of all points where the graphs of and meet for . Give each to three decimal places.
(b) Find the total area of the two flower beds, the region between the graphs of and from the first meeting point to the last. Show the setup you use on your calculator, and give your answer to three decimal places. Indicate units of measure.
(c) A helper evaluates , where and are the first and last meeting points, gets , and reports the beds' total area as 1.761 square meters. Explain why the helper's value is not the total area.
Model answer
(a) Solve on the calculator, storing the solutions as , and : , and .
(b) square meters.
(c) The graph of is on top of the graph of from to , so there, and that bed enters the helper's integral as about . The second bed, where is on top, enters as about . The helper's integral adds these signed values, so the first bed cancels part of the second, giving ; taking the absolute value afterward does not undo that. The area needs each bed counted as positive, which gives 4.228 square meters.
Score your own answer. This is a self-check, not a grade. Tick each point your answer makes.
Part 6 Check yourself Two graphs from a table of integrals
The two case questions use the same table. Answer them from it.
The functions and are continuous on , and their graphs meet only at and on that interval. The table gives the definite integral of over each piece.
| Interval | over the interval |
|---|---|
| 2.5 | |
| 1.5 |
Case question 1 · Calculate
No calculator. What is the area of the region between the graphs of and from to ?
Case question 2 · Multiple choice
No calculator. Which sum of integrals is equal to the area of the region between the graphs of and from to ?
The rest stand on their own and do not use the case.
Check yourself · Spot the error
No calculator. A student finds the area of the region between the graphs of and from to . Tap the first line with a mistake.
Check yourself · Put it in order
No calculator. Put the steps for finding the area between two graphs that cross, by hand, in order. Tap them in sequence.
Part 7 Keep it Bring back earlier ideas
Today's lesson stands on area between curves that do not cross, from Topic 8.4, and on reading a definite integral as an accumulation, from Topic 6.4.
Bring it back · Multiple choice
No calculator. The graphs of and meet at and . What is the area of the region between them?
From 6.4 The Fundamental Theorem of Calculus and Accumulation Functions · Calculate
No calculator. Let , and let . What is ?
In three lines
- When two graphs cross, solve to find where they meet; those points split the region into pieces.
- On each piece integrate top minus bottom, and add the pieces; every piece of an area is positive.
- One integral of gives the same area, with the bars around the integrand, not the integral.
Exam strategy for this topic
- Section I Part A, Multiple Choice (calculator not permitted): 29 questions in 62 minutes.
- Section I Part B, Multiple Choice (graphing calculator required): 13 questions in 38 minutes.
- Section II Part A, Free Response (graphing calculator required): 2 questions in 30 minutes.
- Section II Part B, Free Response (calculator not permitted): 4 questions in 60 minutes.
On a calculator part, write the equation you solve for the meeting points and the integral you evaluate, with the integrand, both limits and , before the number. Store the meeting points and use the stored values as limits, and give the result to three decimal places with units. Without a calculator, show the split at each meeting point and an antiderivative for each piece.
Questions students ask
Should I split the integral or use the absolute value?
Both give the same area. By hand, split at the meeting points, because the absolute value changes formula there: on each piece it is just top minus bottom, and that is what you can find an antiderivative for. On a graphing calculator, the absolute value form is one entry, and the calculator handles the switch for you.
How do I know which graph is on top on a piece?
Pick any input strictly between two meeting points and compare and there. Between meeting points the difference never reaches 0, so it cannot change sign, and one test settles the whole piece.
What if a piece comes out negative?
Then you subtracted top from bottom on that piece. Swap the two functions there; the size of the piece stays the same and the sign becomes positive.
Why does a single integral of sometimes give 0?
A definite integral adds signed values. If the pieces where is on top have the same total area as the pieces where is on top, they cancel exactly, even though the region has positive area.
Do I need to round the meeting points before I integrate?
No. Store them on the calculator and use the stored values as limits. Rounding them first can change the third decimal place of the area.
Course alignment, for teachers
AP Calculus AB topic 8.6, Unit 8: Applications of Integration.
- Skill 2.B: Identify mathematical information from graphical, numerical, analytical, and/or verbal representations.
This lesson maps the one essential knowledge statement of the topic to the part that teaches each one: 1 is checked by a scored question. The map is in the lesson file.