Unit 1 · Topic 1.2 · about 30 minutes · 7 parts · 13 scored checks, 1 of them multiple choice, plus 2 from earlier lessons
AP Macroeconomics 1.2: Opportunity Cost and the Production Possibilities Curve (PPC)
Unit 1: 5 to 10% of the multiple-choice section
What you'll be able to do
- Define the production possibilities curve (PPC) and its related terms, explain how it shows opportunity costs, tradeoffs, inefficiency, efficiency and economic growth or contraction, and calculate opportunity cost from a PPC or a table.
Key vocabulary
| Term | What it means | The exam trap |
|---|---|---|
| Production possibilities curve (PPC) | A graph of every combination of two goods an economy can produce when it uses all of its resources fully and efficiently with its current technology. | Points inside the PPC are attainable but waste resources, and points outside are unattainable for now, so do not call an inside point impossible or an outside point inefficient. |
| Tradeoff | Giving up some of one thing to get more of another, as along a PPC, where more of one good means less of the other. | Tradeoffs bite only on the curve: an economy inside its PPC with idle factories can make more of both goods at once. |
| Opportunity cost | The value of the next best alternative given up when a choice is made; on a PPC, the amount of one good given up to make more of the other. | Opportunity cost per unit is the change in the good given up divided by the change in the good gained, never the totals at one point divided by each other. |
| Scarcity | The condition that resources are limited while wants are not, which makes some combinations of goods impossible to produce. | Scarcity is the curve itself, the edge beyond which combinations cannot be produced with today's resources and technology, so a point outside the PPC is out of reach rather than merely costly. |
| Efficiency | Producing at a point on the PPC, where more of one good can be made only by making less of the other. | Every point on the curve is efficient, including the two end points, so efficiency alone does not pick out one best combination. |
| Underutilized resources | Resources that are unemployed or used in work they do poorly, which put an economy at a point inside its PPC. | Full employment alone does not put an economy on its curve, because workers stuck in jobs they do poorly are underutilized too. |
| Constant, increasing and decreasing opportunity costs | Whether each extra unit of a good costs the same amount, more or less of the other good than the unit before, which makes the PPC straight, bowed outward or bowed inward. | Bowed outward from the origin means increasing opportunity cost and bowed inward toward it means decreasing cost, so mixing up the two bows reverses the answer. |
| Factors of production | The resources used to produce goods and services: land, labor and capital. | More or better factors of production shift the whole PPC outward; they do not move a point along the existing curve. |
| Productivity | The amount of output produced from a given amount of resources, such as output per worker per hour. | Higher productivity in only one good, such as a new seed for wheat, moves out only that good's end of the curve. |
| Economic growth | An increase in an economy's capacity to produce, shown by an outward shift of the PPC. | Growth means the curve shifts outward, so a move from inside the PPC onto it, as when a recession ends, raises output without being economic growth. |
| Economic contraction | A decrease in an economy's capacity to produce, shown by an inward shift of the PPC. | Contraction on a PPC is an inward shift from lost resources, such as factories destroyed in an earthquake, not a slide from the curve to a point inside it. |
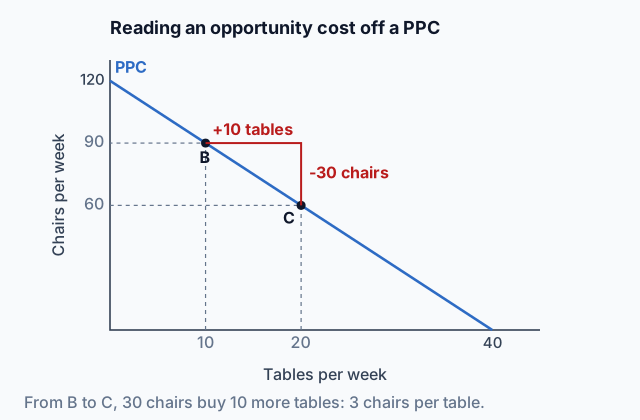 Tap to open the picture full size
Part 1 Think first Ambulances or buses
Guess before you learn. A wrong guess still makes the answer stick.
Predict first
A country is deep in a recession. A quarter of its factories stand idle and many factory workers have lost their jobs. A minister says that if the country wants more ambulances this year, it has to build fewer school buses. Is the minister right about this year?
In short. The production possibilities curve (PPC) is a graph of the most an economy can produce of two goods with its resources and technology, and moving along it shows what one good costs in terms of the other.
- Where a combination sits relative to the curve shows whether resources are used efficiently and whether the combination can be reached at all.
- Opportunity cost per unit is the amount of the good given up divided by the amount of the other good gained, using the changes between two points.
- The curve's shape reflects how opportunity cost changes, and the whole curve shifts when resources or technology change.
Part 2 Learn it Four ideas, with a check after each
2a. One curve, every choice
Picture a country that makes only two goods, wheat and computers. It has a fixed amount of land, labor and capital, and it uses today's technology. The production possibilities curve (PPC) graphs every combination of the two goods it can make when it uses all of those resources fully and efficiently.
Each point on the curve is a different way to allocate the same resources, so moving along the curve is a tradeoff: more computers means less wheat. The wheat you give up is the opportunity cost of the computers.
Where a combination sits tells you something about the economy:
- On the curve, production is efficient. Every resource is in use, in work it suits, and more of one good is possible only by making less of the other.
- Inside the curve, the combination is attainable but resources are underutilized: workers are unemployed, factories are idle, or people are in jobs they do poorly. An economy with unemployment above normal is producing inside its PPC. The country could have more of both goods.
- Outside the curve, the combination is unattainable with today's resources and technology. That edge is scarcity, drawn as a line.
Quick check · Sort it
Each country makes only two goods. Tap a situation, then tap where the country's production sits compared with its PPC.
On the PPC
Inside the PPC
Outside the PPC
2b. Calculating opportunity cost
Opportunity cost on a PPC is always about a move from one point to another. Count what you gain, count what you give up, and divide. Here are two points on the wheat and computer country's PPC.
| Point | Computers | Wheat (tons) |
|---|---|---|
| B | 20 | 90 |
| C | 30 | 75 |
Moving from B to C, the country gains 10 computers and gives up 15 tons of wheat (90 minus 75). The opportunity cost of one more computer is 15 tons divided by 10 computers, or 1.5 tons of wheat per computer.
Two habits keep this straight. Put the good you give up on top and the good you gain on the bottom, and say the answer with its units: 1.5 tons of wheat per computer. And use the changes between the two points, never the totals at one point. 75 divided by 30 is 2.5, and it is not the cost of anything.
The same move read the other way gives the cost of wheat: 10 computers for 15 tons, or about 0.67 computers per ton of wheat.
Quick check · Calculate
Using all of its resources, an island can produce 40 fish and 300 coconuts a week (point P) or 60 fish and 220 coconuts a week (point Q). Moving from P to Q, what is the opportunity cost of one additional fish, in coconuts?
2c. The shape shows how the cost changes
If the opportunity cost of a good stays the same however much of it you make, the PPC is a straight line. That happens when resources are equally good at making both goods. A print shop whose presses print posters or flyers at the same speed gives up the same number of flyers for every extra poster.
Most economies are not like that, because resources are specialized. When the wheat and computer country starts making computers, it moves the workers and land best suited to computers and least suited to wheat, so the first computers cost little wheat. Keep going and it has to pull in prime farmland and skilled farmers, and each computer costs more wheat than the last. That is increasing opportunity cost, and it bows the PPC outward from the origin: the curve falls more and more steeply as you move along it.
Occasionally the cost falls as output grows, for example when making more of a good teaches workers to make it far more cheaply. Then the PPC bows inward, toward the origin.
So the shape is a statement about cost: straight means constant, bowed out means increasing, bowed in means decreasing.
Quick check · Sketch the graph
A country makes only wheat and steel. Its land and workers are specialized, so every extra 10 thousand tons of steel costs more wheat than the 10 thousand tons before it. Sketch its PPC: the most wheat it can grow for each amount of steel from 0 to 50 thousand tons. The first point is fixed at 100 thousand tons of wheat, the most it can grow when it makes no steel.
One shape that fits
Drag a point up or down, or tap it and use the arrow keys. Only the shape is checked.
2d. When the whole curve moves
A PPC is drawn for a given set of resources and a given technology. Change either one and the curve itself moves.
- More or better factors of production, such as a larger labor force, more capital or better-trained workers, shift the PPC outward. So does better technology or higher productivity, which gets more output from the same resources.
- Losing resources shifts it inward: a war or an earthquake that destroys factories, or a workforce that shrinks. That is economic contraction.
An outward shift is economic growth. Combinations that were unattainable become attainable. If the change helps only one good, such as a new seed that raises wheat yields, only the wheat end of the curve moves out. The most computers the country can make has not changed.
Do not confuse a shift with a move toward the curve. When a recession ends and idle workers go back to work, the economy moves from a point inside its PPC toward the curve. Output rises, but the curve has not moved, so that is not growth.
Quick check · Match
Tap an event, then tap what it does to a country's PPC for wheat and computers.
Part 3 Watch it done Rising costs in a table
Watch each step, then do the last one yourself.
Corvale makes only solar panels and corn. With all of its resources fully and efficiently used, it can produce these combinations:
- A: 0 panels and 200 tons of corn
- B: 10 panels and 190 tons of corn
- C: 20 panels and 170 tons of corn
- D: 30 panels and 135 tons of corn
- E: 40 panels and 80 tons of corn
Find the opportunity cost of one more panel, in tons of corn, for each move from A to E.
Step 1 · A to B
Panels rise by 10 and corn falls by 10 tons (200 minus 190). 10 tons divided by 10 panels is 1 ton of corn per panel.
Step 2 · B to C
Panels rise by 10 again, but corn now falls by 20 tons (190 minus 170). 20 divided by 10 is 2 tons of corn per panel, twice the cost of the first move.
Why this step?
Why do the second 10 panels cost more corn than the first 10?
Corvale moved the land and workers least suited to corn first. The next ones it moves are better at growing corn, so every panel they make gives up more corn. Specialized resources make the cost rise, which is why this PPC bows outward.
Step 3 · C to D
Panels rise by 10 and corn falls by 35 tons (170 minus 135). 35 divided by 10 is 3.5 tons of corn per panel.
Your step · Calculate
Finish the table work. Corvale moves from D (30 solar panels and 135 tons of corn) to E (40 solar panels and 80 tons of corn). What is the opportunity cost of one more solar panel, in tons of corn?
Part 4 Try it Draw the curve, then read one
Try it · Sketch the graph
A bakery has one oven and bakes only bread and muffins. A tray of either takes the same 30 minutes, and the oven runs long enough each day for 16 trays. Sketch the bakery's PPC: the most trays of muffins it can bake for 0, 4, 8, 12 and 16 trays of bread. The first point is fixed at 16, the most muffin trays it can bake with no bread.
One shape that fits
Drag a point up or down, or tap it and use the arrow keys. Only the shape is checked.
Try it · Decide and justify
Codara makes only apps and food. A new software tool doubles the number of apps each programmer can write. It does nothing for farming, and Codara's resources stay the same. What happens to the opportunity cost of one app, measured in food?
Which reason supports your choice?
Tarn's production possibilities curve
Four combinations Tarn can make in a month with all of its resources fully and efficiently used.
Try it · Calculate
The graph shows four points on the production possibilities curve of Tarn, a country that makes only tractors and trucks. Reading the points from left to right, Tarn moves from the second point to the third. What is the opportunity cost of each additional tractor, in trucks?
Part 5 Explain it Write it the way the exam asks
Nothing you type leaves this page.
Free response is 33.35% of the exam score. This one is shaped like Question 2, Short.
Free-response practice · Question 2 style
Kandor produces only consumer goods and capital goods, and it faces increasing opportunity costs. (a) Draw a correctly labeled production possibilities curve for Kandor, and label the curve PPC1. (b) On your graph, plot a point labeled B that shows Kandor with unemployed resources. (c) A new technology raises productivity in both industries. On your graph, show the effect and label the new curve PPC2. (d) As Kandor produces more capital goods, what happens to the opportunity cost of each additional unit of capital goods? Explain.
Model answer
(a) Consumer goods on one axis and capital goods on the other, with a curve PPC1 that bows outward from the origin. (b) Point B lies inside PPC1. (c) PPC2 lies outside PPC1 along its whole length and meets both axes farther out, with an arrow from PPC1 to PPC2. (d) The opportunity cost of each additional unit of capital goods increases. Kandor's resources are not equally suited to both goods, so as it makes more capital goods it has to move resources that are better at making consumer goods, and each unit gives up more consumer goods than the one before.
Score your own answer. This is a self-check, not a grade. Tick each point your answer makes.
Part 6 Check yourself Read a PPC from a table
Read the table first, then answer both questions from it.
Marlow, a fictional country, makes only laptops and rice. With all of its resources fully and efficiently employed, it can produce any of these combinations:
| Point | Laptops (thousands) | Rice (thousand tons) |
|---|---|---|
| V | 0 | 60 |
| W | 5 | 56 |
| X | 10 | 48 |
| Y | 15 | 33 |
| Z | 20 | 0 |
Case question 1 · Calculate
Using Marlow's production possibilities, what is the opportunity cost of each additional thousand laptops when Marlow moves from point X to point Y, in thousand tons of rice?
Case question 2 · Multiple choice
Marlow is producing 10 thousand laptops and 40 thousand tons of rice. Using Marlow's production possibilities, which statement describes this combination?
The rest stand on their own and do not use the case.
Check yourself · Select all
A country's PPC shifts outward. Which two statements must be true? Select two.
Select 2 answers, then check.
Check yourself · Fill the statement
Tap a blank, then tap a word.
A PPC shows the a country faces in deciding how to use its resources. At any point on the curve, making more of one good means making of the other.
Check yourself · Spot the error
A country can make 4 tractors and 50 tons of wheat, or 6 tractors and 42 tons of wheat. A student found the opportunity cost of one more tractor. Tap the first line that goes wrong.
Part 7 Keep it Keep it
From 1.1 Scarcity · Fill the statement
Tap a blank, then tap a word or phrase.
Ines has 15 free hours this week. Her coach wants 10 of them for practice, and the pharmacy where she works wants 12 for shifts. Her hours are , so she has to how to use them, and any hour she gives to practice .
From 1.1 Scarcity · Decide and justify
A mountain spring flows into the square of a village of 50 people. It runs day and night with far more water than the villagers ever collect, and anyone may take as much as they like. Is the spring's water scarce for the villagers?
Which reason supports your choice?
In three lines
- Points on a PPC are efficient, points inside waste resources, and points outside are out of reach for now.
- Opportunity cost per unit is the change in the good given up divided by the change in the good gained.
- Constant cost draws a line, increasing cost bows the curve out, and more resources or better technology shift it out.
Exam strategy for this topic
- Section I, Multiple Choice: 60 questions in 70 minutes.
- Section II, Free Response: 3 questions in 60 minutes.
- This lesson's Explain it is shaped like free-response question 2, Short.
- A four-function calculator is allowed on both sections of the exam.
When you show a shift, keep the original curve, label it PPC1 and the new one PPC2, and put the names of the two goods on the axes. For an opportunity cost, write the change in each good before you divide, and give the answer per unit with its units.
Questions students ask
How do I calculate opportunity cost from two points on a PPC?
Find how much of each good changed on the move, then divide the amount given up by the amount gained. Going from 40 fish and 300 coconuts to 60 fish and 220 coconuts gives up 80 coconuts for 20 fish, so each fish costs 4 coconuts.
Why is the PPC usually bowed outward?
Resources are specialized. The first units of a good use the resources best suited to it, and later units pull in resources that were better at the other good, so each unit costs more than the last. That increasing opportunity cost bows the curve outward.
When is the PPC a straight line?
When resources are equally good at making both goods, so every unit costs the same amount of the other good. A bakery whose oven bakes a tray of bread or a tray of muffins in the same 30 minutes has a straight-line PPC.
Where does an economy with high unemployment sit on its PPC?
Inside it. When unemployment is above normal and factories sit idle, resources are underutilized, so the economy could produce more of both goods without giving anything up.
What shifts the PPC outward?
More or better resources, such as a larger labor force, more capital or better-trained workers, and better technology or higher productivity. If the improvement helps only one good, only that good's end of the curve moves out.
Course alignment, for teachers
AP Macroeconomics topic 1.2, Unit 1: Basic Economic Concepts.
- Skill 4.A: Draw an accurately labeled graph or visual to represent an economic model or market.
This lesson maps all 5 essential knowledge statements of the topic to the part that teaches each one: 5 are checked by a scored question. The map is in the lesson file.