Unit 1 · Topic 1.4 · about 30 minutes · 7 parts · 11 scored checks, 2 of them multiple choice, plus 2 from earlier lessons
AP Macroeconomics 1.4: Demand
Unit 1: 5 to 10% of the multiple-choice section
What you'll be able to do
- Define the law of demand, and explain, with a graph where it helps, the relationship between the price of a good or service and the quantity demanded.
- Explain the determinants of demand, using a graph where it helps.
Key vocabulary
| Term | What it means | The exam trap |
|---|---|---|
| Law of demand | The rule that price and quantity demanded are inversely related: when a good's price rises and nothing else changes, buyers want less of it. | The law of demand covers a change in the good's own price, so it predicts a movement along the demand curve, never a shift of it. |
| Quantity demanded | The amount of a good buyers are willing and able to buy at one particular price. | Quantity demanded is what buyers want at one price, so a rise in the good's own price lowers quantity demanded, not demand. |
| Demand curve | A graph of quantity demanded at each price, with price on the vertical axis, which slopes down because of the law of demand. | Price goes on the vertical axis and quantity on the horizontal, so a shift to the right means more is wanted at every price. |
| Market demand curve | The demand curve for all the buyers in a market together, found by adding up what each buyer wants at each price. | Adding buyers, such as families moving into town, shifts the market demand curve right, because that curve sums every buyer's quantity at each price. |
| Determinants of demand | Factors other than the good's own price, such as consumer income, that change how much buyers want at every price and so shift the demand curve. | When the price that changed belongs to another good, such as coffee's price in the market for tea, it is a determinant and shifts tea's demand curve. |
 Tap to open the picture full size
Part 1 Think first Peanut butter gets expensive
Guess before you learn. A wrong guess still makes the answer stick.
Predict first
A drought ruins much of the peanut harvest, and the price of peanut butter jumps by half. The price of grape jelly does not change at all. Over the next few months, what most likely happens to the amount of grape jelly people buy?
In short. Demand describes how much of a good buyers are willing and able to buy at each price, and a demand curve graphs it with price on the vertical axis.
- By the law of demand, price and quantity demanded move in opposite directions, so the demand curve slopes down.
- A change in the good's own price is a movement along the curve: a change in quantity demanded.
- A change in a determinant, such as consumer income, shifts the whole curve: a change in demand.
Part 2 Learn it Four ideas, one check after each
2a. The law of demand
Demand is how much of a good buyers are willing and able to buy at each possible price. The amount they want at one particular price is the quantity demanded. A demand schedule lists those amounts. Here is a smoothie stand at a Saturday farmers market:
| Price | Smoothies demanded |
|---|---|
| $3.00 | 120 |
| $4.00 | 100 |
| $5.00 | 80 |
| $6.00 | 60 |
| $7.00 | 40 |
Each time the price goes up, buyers want fewer smoothies. That is the law of demand: price and quantity demanded are inversely related, so when one rises the other falls. At a higher price some shoppers switch to lemonade or water, and others cannot fit as many smoothies into what they planned to spend.
Plot the schedule with price on the vertical axis and quantity on the horizontal axis and you get a demand curve. Because quantity falls as price rises, the curve slopes down from left to right. Add up what every buyer in a market wants at each price and you get the market demand curve, which slopes down for the same reason.
The smoothie stand's demand curve
Each dot is one row of the schedule. Higher prices sit with smaller quantities, so the curve slopes down.
Quick check · Sketch the graph
A food truck finds that buyers want 30 tacos an hour at $6.00, 60 at $5.00, 90 at $4.00, 120 at $3.00 and 150 at $2.00. Use that schedule to sketch the shape of the truck's demand curve: drag the points so the curve falls or rises, and bends or runs straight, the way the schedule does. The exact heights are up to you.
One shape that fits
Drag a point up or down, or tap it and use the arrow keys. Only the shape is checked.
2b. Quantity demanded or demand?
A demand curve is drawn holding everything else about buyers fixed: their incomes, their tastes, the prices of other goods. So there are two kinds of change, and economists keep separate words for them.
A change in the good's own price moves buyers along the curve to a new point. That is a change in quantity demanded. If the smoothie price rises from $4.00 to $5.00, quantity demanded falls from 100 to 80, and the curve stays exactly where it was.
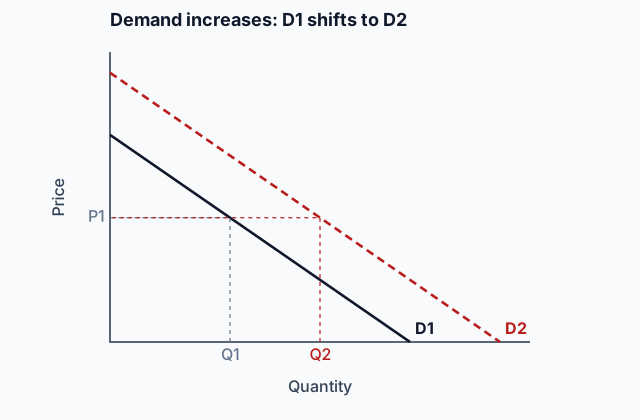
A change in anything else that affects buyers moves the whole curve. That is a change in demand. If a heat wave makes shoppers want 30 more smoothies at every price, the curve shifts right: an increase in demand. If they want fewer at every price, it shifts left: a decrease in demand.
So the first question to ask is whether the good's own price changed. If it did, slide along the curve. If something else changed, move the curve.
Quick check · Sort it
Each event happens on its own in one town's market for movie tickets. Tap an event, then tap what it does to the demand curve for movie tickets in that town.
A movement along the demand curve
A shift of the demand curve
2c. Income and the prices of related goods
The things other than price that shift demand are the determinants of demand. The first is consumer income.
Income. For most goods, more income means buyers want more at every price, so demand shifts right. These are normal goods, such as restaurant meals and new clothes. For a few goods, more income means buyers want less, because they can now afford something they like better. These are inferior goods, such as store-brand instant noodles, and for them higher income shifts demand left.
Prices of related goods. Two goods are substitutes when one can replace the other, like coffee and tea. If coffee gets more expensive, people buy less coffee and drink more tea, so the demand for tea shifts right. Two goods are complements when they are used together, like printers and ink. If printers get more expensive, fewer are sold, fewer people need ink, and the demand for ink shifts left.
In both cases the price that changed belongs to the other good. Tea's own price never moved.
Quick check · Fill the statement
Tap a blank, then tap a word.
For most cooks, butter and margarine are . If the price of butter rises, the demand for margarine . If incomes rise and margarine is an inferior good, the demand curve for margarine shifts to the .
2d. Tastes, expectations and the number of buyers
Three more determinants come up again and again.
Tastes. A fashion or a health report can make buyers want more of a good at every price, shifting demand right, or less, shifting it left.
Expectations. What buyers expect about the future changes what they buy today. If buyers expect a good's price to rise next month, more of them buy now, so today's demand shifts right. If they expect their incomes to rise soon, they may start buying more of a normal good now, too.
Number of buyers. The market demand curve adds up every buyer. A growing town or a new group of customers adds buyers and shifts market demand right. Buyers leaving shift it left.
Each of these changes how much buyers want at every price, and none of them is the good's own price. So each one moves the whole curve. Decide which way by asking whether buyers now want more or less at the price they face today.
Quick check · Decide and justify
A popular shopping website reports that TV prices will drop sharply next month, when new models arrive. Today's TV prices have not changed. What happens to the demand for TVs this month?
Which reason supports your choice?
Part 3 Watch it done New neighbors at the pool
Watch each step, then do the last one yourself.
A town pool sells day passes. Its weekly demand schedule is: $6.00, 500 passes; $8.00, 400 passes; $10.00, 300 passes. A new neighborhood of families opens nearby, and at every price buyers now want 150 more passes a week than before. Then the pool, seeing the crowds, raises its price from $8.00 to $10.00. How many passes a week do buyers want at the new price?
Step 1 · Name the change
The families did not arrive because of the pool's price. More families nearby means more buyers, one of the determinants of demand, so the whole demand curve moves.
Why this step?
Why does the new families' arrival shift the curve instead of moving buyers along it?
Their arrival is not a change in the price of a pass. It changes how many passes buyers want at every price, and anything other than the good's own price moves the whole curve.
Step 2 · Pick the direction
Buyers want more passes at every price, so demand increases and the curve shifts right, from D1 to D2.
Step 3 · Build the new schedule
Add 150 to the quantity in every row, and keep the prices as they were. That new schedule is D2. The pool's price rise comes after the shift and is a change in the pass's own price, so it moves buyers along D2, never back onto D1.
Your step · Calculate
A town pool's weekly demand schedule for day passes was: $6.00, 500 passes; $8.00, 400 passes; $10.00, 300 passes. New families move in nearby, and buyers now want 150 more passes a week at every price. The pool then raises its price from $8.00 to $10.00. How many day passes a week do buyers want at $10.00?
passes
Part 4 Try it Two new situations
Neither of these appears earlier in the lesson. For each one, ask first whether the good's own price changed, then which curve moves and which way.
Try it · Spot the error
The price of gasoline rises from $3.00 to $4.50 a gallon and stays there. A student writes four lines about the market for gasoline and the market for large pickup trucks, which burn a lot of gasoline. Tap the first line that goes wrong.
Try it · Multiple choice
Over ten years, incomes in a city rise steadily. The bus fare stays at $2.00 the whole time, yet residents take fewer bus rides each year as more of them buy cars. What does this show about bus rides in that city?
Part 5 Explain it Answer it in writing
This is a self-check. What you type stays on this page.
Free response is 33.35% of the exam score. This one is shaped like Question 2, Short.
Free-response practice · Question 2 style
Bicycles and bicycle helmets are both sold in the town of Linden. Sketch the graph on paper, then type the written parts. (a) Draw a correctly labeled graph of the demand for bicycle helmets. Label the demand curve D1, and mark a price P1 and the quantity demanded at that price, Q1. (b) Suppose the price of bicycles falls sharply. On your graph, show the effect on the demand for helmets, labeling the new curve D2 and the quantity demanded at P1 on D2 as Q2. (c) Identify whether bicycles and helmets are substitutes or complements. (d) A helmet store owner says, "If we raise our helmet prices, the demand for helmets will fall." Is the owner's statement correct? Explain.
Model answer
(a) Price on the vertical axis and quantity of helmets on the horizontal, with a downward-sloping demand curve D1, and P1 and Q1 marked on the axes at one point on D1. (b) The demand curve shifts right to D2, shown by an arrow from D1. At P1 the quantity demanded on D2 is Q2, to the right of Q1. (c) They are complements. (d) The owner is not correct. A higher helmet price lowers the quantity demanded, a movement along the demand curve. Demand itself, the whole curve, does not change, because only the helmet's own price changed.
Score your own answer. This is a self-check, not a grade. Tick each point your answer makes.
Part 6 Check yourself Read a demand schedule
Read the table first; both questions use it.
A café on a college campus sells cold brew coffee, and it always sells as many cups as buyers want at its posted price. The manager estimated the café's weekly demand schedule for cold brew in September and again in October.
| Price per cup | September (cups per week) | October (cups per week) |
|---|---|---|
| $3.00 | 400 | 300 |
| $3.50 | 350 | 250 |
| $4.00 | 300 | 200 |
| $4.50 | 250 | 150 |
Case question 1 · Multiple choice
Which single event could explain the change in the campus café's cold brew demand schedule from September to October?
Case question 2 · Calculate
The campus café charged $3.50 a cup for cold brew in September. In October it raised the price to $4.00. Using the café's September and October demand schedules for cold brew, by how many cups per week did its cold brew sales fall from September to October? Give the decrease as a positive number.
The rest stand on their own and do not use the case.
Check yourself · Select all
Which two of these events would shift the demand curve for electric cars to the right? Select two.
Select 2 answers, then check.
Check yourself · Match
Each event happens on its own in a city's market for running shoes, a normal good, and none of them changes the price of shoes. Tap an event, then tap the determinant it changes and what happens to demand.
Part 7 Keep it Keep it
From 1.3 Comparative Advantage and Gains from Trade · Match
Ivo and Uma make kites with the same tools and materials. Each line describes a different week. Tap a description, then tap who has the absolute advantage in kites that week.
From 1.2 Opportunity Cost and the Production Possibilities Curve (PPC) · Calculate
Using all of its resources, an island can produce 40 fish and 300 coconuts a week (point P) or 60 fish and 220 coconuts a week (point Q). Moving from P to Q, what is the opportunity cost of one additional fish, in coconuts?
In three lines
- Price and quantity demanded are inversely related, so demand curves slope down.
- A change in the good's own price moves buyers along the curve.
- Income, related goods' prices, tastes, expectations and the number of buyers shift it.
Exam strategy for this topic
- Section I, Multiple Choice: 60 questions in 70 minutes.
- Section II, Free Response: 3 questions in 60 minutes.
- This lesson's Explain it is shaped like free-response question 2, Short.
- A four-function calculator is allowed on both sections of the exam.
Before you touch the graph, ask whether the good's own price changed: if it did, move along the curve, and if anything else changed, shift the whole curve. Label the axes price and quantity, label D1 and D2, and draw an arrow showing which way demand moved.
Questions students ask
What is the difference between demand and quantity demanded?
Quantity demanded is the amount buyers want at one particular price, a single point on the curve. Demand is the whole curve. A change in the good's own price changes quantity demanded, and anything else that changes what buyers want at every price changes demand.
Why does the demand curve slope down?
At a higher price some buyers switch to other goods, and others cannot fit as many units into what they planned to spend. Quantity demanded falls as the price rises, so the curve slopes down from left to right.
What is an inferior good?
A good buyers want less of when their income rises, because they can now afford something they like better. Store-brand instant noodles are a common example, and higher income shifts their demand curve left.
How do expectations shift demand?
If buyers expect a good's price to rise soon, more of them buy now, so today's demand shifts right. If they expect it to fall, as with TVs before new models arrive, many wait and today's demand shifts left.
Does a change in the price of a complement move along the demand curve or shift it?
It shifts it, because the price that changed belongs to another good. If printers get more expensive, fewer are sold and the demand for ink shifts left, even though ink's own price never moved.
Course alignment, for teachers
AP Macroeconomics topic 1.4, Unit 1: Basic Economic Concepts.
- Skill 4.A: Draw an accurately labeled graph or visual to represent an economic model or market.
This lesson maps all 2 essential knowledge statements of the topic to the part that teaches each one: 2 are checked by a scored question. The map is in the lesson file.