Unit 1 · Topic 1.5 · about 28 minutes · 7 parts · 11 scored checks, 2 of them multiple choice, plus 2 from earlier lessons
AP Macroeconomics 1.5: Supply
Unit 1: 5 to 10% of the multiple-choice section
What you'll be able to do
- Define the law of supply, and explain, with a graph where it helps, the relationship between the price of a good or service and the quantity supplied.
- Explain the determinants of supply, using a graph where it helps.
Key vocabulary
| Term | What it means | The exam trap |
|---|---|---|
| Law of supply | There is a positive relationship between the price of a good and the quantity supplied, so the supply curve slopes upward. | Higher prices raise quantity supplied under the law of supply, but they do not increase supply, because sellers only move along the curve they already have. |
| Quantity supplied | The amount of a good sellers are willing and able to offer for sale at one particular price. | Quantity supplied changes when the good's own price changes, which is a movement along the supply curve rather than a shift. |
| Supply curve | A graph of the quantity supplied at each price, with price on the vertical axis and quantity on the horizontal axis. | A supply curve shifted left sits higher on the graph, yet it is a decrease in supply, so read the curve sideways at one price. |
| Market supply curve | The supply curve for a whole market, found by adding every seller's quantity supplied at each price. | More sellers entering the market shift the market supply curve right, because that curve adds every seller's quantity at each price. |
| Determinants of supply | Factors other than the good's own price, such as input prices, that change how much sellers offer at every price and so shift the supply curve. | Each determinant changes how much sellers offer at every price, so news that only changes the good's own price is not one of them. |
| Input prices | The prices a firm pays for what it uses to produce, such as wages, materials and energy; a rise decreases supply and a fall increases it. | Pricier inputs, such as higher wages or costlier fertilizer, decrease supply and shift the curve left, even though the new curve looks higher. |
 Tap to open the picture full size
Part 1 Think first The rows on the hill
Guess before you learn. A wrong guess still makes the answer stick.
Predict first
A blueberry farm picks the rows near its packing shed every summer. A few rows on a steep hill far from the shed stay unpicked when buyers pay $2 a pint. One summer buyers pay $4 a pint, and the farm sends pickers up the hill. Why did the farm leave those rows alone at $2 a pint?
In short. Supply describes how much sellers offer at each price: a change in the good's own price moves sellers along the supply curve, and a change in anything else that affects sellers shifts the whole curve.
- The law of supply: price and quantity supplied move in the same direction, so the supply curve slopes upward.
- A change in the good's own price is a change in quantity supplied, shown as a movement along the curve.
- A determinant such as an input price shifts the curve: a shift right is an increase in supply, a shift left is a decrease.
Part 2 Learn it Four short ideas, each checked as you go
2a. The law of supply
Quantity supplied is the amount sellers are willing and able to offer for sale at one particular price. The law of supply says that when the price of a good rises, quantity supplied rises, and when the price falls, quantity supplied falls. Price and quantity supplied move together: a positive relationship.
The reason is cost. A sawmill can cut more boards in a week, but the extra boards come from overtime shifts and an older saw that wastes wood, so each extra board costs more than the one before. At $400 per thousand board feet only the cheapest boards are worth cutting. At $600 the overtime boards pay for themselves too, so the mill offers more.
A supply schedule lists the quantity supplied at each price. Plot it with price on the vertical axis and quantity on the horizontal axis, connect the points, and you have a supply curve. Higher prices go with larger quantities, so it slopes upward. Add up every seller's quantity at each price and you get the market supply curve, which slopes upward for the same reason.
Quick check · Sketch the graph
Fresh Acres Farm's weekly supply schedule for eggs: at $3 a dozen it offers 40 dozen, at $4 it offers 60 dozen, at $5 it offers 80 dozen, at $6 it offers 100 dozen and at $7 it offers 120 dozen. Use the schedule to sketch the shape of the farm's supply curve: drag the points so your curve rises from left to right in the same pattern as the schedule's prices. The exact prices are not needed.
One shape that fits
Drag a point up or down, or tap it and use the arrow keys. Only the shape is checked.
2b. Along the curve, or a new curve
Keep two phrases apart. When the good's own price changes, sellers move along the supply curve they already have. That is a change in quantity supplied. The curve itself has not moved.
When something other than the good's own price changes how much sellers will offer at every price, the whole curve moves. That is a change in supply. The things that do this are the determinants of supply, and the next chunk names them.
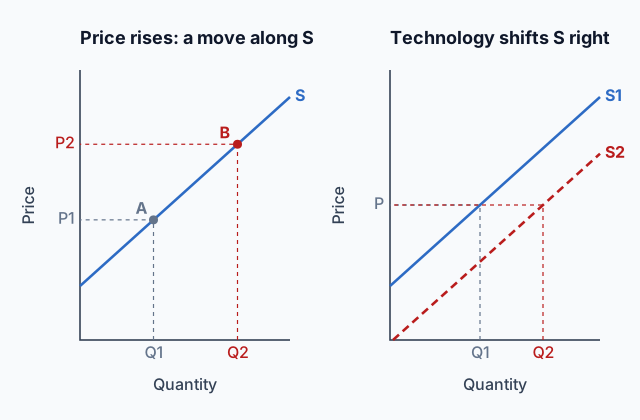
Here is a test you can run on any story. Pick one price and ask whether sellers would now offer a different amount at that same price. If they would, supply changed and the curve shifted. If the only news is that the price itself moved, the curve stayed put and sellers slid along it. The left half of the diagram at the top of this page shows that slide: the price rises from P1 to P2, and sellers go from point A to point B on one curve S.
So "the price of tomatoes rose, so the supply of tomatoes increased" is wrong. The higher price raised the quantity supplied. The supply curve is the same one it was.
Quick check · Multiple choice
The price that stores pay for avocados rises from $1.00 to $1.50 each, and avocado growers ship more avocados to stores. Nothing else about growing avocados has changed. Which describes the growers' response?
2c. What shifts supply
An increase in supply means sellers offer more at every price, and the curve shifts right. A decrease in supply means they offer less at every price, and it shifts left. These are the determinants you will meet:
- Input prices. Inputs are what a firm buys to produce, such as labor and materials. A pricier input makes each unit cost more, so supply decreases. A cheaper one increases it.
- Technology and productivity. A better machine or method makes each unit cheaper to produce, so supply increases.
- Number of sellers. More firms add their quantities at every price, so market supply increases. Firms leaving decrease it.
- Expected future price. Sellers of a good that keeps, such as grain or frozen juice, may hold some back now if they expect a higher price later, so supply today decreases. Fresh fish cannot wait for next month's price.
- Prices of other goods the firm could produce. A farm that can plant corn or soybeans moves land into soybeans when their price rises, so the supply of corn decreases.
- Taxes and subsidies on producers. A tax per unit works like a higher cost and decreases supply. A subsidy works like a lower cost and increases it.
Quick check · Sort it
Each event happens on its own in the market for orange juice. Tap an event, then tap what it does to the supply of orange juice.
Supply increases (shifts right)
Supply decreases (shifts left)
2d. Reading a shift on the graph
Here is the trap. A supply curve that shifts left also sits higher on the graph, because an upward-sloping line moved left lies above where it was. Students see "higher" and write "supply increased." It decreased.
Read supply sideways, at one fixed price. Run a horizontal line across the graph at, say, $5. If it meets the new curve at a smaller quantity than the old one, sellers offer less at $5, and that is a decrease in supply.
The height tells you something true as well: on the new curve, sellers need a higher price to offer the same quantity as before. That is the same news said the other way round. Producing got more expensive.
So left is less and right is more, whatever the new curve looks like from top to bottom. A rightward shift sits lower and is an increase, as in the right half of the diagram at the top of this page.
When you draw a shift, label the first curve S1 and the new one S2, so a reader can see which way it moved.
Quick check · Spot the error
A student explained how a sharp rise in the price of flour affects the supply of bread. Tap the first line with a mistake.
Part 3 Watch it done Cocoa gets expensive
Watch each step, then do the last one yourself.
Cocoa beans are the main input for chocolate makers. A poor cocoa harvest raises the price of the beans. Before the harvest, the chocolate makers in one region offered 3,000 pounds of chocolate a week at $12 a pound and 4,000 pounds at $15. After the bean price rose, they offer 2,200 pounds at $12 and 3,200 pounds at $15. Show what happens to the supply of chocolate and name the change.
Step 1 · Name what changed
The price of cocoa beans changed, not the price of chocolate. Beans are an input, so this is a determinant of supply. The curve will shift; this is not a movement along the old one.
Step 2 · Read it at one price
Hold the price at $12 and read both schedules: before the harvest, 3,000 pounds; after, 2,200 pounds. At $15 it is 4,000 before and 3,200 after. Each pound now costs more to make, so some pounds that paid for themselves at $12 no longer do.
Why this step?
Why compare quantities at the same price?
Holding the price fixed keeps the two ideas apart. If the price changed too, you could not tell whether a new quantity came from the bean cost, which shifts the curve, or from a move along the curve.
Step 3 · Draw S2
Plot the new pairs, ($12, 2,200) and ($15, 3,200), and connect them. Label the old curve S1 and the new one S2. On the graph, S2 sits above S1: to get 3,000 pounds out of the chocolate makers now, buyers would have to pay more than $12.
Your step · Decide and justify
Finish the analysis of the chocolate market after the cocoa bean price rose. Is the change an increase or a decrease in the supply of chocolate?
Which reason supports your choice?
Part 4 Try it A studio and a farm
Two new situations. Work each one with the at-one-price test before you answer.
Try it · Calculate
Mesa Clayworks, a pottery studio, offered 200 mugs a month at $30 a mug and 260 mugs a month at $40. Then the price of clay rose, and now it offers 150 mugs a month at $30 and 210 at $40. At a price of $40, how many fewer mugs a month does the studio offer than before the clay price rose?
Try it · Select all
A Georgia farm can plant its fields in peanuts or in cotton. Which two of these events decrease the farm's supply of peanuts? Select two.
Select 2 answers, then check.
Part 5 Explain it Write it the way the exam asks
Nothing you type leaves this page.
Free response is 33.35% of the exam score. This one is shaped like Question 2, Short.
Free-response practice · Question 2 style
Sketch the graph on paper, then type the written parts. Pumpkins are grown and sold in a competitive market. (a) Draw a correctly labeled graph of the market supply curve for pumpkins. Label the curve S1, and show the quantity supplied at a price P1, labeled Q1. (b) Suppose the wage paid to pumpkin pickers rises. On your graph, show the effect on the supply of pumpkins. Label the new curve S2 and the quantity supplied at P1 on S2 as Q2. (c) Identify one change, other than a change in wages, that would increase the supply of pumpkins. Explain why it increases supply.
Model answer
(a) Price on the vertical axis and quantity on the horizontal axis, with an upward-sloping supply curve S1. At price P1 the curve shows quantity Q1. (b) S2 is drawn to the left of S1, with an arrow from S1 to S2. At P1, S2 shows Q2, to the left of Q1. (c) A fall in the price of fertilizer. Fertilizer is an input, so each pumpkin costs less to grow, and growers offer more pumpkins at every price.
Score your own answer. This is a self-check, not a grade. Tick each point your answer makes.
Part 6 Check yourself Read supply from a table
Read the table first, then answer both questions from it.
Flower growers in Oakdale, a fictional town, reported how many bunches of cut flowers they would offer each week at each price, in March and again in April.
| Price per bunch | March | April |
|---|---|---|
| $6 | 300 | 180 |
| $8 | 400 | 280 |
| $10 | 500 | 380 |
| $12 | 600 | 480 |
Case question 1 · Calculate
In the Oakdale cut-flower table, in March, by how many bunches a week does quantity supplied rise when the price rises from $8 to $12 a bunch?
Case question 2 · Multiple choice
Graph the March and April schedules from the Oakdale cut-flower table, with price on the vertical axis. How does the April supply curve compare with the March supply curve?
The rest stand on their own and do not use the case.
Check yourself · Fill the statement
Tap a blank, then tap a word or phrase.
A new design of solar panel cuts the cost of generating electricity, so power companies offer more electricity at every price. That is in , and the supply curve shifts to the .
Check yourself · Match
Tap an event in the market for pencils, then tap what it does on the supply graph.
Part 7 Keep it Keep it
From 1.4 Demand · Fill the statement
Tap a blank, then tap a word.
For most cooks, butter and margarine are . If the price of butter rises, the demand for margarine . If incomes rise and margarine is an inferior good, the demand curve for margarine shifts to the .
From 1.2 Opportunity Cost and the Production Possibilities Curve (PPC) · Spot the error
A country can make 4 tractors and 50 tons of wheat, or 6 tractors and 42 tons of wheat. A student found the opportunity cost of one more tractor. Tap the first line that goes wrong.
In three lines
- Price and quantity supplied rise and fall together, so the supply curve slopes up.
- A change in the good's own price moves along the curve; a determinant shifts it.
- A shift left is a decrease in supply, even though the new curve sits higher.
Exam strategy for this topic
- Section I, Multiple Choice: 60 questions in 70 minutes.
- Section II, Free Response: 3 questions in 60 minutes.
- This lesson's Explain it is shaped like free-response question 2, Short.
- A four-function calculator is allowed on both sections of the exam.
Label the first curve S1 and the new one S2 with an arrow between them, and test every shift by reading across at one price. When you explain a shift, name the determinant that changed and say whether sellers now offer more or less at the same price.
Questions students ask
Why does the supply curve slope upward?
Extra output usually costs more to produce than the output before it, because it comes from overtime shifts or older machines. A higher price makes that costlier output worth producing, so sellers offer more as the price rises.
If the supply curve moves up on the graph, did supply increase?
No. A supply curve that shifts left also sits higher, and that is a decrease. Read across at one price: if sellers offer less there than before, supply fell.
How do expected future prices change supply today?
Sellers of a good that keeps, such as grain or frozen juice, may hold some back now if they expect a higher price later, so supply today decreases. Fresh fish cannot wait for next month's price.
How can the price of a different good change supply?
A firm that can make two goods moves resources toward the one that pays more. If soybean prices rise, a farm that can plant corn or soybeans plants more soybeans, so its supply of corn decreases.
Does a subsidy increase or decrease supply?
A subsidy per unit works like a lower cost, so sellers offer more at every price and supply increases. A tax per unit on producers works the other way and decreases supply.
Course alignment, for teachers
AP Macroeconomics topic 1.5, Unit 1: Basic Economic Concepts.
- Skill 4.A: Draw an accurately labeled graph or visual to represent an economic model or market.
This lesson maps all 2 essential knowledge statements of the topic to the part that teaches each one: 2 are checked by a scored question. The map is in the lesson file.