Unit 1 · Topic 1.6 · about 30 minutes · 7 parts · 10 scored checks, 2 of them multiple choice, plus 2 from earlier lessons
AP Macroeconomics 1.6: Market Equilibrium, Disequilibrium, and Changes in Equilibrium
Unit 1: 5 to 10% of the multiple-choice section
What you'll be able to do
- Define market equilibrium, using a graph where it helps.
- Define a surplus and a shortage, explain with a graph how prices adjust to restore equilibrium in a market that is out of balance, and calculate the size of the surplus or shortage.
- Explain, with a graph where it helps, how changes in demand and supply affect the equilibrium price and equilibrium quantity.
Key vocabulary
| Term | What it means | The exam trap |
|---|---|---|
| Market equilibrium | The price at which the quantity buyers want to buy equals the quantity sellers want to sell, together with that quantity. | Equilibrium is where quantity demanded equals quantity supplied, not where buyers want the most, since at a low price buyers may want many units that no seller offers. |
| Disequilibrium price | Any price other than the equilibrium price, where quantity demanded and quantity supplied are not equal. | Any price other than equilibrium leaves a gap, and that gap is measured with both quantities at that price, not from the equilibrium quantity. |
| Shortage | The amount by which quantity demanded is greater than quantity supplied, at a price below equilibrium. | Shortages happen below the equilibrium price, so calling the gap at a price above equilibrium a shortage reverses the answer. |
| Surplus | The amount by which quantity supplied is greater than quantity demanded, at a price above equilibrium. | Surplus is quantity supplied minus quantity demanded at a price above equilibrium, such as 1,100 minus 500 = 600 permits at $140, not the distance from the equilibrium quantity. |
| Market forces | The responses of buyers and sellers to a shortage or surplus that push the price toward equilibrium. | Market forces move the price, and the quantities slide along the existing curves, so the adjustment back to equilibrium never shifts demand or supply. |
 Tap to open the picture full size
Part 1 Think first Sold out by nine
Guess before you learn. A wrong guess still makes the answer stick.
Predict first
A farm stand sells baskets of strawberries for $3. Every Saturday it sells out by 9 a.m., and people who arrive later leave with nothing. The farmer has more berries in the field that she would pick if it paid. What is she most likely to do over the next few Saturdays?
In short. Market equilibrium is the price at which the quantity buyers want to buy equals the quantity sellers want to sell.
- At any other price the market is out of balance, and the shortage or surplus is the gap between quantity demanded and quantity supplied at that price.
- Market forces push a disequilibrium price back toward equilibrium.
- A change in a determinant of demand or supply shifts a curve and gives a new equilibrium price and quantity.
Part 2 Learn it Four short ideas, each checked as you go
2a. Where buyers and sellers agree
Shops in a beach town rent bikes by the day. The table is the market's schedule: at each price, how many bikes renters want (quantity demanded) and how many the shops offer (quantity supplied).
| Price per day | Quantity demanded | Quantity supplied |
|---|---|---|
| $10 | 280 | 0 |
| $15 | 240 | 100 |
| $20 | 200 | 200 |
| $25 | 160 | 300 |
| $30 | 120 | 400 |
At $20 a day, renters want 200 bikes and the shops offer 200. Market equilibrium is the price at which quantity demanded equals quantity supplied, so $20 is the equilibrium price and 200 bikes is the equilibrium quantity. At that price nobody who will pay $20 goes without a bike, and no shop is left holding a bike it wanted to rent.
The table follows two rules, where P is the price in dollars: Qd = 360 − 8P and Qs = 20P − 200. Put any price in and you get its row. At $25, Qd = 360 − 200 = 160 and Qs = 500 − 200 = 300. Setting the two rules equal finds equilibrium without the table: 360 − 8P = 20P − 200 gives 560 = 28P, so P = $20.
On a graph, equilibrium is where the demand curve crosses the supply curve.
Equilibrium is not the price where buyers want the most. At $10 renters want 280 bikes, but the shops offer none, so nobody rents at all.
The bike rental market
Demand and supply cross at $20 a day and 200 bikes.
Quick check · Decide and justify
In one town in December, at $25 a shovel buyers want 400 snow shovels and stores offer 400. At $20, buyers want 520 and stores offer 300. A student says $20 is the equilibrium price because more shovels are wanted there. Is the student right?
Which reason supports your choice?
2b. Shortage and surplus
Go back to the bike rentals and set the price somewhere else. At $15 a day, renters want 240 bikes but the shops offer only 100. Quantity demanded is greater than quantity supplied, so the market has a shortage. Its size is the gap at that price: 240 − 100 = 140 bikes.
At $25 a day it flips. The shops offer 300 bikes and renters want 160. Quantity supplied is greater than quantity demanded, a surplus of 300 − 160 = 140 bikes.
Any price other than the equilibrium price is a disequilibrium price, and it leaves the market with one of these imbalances. Two habits keep the arithmetic right:
- Use both quantities at the price you were given. The equilibrium quantity, 200, plays no part in the gap at $15 or at $25.
- Name the gap by which side is bigger. Buyers wanting more is a shortage, which happens below the equilibrium price. Sellers offering more is a surplus, which happens above it.
On a graph, draw a horizontal line at the price. The distance between where it meets the demand curve and where it meets the supply curve is the shortage or surplus.
Quick check · Match
Weekly car washes in one town. Tap a price, then tap what the market has at that price.
2c. How the price finds its way back
A disequilibrium price does not last, because the imbalance gives buyers and sellers a reason to act differently. Economists call these responses market forces.
With a surplus, sellers are stuck with goods nobody bought. To move them, they cut the price. As the price falls, buyers want more (quantity demanded rises) and sellers offer less (quantity supplied falls), so the surplus shrinks.
With a shortage, buyers who go without are willing to pay more, and sellers see they could charge more and still sell everything. The price rises. Quantity demanded falls and quantity supplied rises, so the shortage shrinks.
Either way the price keeps moving until the two quantities are equal again, at equilibrium.
Notice what moved. The price changed, and the quantities moved along each curve. Neither curve shifted, because nothing about buyers' incomes or sellers' costs changed. Only the price did.
Quick check · Put it in order
A clothing maker prices a new jacket at $120, and about 3,000 jackets a month go unsold. Tap the steps in the order the market moves back to equilibrium.
2d. When a curve shifts
Equilibrium moves when something other than the good's own price changes: one of the determinants of demand or supply.
Work it in order. Decide which curve the change hits first, decide whether it shifts right or left, then find where the moved curve crosses the curve that did not move.
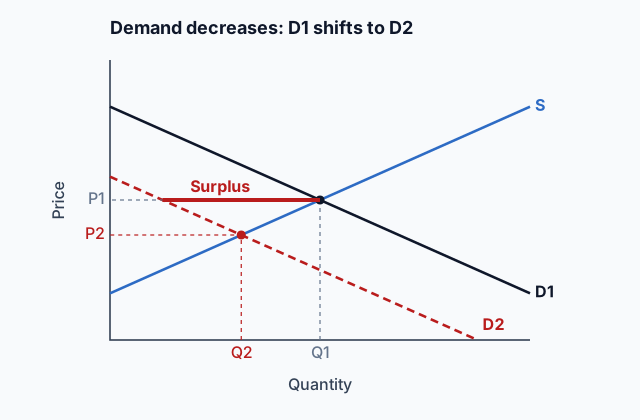
The graph at the top of this page shows one case. In a college town, most students leave for the summer, so buyers want fewer pizza deliveries at every price. Demand shifts left from D1 to D2. At the old price P1, the shops still offer Q1 pizzas but buyers now want far fewer, a surplus. The shops cut the price until the market settles where D2 crosses S, at a lower price P2 and a smaller quantity Q2. Supply did not shift; the shops moved down along S.
One shift at a time gives four patterns:
- Demand right: price and quantity both rise.
- Demand left: price and quantity both fall.
- Supply right: price falls and quantity rises.
- Supply left: price rises and quantity falls.
Label your graph the same way every time: the moved curve D2 or S2, the first equilibrium P1 and Q1, and the new one P2 and Q2.
Quick check · Sort it
Each change happens on its own in the market named. Tap a change, then tap what happens to that market's equilibrium price and quantity.
Price rises, quantity rises
Price falls, quantity rises
Price rises, quantity falls
Price falls, quantity falls
Part 3 Watch it done Honey at a farmers market
Watch each step, then do the last one yourself.
Weekly demand for jars of honey at a farmers market is Qd = 1,000 − 60P and weekly supply is Qs = 40P, where P is the price in dollars. Find the equilibrium price and quantity, then the shortage or surplus if the price is $5.
Step 1 · Set the quantities equal
Equilibrium is where quantity demanded equals quantity supplied, so set the two equations equal: 1,000 − 60P = 40P. Add 60P to both sides to get 1,000 = 100P, so P = $10.
Why this step?
Why set the two equations equal to each other?
Equilibrium is the price at which the quantity buyers want equals the quantity sellers offer. Qd = Qs finds the one price where that is true.
Step 2 · Find the quantity
Put $10 into either equation. Supply gives 40 × 10 = 400 jars, and demand gives 1,000 − 600 = 400 jars. Both give 400 jars, which is a check that the price is right.
Step 3 · Name the imbalance at $5
$5 is below the equilibrium price of $10. Below equilibrium, buyers want more than sellers offer, so expect a shortage. Size it with both quantities at $5, not with the equilibrium quantity of 400.
Your step · Calculate
Weekly demand for jars of honey at a farmers market is Qd = 1,000 − 60P and weekly supply is Qs = 40P, where P is the price in dollars. If the price is $5, how large is the shortage, in jars per week?
jars
Part 4 Try it Draw it yourself
One step further. Sometimes demand and supply both shift in the same stretch of time. Work out what each shift does on its own. Where the two agree, the direction is certain. Where they pull opposite ways, the result depends on which shift is bigger, and without sizes you cannot say. If demand shifts right while supply shifts left, for example, both push the price up, so the price rises for certain, but one pushes quantity up and the other pushes it down, so the change in quantity cannot be determined.
Try it · Multiple choice
In the market for wool sweaters, a mild winter cuts the number of sweaters people want at every price. That season, the price of wool yarn also falls sharply. Compared with the starting equilibrium, what can you say for certain?
Part 5 Explain it Write it the way the exam asks
Nothing you type leaves this page.
Free response is 33.35% of the exam score. This one is shaped like Question 2, Short.
Free-response practice · Question 2 style
Assume the market for fresh salmon in a coastal city is in equilibrium. (a) Draw a correctly labeled graph of the market for salmon, showing the equilibrium price labeled P1 and quantity labeled Q1. (b) The price of fuel for fishing boats rises sharply. On your graph, show the effect on the market, labeling the new equilibrium price P2 and quantity Q2. (c) Right after the change, if the price were still P1, would the market have a shortage or a surplus? Explain. (d) Explain how market forces move the price from P1 to P2.
Draw your graph on paper, then type your answers to (c) and (d) here.
Model answer
(a) Price on the vertical axis and quantity on the horizontal, with a downward-sloping demand curve D and an upward-sloping supply curve S1 crossing at P1 and Q1. (b) Supply shifts left to S2, shown by an arrow from S1. Where S2 crosses D, the price P2 is above P1 and the quantity Q2 is to the left of Q1. (c) A shortage. Buyers still want Q1 at P1, but after the shift sellers offer less than Q1 at that price, so quantity demanded is greater than quantity supplied. (d) Buyers who go without bid the price up. As it rises, quantity demanded falls and quantity supplied rises along S2 until they are equal at P2.
Score your own answer. This is a self-check, not a grade. Tick each point your answer makes.
Part 6 Check yourself Read the market from a schedule
Read the table first, then answer both questions from it.
In Halden, a fictional city, private garages sell monthly parking permits downtown, and the price is set by the market. The table is the market schedule for Halden's parking permits.
| Price per month | Quantity demanded | Quantity supplied |
|---|---|---|
| $60 | 900 | 300 |
| $80 | 800 | 500 |
| $100 | 700 | 700 |
| $120 | 600 | 900 |
| $140 | 500 | 1,100 |
Case question 1 · Calculate
If the price of a Halden parking permit is $140 a month, how large is the surplus, in permits?
Case question 2 · Multiple choice
If the price of a Halden parking permit is $80 a month, what does the market have, and which way do market forces move the price?
The rest stand on their own and do not use the case.
Check yourself · Spot the error
A student explained how they graphed a forecast of a very wet spring in a city's market for rain jackets. Tap the first line with a mistake.
Check yourself · Select all
The market for school-logo hoodies is at its equilibrium price. Which two statements must be true? Select two.
Select 2 answers, then check.
Part 7 Keep it Keep it
From 1.5 Supply · Fill the statement
Tap a blank, then tap a word or phrase.
A new design of solar panel cuts the cost of generating electricity, so power companies offer more electricity at every price. That is in , and the supply curve shifts to the .
From 1.3 Comparative Advantage and Gains from Trade · Sort it
Kiri gives up 0.5 bushel of pears to grow one bushel of apples. Tova gives up 2.5 bushels of pears to grow one bushel of apples. Kiri specializes in apples, Tova in pears, and Kiri trades apples to Tova for pears. Tap an offer, then tap whether it leaves both of them better off than growing both fruits themselves.
Both are better off
At least one is not better off
In three lines
- Equilibrium is the price where quantity demanded equals quantity supplied.
- At any other price the gap between the two quantities is a shortage or surplus, and it pushes the price toward equilibrium.
- A shift in demand or supply gives a new equilibrium price and quantity.
Exam strategy for this topic
- Section I, Multiple Choice: 60 questions in 70 minutes.
- Section II, Free Response: 3 questions in 60 minutes.
- This lesson's Explain it is shaped like free-response question 2, Short.
- A four-function calculator is allowed on both sections of the exam.
Label P1 and Q1 at the first crossing, the moved curve as D2 or S2, and P2 and Q2 at the new crossing, with dashed lines to the axes. Then state the direction of each change with its reason, such as a shortage at the old price pushing the price up.
Questions students ask
How do I find equilibrium from demand and supply equations?
Set quantity demanded equal to quantity supplied, solve for the price, then put that price back into either equation. For honey with Qd = 1,000 - 60P and Qs = 40P, 1,000 = 100P gives a price of $10 and a quantity of 400 jars.
How do I calculate the size of a shortage?
Find quantity demanded and quantity supplied at the given price and subtract. In the honey market at $5, buyers want 700 jars and sellers offer 200, so the shortage is 500 jars a week.
Why does a surplus push the price down?
Sellers are stuck with goods nobody bought, so they cut the price to move them. As the price falls, quantity demanded rises and quantity supplied falls until the two are equal.
When demand rises and the price goes up, does supply shift too?
No. The higher price moves sellers up along the supply curve they already have. Only a change in a determinant of supply, such as an input price, would shift it.
What if demand and supply shift at the same time?
Work out each shift on its own. Where they push the same way the direction is certain, and where they push opposite ways the result depends on which shift is bigger. A mild winter that cuts sweater demand while yarn gets cheaper lowers the price for certain, but the change in quantity cannot be determined.
Course alignment, for teachers
AP Macroeconomics topic 1.6, Unit 1: Basic Economic Concepts.
- Skill 4.C: Demonstrate the effect of a change in an economic situation on an accurately labeled graph or visual.
This lesson maps all 3 essential knowledge statements of the topic to the part that teaches each one: 3 are checked by a scored question. The map is in the lesson file.