Unit 2 · Topic 2.6 · about 30 minutes · 7 parts · 12 scored checks, 1 of them multiple choice, plus 2 from earlier lessons
AP Macroeconomics 2.6: Real v. Nominal GDP
Unit 2: 12 to 17% of the multiple-choice section
What you'll be able to do
- Explain what nominal GDP and real GDP each measure.
- Calculate real GDP and the GDP deflator.
Key vocabulary
| Term | What it means | The exam trap |
|---|---|---|
| Nominal GDP | The value of a year's final goods and services at that year's prices, a measure of how much is spent on output. | Rising nominal GDP does not prove the economy produced more, because the same output at higher prices raises nominal GDP while real GDP stays put. |
| Real GDP | The value of a year's final goods and services at constant base-year prices, a measure of how much is produced. | Quantities come from the year you are measuring and prices from the base year, even for a good whose price fell, so current prices or base-year quantities give the wrong real GDP. |
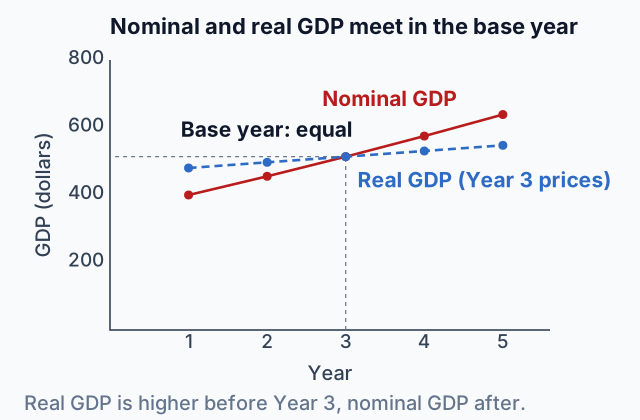
| Base year | The year whose prices are used to value output in every year, so real GDP equals nominal GDP in that year. | In the base year real GDP equals nominal GDP and the deflator is 100, but that does not mean the inflation rate was zero that year. |
| GDP deflator | A price index for all the final goods and services in GDP, equal to nominal GDP divided by real GDP, times 100. | Nominal over real, times 100, gives the deflator, so a result under 100 after prices rose means you divided the wrong way, and the answer carries no dollar sign or percent sign. |
 Tap to open the picture full size
Part 1 Think first Two films, twenty-five years apart
Guess before you learn. A wrong guess still makes the answer stick.
Predict first
A film took in $600 million in ticket sales the year it came out. Twenty-five years later, a different film took in $900 million. Over those 25 years, the prices of goods and services in general doubled. Once you allow for that, which film's ticket sales were bigger?
In short. Nominal GDP measures a year's output at that year's prices, and real GDP measures it at constant base-year prices, which takes out the effect of changes in the price level.
- Real GDP shows how much an economy produced; nominal GDP shows how much was spent on that output.
- The GDP deflator is nominal GDP divided by real GDP times 100, and it converts either one into the other.
- Valuing output at one fixed base year's prices overstates real growth, so statistical agencies use other methods.
Part 2 Learn it Four short ideas, each checked as you go
2a. Spending on output, or output itself
GDP adds up the market value of final goods and services, and market value is price times quantity. Take a tiny economy that makes only notebooks and bus rides, in two years.
| Good | Quantity | Price |
|---|---|---|
| Notebooks | 2,000 | $3.00 |
| Bus rides | 10,000 | $2.00 |
| Good | Quantity | Price |
|---|---|---|
| Notebooks | 2,000 | $4.50 |
| Bus rides | 10,000 | $3.00 |
Year 1's nominal GDP is 2,000 × $3 + 10,000 × $2 = $26,000. Nominal GDP uses current prices, the prices of the year you are measuring, so it measures how much is spent on that year's output.
In Year 2 the economy makes exactly the same notebooks and rides, but every price is up by half. Nominal GDP jumps to 2,000 × $4.50 + 10,000 × $3 = $39,000. Nobody made one more notebook.
Real GDP values output at constant prices, the same prices every year. That removes the effect of changes in the overall price level, so real GDP measures how much is produced. Here it did not change at all.
Quick check · Sort it
Each change happens from one year to the next, in a different economy each time. Tap a change, then tap what it does to GDP.
Nominal GDP changes, real GDP does not
Real GDP changes too
2b. Real GDP: this year's output at base-year prices
To hold prices constant, pick one year as the base year and use its prices for every year. Real GDP for any year is that year's quantities times the base-year prices.
Back to notebooks and bus rides, with Year 1 as the base year. In Year 3 the economy makes 2,400 notebooks and 12,000 bus rides, still at Year 2's prices of $4.50 and $3.
- Nominal GDP in Year 3, at Year 3 prices: 2,400 × $4.50 + 12,000 × $3 = $46,800.
- Real GDP in Year 3, at Year 1 prices: 2,400 × $3 + 12,000 × $2 = $31,200.
Real GDP rose from $26,000 to $31,200, which is 20 percent more output. Nominal GDP rose 80 percent, and most of that was prices.
In the base year itself, real and nominal GDP use the same prices, so they are always equal: $26,000 both ways in Year 1.
When a price falls, nothing about the method changes. Quantities come from the year you are measuring and prices come from the base year, whichever way each price moved.
Quick check · Calculate
Brisa produces only three final goods. In Year 1 it made 1,000 e-readers at $120 each, 4,000 haircuts at $25 each and 6,000 bags of rice at $10 each. In Year 2 it made 1,400 e-readers at $100 each, 4,200 haircuts at $30 each and 6,100 bags of rice at $13 each. Using Year 1 as the base year, what is Brisa's real GDP in Year 2, in dollars?
2c. The GDP deflator, in both directions
Divide one GDP figure by the other and you get a price index for everything the economy produces, the GDP deflator:
GDP deflator = nominal GDP ÷ real GDP × 100
For notebooks and bus rides in Year 3, that is $46,800 ÷ $31,200 × 100 = 150. Prices of this economy's output are 50 percent above the base year. In the base year itself, nominal and real GDP are the same number, so the deflator there is always 100. The deflator is an index, so it has no dollar sign and no percent sign. If you get a number under 100 when prices have risen, you divided the wrong way.
The same equation, turned around, converts nominal GDP to real GDP or back:
- Real GDP = nominal GDP ÷ deflator × 100. So $46,800 ÷ 150 × 100 = $31,200.
- Nominal GDP = real GDP × deflator ÷ 100. So $31,200 × 150 ÷ 100 = $46,800.
Because the deflator is a price index, its percentage change is an inflation rate. If next year's deflator is 153, prices rose (153 − 150) ÷ 150 × 100 = 2 percent.
Quick check · Spot the error
An economy's nominal GDP is $800 billion and its GDP deflator is 125. A student converts nominal GDP to real GDP. Tap the first line that goes wrong.
2d. Why one base year overstates growth
Base-year prices have a weakness. It shows up when something gets much cheaper and people buy far more of it.
Say an economy makes phones and dental checkups. From Year 1 to Year 5, phones fall from $400 to $200 and sales rise from 1,000 to 1,500. Checkups go from $30 to $35, and their number from 10,000 to 10,200.
- At Year 1 prices, output grows from $700,000 to $906,000, about 29 percent.
- At Year 5 prices, the same output grows from $550,000 to $657,000, about 19 percent.
Same goods, two growth rates. Year 1 prices count every extra phone at its old $400 price, so the good whose quantity grew fastest gets extra weight, and growth looks bigger than it was. The farther a year is from the base year, the bigger the problem.
So statistical agencies do not keep one base year forever. The U.S. Bureau of Economic Analysis compares each year with the one before it, using up-to-date prices, and links the results together. That is why its real GDP is reported in "chained" dollars.
Quick check · Multiple choice
Why do statistical agencies not measure real GDP growth with one fixed base year's prices forever?
Part 3 Watch it done Is the typical person in Ardena better off?
Watch each step, then do the last one yourself.
Ardena, a fictional country, uses Year 1 as its base year. In Year 1 its nominal GDP was $600 billion, its GDP deflator was 100 and its population was 30 million. In Year 3 its nominal GDP was $864 billion, its GDP deflator was 120 and its population was 32 million. Find real GDP per capita in each year to judge whether the standard of living rose.
Step 1 · Real GDP in the base year
Year 1 is the base year, so real GDP equals nominal GDP: $600 billion. The deflator of 100 says the same thing.
Step 2 · Real GDP in Year 3
Real GDP = nominal GDP ÷ deflator × 100 = $864 billion ÷ 120 × 100 = $720 billion. Prices are 20 percent above the base year, so real GDP comes out smaller than nominal GDP.
Why this step?
Why divide by the deflator instead of taking 20 percent off $864 billion?
A deflator of 120 says Year 3 prices are 1.2 times base-year prices, so nominal GDP is real GDP times 1.2. Undoing a multiplication by 1.2 means dividing by 1.2. Taking 20 percent off gives $691.2 billion, which is too small.
Step 3 · Per person, in the base year
The standard of living is about output per person, so divide real GDP by the population. Year 1: $600 billion ÷ 30 million = $20,000 per person. Use real GDP, not nominal, or rising prices will look like rising living standards.
Your step · Calculate
Ardena's real GDP in Year 3 is $720 billion and its population is 32 million. Its nominal GDP that year is $864 billion. What is Ardena's real GDP per capita in Year 3, in dollars?
dollars
Real GDP per capita rose from $20,000 to $22,500, so the standard of living in Ardena rose. Nominal GDP per capita rose from $20,000 to $27,000, and judging by it would have made the gain look more than twice as big.
Part 4 Try it Real numbers from the U.S. economy
The U.S. Bureau of Economic Analysis (BEA) estimates nominal GDP, real GDP and the GDP deflator every quarter. The figures below were read on October 14, 2026 from FRED, the Federal Reserve Bank of St. Louis's data site (series GDP and GDPDEF, last updated September 30, 2026). They are for the second quarter of 2026, at a seasonally adjusted annual rate. The BEA revises these estimates, so a later reading may show different numbers.
| Measure | Value |
|---|---|
| Nominal GDP (billions of dollars, annual rate) | 32,563.0 |
| GDP deflator (2017 = 100) | 133.411 |
Try it · Calculate
For the second quarter of 2026, FRED (read October 14, 2026) lists U.S. nominal GDP of $32,563.0 billion at an annual rate and a GDP deflator of 133.411, with 2017 = 100. What is U.S. real GDP for that quarter, in billions of 2017 dollars, to the nearest billion?
Part 5 Explain it Write it the way the exam asks
Nothing you type leaves this page.
Free response is 33.35% of the exam score. This one is shaped like Question 2, Short.
Free-response practice · Question 2 style
Valmora, a fictional country, produces only two final goods, tablets and concert tickets. Year 1 is the base year.
- Year 1: 5,000 tablets at $300 each and 30,000 concert tickets at $20 each. Population 1,000.
- Year 2: 6,000 tablets at $275 each and 35,000 concert tickets at $30 each. Population 1,250.
(a) Calculate Valmora's real GDP in Year 2. Show your work.
(b) Calculate the GDP deflator for Year 2. Show your work.
(c) Using the GDP deflator, calculate the inflation rate from Year 1 to Year 2. Show your work.
(d) Did Valmora's standard of living increase, decrease, or stay the same from Year 1 to Year 2? Explain, using real GDP per capita.
Model answer
(a) Year 2 quantities at Year 1 prices: 6,000 × $300 + 35,000 × $20 = $1,800,000 + $700,000 = $2,500,000. (b) Nominal GDP in Year 2 is 6,000 × $275 + 35,000 × $30 = $1,650,000 + $1,050,000 = $2,700,000, so the deflator is $2,700,000 ÷ $2,500,000 × 100 = 108. (c) The deflator is 100 in the base year, so inflation is (108 − 100) ÷ 100 × 100 = 8%. (d) It decreased. Real GDP per capita fell from $2,100,000 ÷ 1,000 = $2,100 in Year 1 to $2,500,000 ÷ 1,250 = $2,000 in Year 2.
Score your own answer. This is a self-check, not a grade. Tick each point your answer makes.
Part 6 Check yourself Read the national accounts
Read the table first, then answer each question from it.
Morvik is a fictional economy. Its statistics agency publishes these figures, in billions of dollars. Real GDP is valued at Year 1 prices, the base year. Three cells are left blank for you to work out.
| Year | Nominal GDP | Real GDP | GDP deflator |
|---|---|---|---|
| 1 | $800 | $800 | 100 |
| 2 | $832 | ? | 104 |
| 3 | ? | $850 | 109.72 |
| 4 | $1,035 | $900 | ? |
Case question 1 · Calculate
In Year 3, Morvik's real GDP is $850 billion and its GDP deflator is 109.72, with Year 1 as the base year. What is Morvik's nominal GDP in Year 3, in billions of dollars, to the nearest billion?
Case question 2 · Calculate
Morvik's GDP deflator is 104 in Year 2 and 109.72 in Year 3, with Year 1 as the base year. What is the inflation rate from Year 2 to Year 3, in percent, to one decimal place?
Case question 3 · Calculate
In Year 4, Morvik's nominal GDP is $1,035 billion and its real GDP, valued at Year 1 prices, is $900 billion. What is Morvik's GDP deflator in Year 4?
The rest stand on their own and do not use the case.
Check yourself · Decide and justify
Morvik's nominal GDP rose from $800 billion in Year 1 to $832 billion in Year 2, and its GDP deflator rose from 100 to 104. Did Morvik produce more output in Year 2 than in Year 1?
Which reason supports your choice?
Check yourself · Match
Tap a quantity, then tap how to calculate it.
Check yourself · Select all
Which two statements are true of any economy in its base year? Select two.
Select 2 answers, then check.
Part 7 Keep it Keep it
From 2.5 Costs of Inflation · Spot the error
A student explained what happened to a bank in a year when everyone expected 3% inflation. Tap the first line that goes wrong.
From 2.3 Unemployment · Spot the error
Pelton's actual unemployment rate is 7.5%, its cyclical unemployment rate is 2% and its frictional unemployment rate is 3.5%. A student worked out Pelton's structural unemployment rate. Tap the first line that goes wrong.
In three lines
- Nominal GDP uses current prices; real GDP uses base-year prices, so only real GDP tracks how much is produced.
- GDP deflator = nominal ÷ real × 100; divide nominal by it (× 100) for real, multiply real by it (÷ 100) for nominal.
- Inflation is the percentage change in the deflator; judge the standard of living by real GDP per capita, never nominal.
Exam strategy for this topic
- Section I, Multiple Choice: 60 questions in 70 minutes.
- Section II, Free Response: 3 questions in 60 minutes.
- This lesson's Explain it is shaped like free-response question 2, Short.
- A four-function calculator is allowed on both sections of the exam.
Set out each calculation good by good as quantity times price, and label which year's quantities and which year's prices you are using. After you convert, check the direction: once prices have risen since the base year, real GDP should come out smaller than nominal GDP.
Questions students ask
Why are real GDP and nominal GDP equal in the base year?
Real GDP values output at base-year prices, and in the base year those are also the current prices. Both use the same numbers, so the deflator there is 100.
Can real GDP ever be bigger than nominal GDP?
Yes, in years before the base year when prices have been rising. Prices back then were lower than base-year prices, so valuing that output at base-year prices gives the bigger number.
Why can't I just take the price rise off as a percent?
A deflator of 120 means prices are 1.2 times base-year prices, so undoing it means dividing by 1.2. Taking 20 percent off $864 billion gives $691.2 billion, which is too small; dividing gives $720 billion.
Why is U.S. real GDP reported in chained dollars?
Valuing output at one old base year's prices gives too much weight to goods that got cheaper and sold far more, which overstates growth. The Bureau of Economic Analysis compares each year with the one before at up-to-date prices and links the results together.
How do I get an inflation rate from the GDP deflator?
Treat it like any price index: the change in the deflator divided by the earlier deflator, times 100. From 120 to 126 is 6 ÷ 120 × 100 = 5 percent.
Course alignment, for teachers
AP Macroeconomics topic 2.6, Unit 2: Economic Indicators and the Business Cycle.
- Skill 1.C: Identify an economic concept, principle, or model using quantitative data or calculations.
This lesson maps all 4 essential knowledge statements of the topic to the part that teaches each one: 4 are checked by a scored question. The map is in the lesson file.