Unit 2 · Topic 2.7 · about 30 minutes · 7 parts · 12 scored checks, 1 of them multiple choice, plus 2 from earlier lessons
AP Macroeconomics 2.7: Business Cycles
Unit 2: 12 to 17% of the multiple-choice section
What you'll be able to do
- Define and explain the turning points and phases of the business cycle, using graphs and data where they help.
Key vocabulary
| Term | What it means | The exam trap |
|---|---|---|
| Business cycle | The rise and fall of an economy's real output and employment over time, caused by changes in aggregate demand or aggregate supply. | Swings in real output and employment start with a change in aggregate demand or aggregate supply, so a fall that began when oil costs jumped for most firms started with aggregate supply, not with a cut in spending. |
| Recession | The phase of the business cycle from a peak to the next trough: a significant, broad decline in economic activity, of which real GDP is the main measure. | Two falling quarters of real GDP in a row is not the test: a recession is a contraction significant, widespread and long enough to be called one, and the 2001 recession had no two consecutive falling quarters. |
| Expansion | The phase of the business cycle from a trough to the next peak, during which economic activity, measured mainly by real GDP, rises. | Rising real GDP is an expansion even while output is still below its old peak or below potential, because the phase is named by direction, not level. |
| Peak | The turning point where economic activity stops rising and starts to fall. | Peaks are single points, not stretches of time, and on NBER's dates the falling phase begins in the month after the peak. |
| Trough | The turning point where economic activity stops falling and starts to rise. | Lowest real GDP marks the trough, and the quarters right after it are an expansion even if output is still below potential. |
| Potential output | The level of real GDP produced when unemployment equals the natural rate of unemployment, also called full-employment output. | Potential output is not the most an economy can produce, since unemployment can dip below the natural rate for a while and push actual output above potential. |
| Output gap | The difference between actual output and potential output, written as actual minus potential. | Subtract actual minus potential, never the other way, so real GDP of $870 billion against potential of $900 billion is a gap of negative $30 billion. |
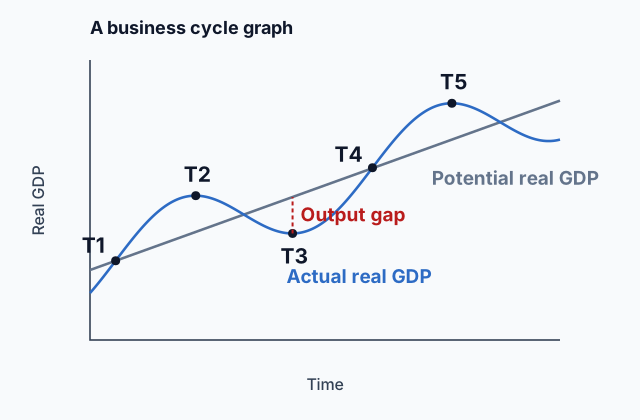 Tap to open the picture full size
Part 1 Think first Climbing out of a hole
Guess before you learn. A wrong guess still makes the answer stick.
Predict first
Novaria's real GDP fell for six quarters in a row. It has now risen for two quarters, but it is still lower than it was before the fall began. Which phase of the business cycle is Novaria in right now?
In short. The business cycle is the rise and fall of an economy's real output and employment around its potential output, which is the output it produces at the natural rate of unemployment.
- The turning points are the peak and the trough; the phases between them are recession and expansion.
- A phase is named by the direction economic activity is moving, with real GDP as its main measure, not by how high it is.
- The output gap is actual output minus potential output, so a shortfall gives a negative number.
Part 2 Learn it Four short ideas, each checked as you go
2a. Output rises and falls
Real GDP does not grow in a smooth line. It rises for a while, falls for a while, then rises again. These swings in an economy's total output, and in the number of people with jobs, are the business cycle. They start with a change in total spending (aggregate demand), or in the economy's ability or willingness to produce at given prices (aggregate supply), for example after a jump in firms' costs. Unit 3 builds both of those models.
Output and employment move together. When households cut spending, unsold goods pile up, so firms produce less and need fewer workers, and unemployment rises. When spending picks up, firms produce more and hire again.
The cycle is a pattern in economic activity: output, jobs and incomes taken together. Real GDP is its main measure. A cycle has two turning points and two phases:
- A peak is the highest point of economic activity before it starts to fall.
- A recession is the phase from a peak down to the next trough: a significant, broad decline in economic activity, with real GDP falling.
- A trough is the lowest point, where activity stops falling and starts to rise.
- An expansion is the phase from a trough up to the next peak, while activity rises.
Quick check · Match
Tap a term, then tap what it means on a graph of real GDP over time.
2b. Direction, not level
A phase is named by which way output is moving, not by how high it is. The National Bureau of Economic Research (NBER), which dates U.S. business cycles, says it directly: "Recessions and expansions refer to the direction of change in economic activity, not its level." So an economy climbing out of a trough is in an expansion as soon as output starts rising, even below its old peak.
You may have heard that a recession is two quarters in a row of falling real GDP. NBER does not use that rule. It defines a recession as "a significant decline in economic activity that is spread across the economy and that lasts more than a few months," and it points out that in 2001 "the recession did not include two consecutive quarters of decline in real GDP."
NBER does not judge by real GDP alone. It also reads monthly measures, above all employment and income, so a quarter of slight GDP growth inside a broad fall in jobs and income does not end a recession.
NBER also dates turning points to the month. A recession starts in the month after a peak and ends in the month of the trough.
Source: NBER, "Business Cycle Dating Procedure: Frequently Asked Questions" (revised October 7, 2025), read on October 14, 2026.
Quick check · Decide and justify
In Coldridge, real GDP fell in the first quarter of a year, rose slightly in the second and fell again in the third. Over those nine months, employment fell in almost every industry and household incomes dropped. Could this stretch be a recession?
Which reason supports your choice?
2c. Potential output
Potential output is the real GDP an economy produces when unemployment equals the natural rate of unemployment. That is why it is also called full-employment output. In 2.3 Unemployment you saw that the natural rate is frictional plus structural unemployment, so at potential output cyclical unemployment is zero.
Potential output is not the most an economy could ever squeeze out. For a while, firms can run extra shifts and hire people who would normally still be searching, which pushes unemployment below the natural rate and output above potential. It is not fixed either. As the labor force, capital and technology grow, potential output rises, which is why a business cycle graph draws it as an upward-sloping line.
So the unemployment rate tells you where output sits:
- Unemployment above the natural rate: actual output is below potential.
- Unemployment equal to the natural rate: actual output is at potential.
- Unemployment below the natural rate: actual output is above potential.
Quick check · Sort it
Each card describes a different economy. Tap a card, then tap where its actual output sits compared with its potential output.
Below potential
At potential
Above potential
2d. The output gap
The output gap is the difference between actual output and potential output. Always subtract in that order:
output gap = actual real GDP minus potential real GDP
The sign then tells you the direction. Suppose potential output is $900 billion.
- Real GDP of $870 billion gives $870 billion minus $900 billion = minus $30 billion, a negative output gap. Output is short of potential and unemployment is above the natural rate. Later in the course you will also hear it called a recessionary gap.
- Real GDP of $915 billion gives plus $15 billion, a positive output gap, also called an inflationary gap. Unemployment is below the natural rate.
A gap of zero means the economy is at full employment.
A negative gap and a recession are different facts. The gap compares output with potential at one moment, while the phase says which way output is moving. Just after a trough, output is rising (an expansion) and the gap is still negative.
Quick check · Calculate
Eskdale's real GDP this year is $2,460 billion, and its output gap, measured as actual output minus potential output, is plus $60 billion. What is Eskdale's potential output, in billions of dollars?
Part 3 Watch it done Reading Dovren's year
Watch each step, then do the last one yourself.
Economists estimate that Dovren's potential output this year is $3,200 billion and its natural rate of unemployment is 4.5%. This year Dovren's real GDP is $3,104 billion and its unemployment rate is 6.2%. Next year its potential output is expected to grow to $3,264 billion. What is Dovren's output gap this year, and by how much would its real GDP have to rise next year to close the gap?
Step 1 · Name the benchmark
Potential output is full-employment output: the real GDP Dovren produces when unemployment equals the natural rate of 4.5%. This year that is $3,200 billion.
Step 2 · Find this year's gap
The output gap is actual output minus potential output, in that order: $3,104 billion minus $3,200 billion = minus $96 billion. Real GDP is $96 billion short of potential.
Why this step?
Why does a negative gap fit an unemployment rate of 6.2%?
Potential output is the output produced at the natural rate of 4.5%. Producing less than that takes fewer workers, so unemployment sits above the natural rate, and 6.2% is above 4.5%.
Your step · Calculate
Dovren's real GDP this year is $3,104 billion. Its potential output is $3,200 billion this year and is expected to be $3,264 billion next year. By how many billion dollars would Dovren's real GDP have to rise next year to bring its output gap to zero?
billion dollars
Part 4 Try it Read real turning points
NBER publishes the dates of every U.S. peak and trough. These are its four most recent cycles, read from its table on October 14, 2026 (the table says its data were last updated on March 14, 2023). A recession starts in the month after the peak and ends in the month of the trough.
| Peak | Trough | Recession length (months) |
|---|---|---|
| July 1990 | March 1991 | 8 |
| March 2001 | November 2001 | 8 |
| December 2007 | June 2009 | ? |
| February 2020 | April 2020 | 2 |
Try it · Calculate
NBER dates a U.S. business cycle peak in December 2007 and the next trough in June 2009. A recession starts in the month after the peak and ends in the month of the trough. How many months did that recession last?
Now read a graph. A business cycle graph puts real GDP on the vertical axis and time on the horizontal, with a rising line for potential real GDP. Some graphs draw actual real GDP as a smooth curve and mark points T1, T2 and so on. The chart for Tavor, a fictional economy, plots it as one dot per quarter. Read a phase from the way the dots move from one quarter to the next, and the output gap from where each dot sits against the line.
Tavor's real GDP and potential output
Dots: real GDP each quarter. Line: economists' estimate of potential output.
Try it · Spot the error
Tavor's chart plots its real GDP for Quarters 1 to 6 as dots and its potential output as an upward-sloping line. A student wrote this reading of the chart. Tap the first line that goes wrong.
Try it · Match
Use Tavor's chart of real GDP by quarter. Tap a quarter, then tap what Tavor's economy is going through in that quarter.
Part 5 Explain it Write it the way the exam asks
Nothing you type leaves this page.
Free response is 33.35% of the exam score. This one is shaped like Question 2, Short.
Free-response practice · Question 2 style
Economists estimate that the country of Tolland has potential output of $1,800 billion and a natural rate of unemployment of 5%. This year Tolland's real GDP is $1,764 billion. (a) Calculate Tolland's output gap, measured as actual output minus potential output. Show your work. (b) Is Tolland's unemployment rate greater than, less than or equal to 5%? (c) Explain your answer to part (b). (d) Tolland's fall in output began when the world price of oil, which most of its firms use to make and ship their goods, rose sharply. Identify whether the fall started with a change in aggregate demand or in aggregate supply. Explain.
Model answer
(a) Output gap = $1,764 billion minus $1,800 billion = minus $36 billion. (b) Greater than 5%. (c) Potential output is the output produced when unemployment equals the natural rate. Tolland is producing less than that, so fewer people are working than at full employment and there is cyclical unemployment. (d) Aggregate supply. The oil price rise made production more costly for most firms, which cut how much they were willing to produce at given prices. The fall did not start with a cut in spending.
Score your own answer. This is a self-check, not a grade. Tick each point your answer makes.
Part 6 Check yourself Read a cycle from the data
Read the table first, then answer both questions from it.
Selbury is a fictional economy. Its statistics agency reported real GDP and economists' estimates of potential output for eight quarters in a row.
| Quarter | Real GDP | Potential output |
|---|---|---|
| 1 | 1,008 | 1,000 |
| 2 | 1,022 | 1,010 |
| 3 | 1,018 | 1,020 |
| 4 | 1,004 | 1,030 |
| 5 | 992 | 1,040 |
| 6 | 1,001 | 1,050 |
| 7 | 1,018 | 1,060 |
| 8 | 1,035 | 1,070 |
Case question 1 · Multiple choice
Which phase of the business cycle best describes Selbury's economy in Quarter 7?
Case question 2 · Select all
Using Selbury's real GDP and potential output by quarter, in which two quarters was Selbury's unemployment rate most likely below its natural rate? Select two.
Select 2 answers, then check.
The rest stand on their own and do not use the case.
Check yourself · Put it in order
Calder is producing at potential output when a wave of worry about the future sweeps through its households. Tap the events in the order they happen.
Check yourself · Fill the statement
Tap a blank, then tap a phrase.
Potential output is also called . It is the level of real GDP at which unemployment equals the , and it over time as the labor force, capital and technology grow.
Part 7 Keep it Keep it
From 2.3 Unemployment · Multiple choice
Over twenty years, a much larger share of a country's workers gets trained in the skills its growing industries hire for. Nothing else about its labor force changes. What most likely happens to the country's natural rate of unemployment?
From 2.6 Real v. Nominal GDP · Match
Tap a quantity, then tap how to calculate it.
In three lines
- Peaks and troughs are turning points; recession and expansion are the phases between them.
- A phase follows the direction of economic activity, not its level.
- Output gap = actual minus potential; potential is output at the natural rate of unemployment.
Exam strategy for this topic
- Section I, Multiple Choice: 60 questions in 70 minutes.
- Section II, Free Response: 3 questions in 60 minutes.
- This lesson's Explain it is shaped like free-response question 2, Short.
- A four-function calculator is allowed on both sections of the exam.
On a business cycle graph, label real GDP on the vertical axis, time on the horizontal axis, the potential output line, and each peak and trough. Name a phase by the direction real GDP is moving, and write the output gap as actual minus potential with its sign.
Questions students ask
What are the two phases of the business cycle?
Expansion, from a trough up to the next peak, and contraction, from a peak down to the next trough. A contraction that is significant, widespread and lasts more than a few months is what economists call a recession.
If output is rising but still below potential, which phase is the economy in?
An expansion. The phase follows the direction of real GDP, so an economy climbing out of a trough is expanding even while its output gap is negative.
Is a negative output gap the same thing as a recession?
No. The gap compares output with potential at one moment, and the phase says which way output is moving. Just after a trough, output is rising and the gap is still negative.
How can the unemployment rate tell me whether output is above or below potential?
Compare it with the natural rate. Unemployment above the natural rate means output is below potential, equal means output is at potential, and below means output is above potential.
How long did the 2007 to 2009 recession last?
NBER dates the peak in December 2007 and the trough in June 2009. Counting from the month after the peak through the trough month gives 18 months.
Course alignment, for teachers
AP Macroeconomics topic 2.7, Unit 2: Economic Indicators and the Business Cycle.
- Skill 1.A: Describe economic concepts, principles, or models.
This lesson maps all 5 essential knowledge statements of the topic to the part that teaches each one: 5 are checked by a scored question. The map is in the lesson file.