Unit 3 · Topic 3.1 · about 30 minutes · 7 parts · 10 scored checks, 1 of them multiple choice, plus 2 from earlier lessons
AP Macroeconomics 3.1: Aggregate Demand (AD)
Unit 3: 17 to 27% of the multiple-choice section
What you'll be able to do
- Define the aggregate demand (AD) curve, and explain why it slopes down and what shifts it, using a graph where it helps.
Key vocabulary
| Term | What it means | The exam trap |
|---|---|---|
| Aggregate demand (AD) | The relationship between the price level and the quantity of real output that households, firms, government and the rest of the world want to buy. | AD is drawn against the price level, so a rise in the price level is a movement up along AD and never a shift of the curve. |
| Consumption | Spending by households on goods and services for their own use. | Households buying a newly built house is investment, not consumption, so a housing boom raises I even though families do the buying. |
| Investment | Spending by firms on new machines, equipment and buildings, plus spending on newly built homes. | Buying shares of stock is not investment in AD; only spending on new machines, equipment, buildings and newly built homes counts. |
| Government spending | Purchases of goods and services by all levels of government. | Transfer payments such as unemployment benefits are not government spending in AD, because the government buys no goods or services with them. |
| Net exports | A country's exports minus its imports: foreign spending on its output, less its own spending on foreign output. | Imports are subtracted, so when home buyers switch to phones made overseas, net exports fall and AD shifts left. |
| Real wealth effect | A higher price level lowers what people's money and savings can buy, so households cut consumption. | Falling stock or home prices make households poorer and shift AD left; the real wealth effect is only the lost buying power from a higher price level, a movement along AD. |
| Interest rate effect | A higher price level raises the amount of money people want to hold, which pushes interest rates up and cuts spending paid for with borrowed money: investment, and consumer purchases such as cars. | Money demand is the first link: a higher price level means people want to hold more money, so interest rates rise and borrowing for investment and cars falls, which is a movement along AD. |
| Exchange rate effect | A higher price level makes a country's goods more expensive compared with foreign goods at the same exchange rate, so its net exports fall. | Prices abroad and the exchange rate stay the same in this effect, so it is the home price level rising that makes exports dearer and imports more attractive, a movement along AD rather than a shift. |
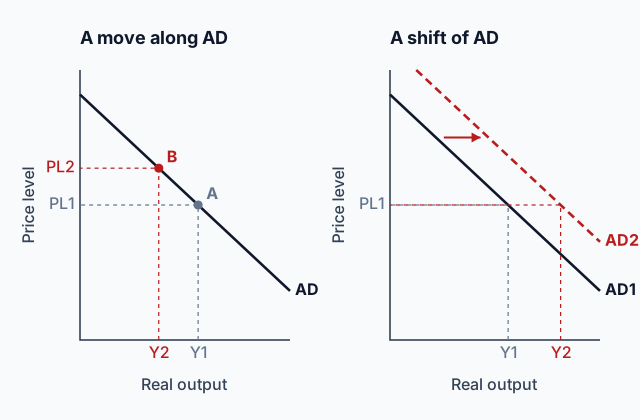 Tap to open the picture full size
Part 1 Think first Everything costs more at once
Guess before you learn. A wrong guess still makes the answer stick.
Predict first
Over one year, the price of nearly everything made in Talvora rises by about 10 percent, while prices in other countries stay where they were. Economists expect households, firms and foreign buyers to buy less of Talvora's output in total. What is the main reason?
In short. Aggregate demand (AD) shows how much real output households, firms, government and foreign buyers together want to buy at each price level.
- Real output demanded adds up consumption, investment, government spending and net exports (exports minus imports).
- A higher price level lowers the quantity of real output demanded, which is why the AD curve slopes down.
- A change in the price level moves the economy along AD; a change in any of the four kinds of spending for another reason shifts the whole curve.
Part 2 Learn it Four short ideas, each checked as you go
2a. Four groups of buyers
In Unit 2 you added up GDP from spending. Aggregate demand starts from the same spending and asks a new question: at a given price level, how much real output does everyone want to buy?
The aggregate demand (AD) curve answers that for every price level at once. It shows the relationship between the price level and the quantity of real output demanded by four groups:
- Households buy goods and services for their own use: consumption (C).
- Firms buy new machines, equipment and buildings: investment (I). Newly built homes count here too.
- Government buys goods and services, from buses to teachers' work: government spending (G).
- The rest of the world buys this country's output: net exports (NX), which is exports minus imports.
So the real output demanded at a price level is C + I + G + (exports minus imports). Imports are subtracted because that spending buys output made somewhere else. A dollar spent on a laptop made overseas adds nothing to this country's aggregate demand.
Quick check · Sort it
Tap a headline, then tap the kind of spending it changes first.
Consumption
Investment
Government spending
Net exports
2b. Why AD slopes down
A higher price level means a smaller quantity of real output demanded, so the AD curve slopes down. The reason is not the one you learned for a single market. When one good gets more expensive, buyers switch to another good. When the whole price level rises, nearly everything made at home costs more, so that switch is not available. Economists give three other reasons, each starting from a rise in the price level:
- Real wealth effect. The cash and savings people hold now buy less, so households feel poorer and cut consumption.
- Interest rate effect. Buying the same goods takes more money, so people want to hold more money. That pushes interest rates up. Firms borrow less for machines and buildings, and families borrow less for new homes, so investment falls. Households also borrow less for cars and other big purchases, so consumption falls too.
- Exchange rate effect. Prices abroad have not changed. At the same exchange rate between this country's currency and others, foreign money now buys less of this country's output, so its goods are more expensive compared with foreign goods. Foreign buyers purchase fewer of its exports, its own buyers turn to imports, and net exports fall.
A fall in the price level runs all three the other way, and the quantity of real output demanded rises.
Quick check · Match
Tap a reason a demand curve slopes down, then tap the chain of events that goes with it.
2c. A movement along AD, or a shift of AD
The three effects explain a movement along the AD curve. The price level changes, and the economy slides to a different point on the same curve. The price level is on the vertical axis, so a change in it never moves the curve itself.
Any change in consumption, investment, government spending or net exports that is not caused by a change in the price level shifts the whole curve. If one of the four groups wants to buy more at every price level, AD shifts right: firms buy more delivery vans, or the government orders new trains. If one wants to buy less, AD shifts left.
Two questions sort any event. Did the price level cause the change? If so, the economy moves along AD. If not, whose spending changed, and which way?
Watch imports. When households switch to goods made abroad, imports rise, net exports fall, and AD shifts left.
Watch wealth too. When the price level rises, the money people hold buys less: that is the real wealth effect, a movement along AD. When stock prices or home prices fall, households are also poorer, but the price level did not cause it. They spend less at every price level, so AD shifts left.
Quick check · Fill the statement
Tap a blank, then tap a word or phrase.
Suppose the price level rises and nothing else changes. Buyers then want real output, which shows up as the AD curve. Suppose instead that foreign buyers lose interest in the country's films and video games, whatever its price level. Then the AD curve .
2d. Drawing AD and its shifts
A graph a grader can follow does these things:
- Labels the vertical axis Price level and the horizontal axis Real output (or Real GDP). Price and Quantity belong to one market's graph, not to the whole economy's.
- Draws AD sloping down, labeled AD1.
- Marks a starting price level, PL1, on the vertical axis and the real output demanded there, Y1, on the horizontal axis, with dashed lines to the curve.
- For a shift, draws the new curve labeled AD2 on the correct side, with an arrow from AD1 to AD2.
- Marks the new real output demanded at the same price level, Y2, on the horizontal axis.
The picture at the top of this page shows both cases. On the left, only the price level changes and the economy moves along one curve. On the right, spending changes at every price level and the curve itself moves.
Quick check · Sketch the graph
Economists in a country estimate the real output that households, firms, government and foreign buyers together want at each price level: $700 billion at a price level of 140, $800 billion at 130, $900 billion at 120, $1,000 billion at 110 and $1,100 billion at 100. Use that schedule to sketch the shape of the country's AD curve: drag the points so the curve falls or rises, and bends or runs straight, the way the schedule does. The exact heights are up to you.
One shape that fits
Drag a point up or down, or tap it and use the arrow keys. Only the shape is checked.
Part 3 Watch it done Guitars in fashion abroad
Watch each step, then do the last one yourself.
A hit film makes guitars built in Ambria fashionable in other countries, and music stores abroad triple their orders for them. Guitar prices in Ambria climb a little as the makers struggle to keep up. Decide what happens to Ambria's aggregate demand curve.
Step 1 · Name the spender
The buyers are music stores in other countries. Their purchases of Ambrian guitars are Ambria's exports, so the spending that changed is net exports.
Step 2 · Shift or movement?
The orders rose because tastes abroad changed. Ambria's price level did not cause them, so this is not one of the three slope effects. A change in a component that the price level did not cause shifts AD.
Why this step?
Why doesn't the rise in guitar prices make this a movement along AD?
A movement along AD comes from a change in the price level, the average price of all of Ambria's output. Guitar prices rose because of the extra orders, and one product's price is not the price level. The cause here is the change in what foreign buyers want.
Your step · Decide and justify
Finish the analysis. What happens to Ambria's aggregate demand curve?
Which reason supports your choice?
On the graph: price level on the vertical axis, real output on the horizontal, AD1 sloping down, and AD2 drawn to its right with an arrow from AD1 to AD2. At the unchanged price level PL1, the real output demanded rises from Y1 on AD1 to Y2 on AD2.
Part 4 Try it Draw it yourself
Try it · Spot the error
A student wrote this explanation of why the aggregate demand curve slopes down. Tap the first line with a mistake.
Part 5 Explain it Write it the way the exam asks
Nothing you type leaves this page.
Free response is 33.35% of the exam score. This one is shaped like Question 3, Short.
Free-response practice · Question 3 style
Corsana, a fictional country, has an aggregate demand curve that slopes down in the usual way.
(a) Draw a correctly labeled graph of aggregate demand. Label the curve AD1, and show a price level labeled PL1 and the real output demanded at that price level labeled Y1.
(b) Stock prices in Corsana fall sharply, and households that own shares see their wealth drop. On your graph in part (a), show the effect on aggregate demand. Label the real output demanded at PL1 after the change Y2.
(c) Identify the component of aggregate demand that changes in part (b). Explain.
(d) Suppose instead that Corsana's price level rises and nothing else changes. Will the quantity of real output demanded increase, decrease, or stay the same? Explain using the interest rate effect.
Model answer
(a) Price level on the vertical axis and real output on the horizontal axis, with a downward-sloping AD1. PL1 is marked on the vertical axis and Y1 on the horizontal axis, with dashed lines to the point on AD1. (b) AD shifts left to AD2, shown by an arrow from AD1 to AD2. At PL1, Y2 on AD2 is to the left of Y1. (c) Consumption. Households whose shares lost value feel less wealthy, so they spend less at every price level. The price level did not change, so this is a shift of AD, not the real wealth effect's movement along it. (d) It decreases. A higher price level means people need more money to buy the same goods, so they want to hold more money and interest rates rise. Higher interest rates cut borrowing for investment and for consumer purchases such as cars, so less real output is demanded, a movement up along AD1.
Score your own answer. This is a self-check, not a grade. Tick each point your answer makes.
Part 6 Check yourself Read a spending table
Read the table first, then answer both questions from it.
Lindmark is a fictional economy. Its statistics office estimated how much each group plans to spend on Lindmark's real output at three price levels, with everything else held constant. Each column is one price level; government means government spending.
| Price level | 100 | 110 | 120 |
|---|---|---|---|
| Consumption | 620 | 600 | 580 |
| Investment | 160 | 150 | 140 |
| Government | 200 | 200 | 200 |
| Exports | 110 | 104 | 98 |
| Imports | 90 | 94 | 98 |
Case question 1 · Calculate
Using the table of Lindmark's planned spending, what is the quantity of real output demanded in Lindmark at a price level of 110, in billions of base-year dollars?
Case question 2 · Multiple choice
In the table of Lindmark's planned spending, exports fall and imports rise as the price level rises from 100 to 120. Which reason for the downward slope of aggregate demand does that pattern show?
The rest stand on their own and do not use the case.
Check yourself · Sort it
Each event happens on its own. Tap an event, then tap what it does to the aggregate demand curve.
AD shifts right
AD shifts left
No shift: a movement along AD
Check yourself · Spot the error
A student described how they showed restaurants across the country buying new ovens and dishwashers on a graph of aggregate demand. Tap the first line with a mistake.
Part 7 Keep it Keep it
From 2.7 Business Cycles · Fill the statement
Tap a blank, then tap a phrase.
Potential output is also called . It is the level of real GDP at which unemployment equals the , and it over time as the labor force, capital and technology grow.
From 1.4 Demand · Sort it
Each event happens on its own in one town's market for movie tickets. Tap an event, then tap what it does to the demand curve for movie tickets in that town.
A movement along the demand curve
A shift of the demand curve
In three lines
- AD adds up consumption, investment, government spending and net exports (exports minus imports) at each price level.
- AD slopes down because of the real wealth, interest rate and exchange rate effects, not because buyers switch goods.
- A price-level change moves along AD; a spending change with any other cause shifts AD right or left.
Exam strategy for this topic
- Section I, Multiple Choice: 60 questions in 70 minutes.
- Section II, Free Response: 3 questions in 60 minutes.
- This lesson's Explain it is shaped like free-response question 3, Short.
- A four-function calculator is allowed on both sections of the exam.
On any AD question, ask first whether the price level caused the change: if it did, move along AD; if it did not, name the component that changed and shift the whole curve. Label the axes Price level and Real output, number the curves AD1 and AD2, and draw the arrow between them.
Questions students ask
Why doesn't AD slope down for the same reason the demand curve for pizza does?
When pizza gets more expensive, you switch to tacos. When the whole price level rises, nearly everything made at home costs more, so that switch is gone. AD slopes down because of the real wealth, interest rate and exchange rate effects instead.
Is a newly built house consumption or investment?
Investment, even though a family buys it.
If stock prices crash, is that the real wealth effect?
No. The real wealth effect comes from a higher price level, and it moves the economy along AD. A stock crash makes households poorer while the price level stays put, so consumption falls at every price level and AD shifts left.
Why are imports subtracted when I add up aggregate demand?
Spending on imports buys output made in another country. A dollar spent on a laptop made overseas adds nothing to this country's aggregate demand, so imports come off inside net exports.
Does a fall in the price level shift AD to the right?
No. A lower price level runs all three effects in reverse, so the quantity of real output demanded rises, but the economy slides down along the same AD curve.
Course alignment, for teachers
AP Macroeconomics topic 3.1, Unit 3: National Income and Price Determination.
- Skill 4.A: Draw an accurately labeled graph or visual to represent an economic model or market.
This lesson maps all 3 essential knowledge statements of the topic to the part that teaches each one: 3 are checked by a scored question. The map is in the lesson file.