Unit 3 · Topic 3.3 · about 30 minutes · 7 parts · 9 scored checks, 1 of them multiple choice, plus 2 from earlier lessons
AP Macroeconomics 3.3: Short-Run Aggregate Supply (SRAS)
Unit 3: 17 to 27% of the multiple-choice section
What you'll be able to do
- Define the short-run aggregate supply (SRAS) curve, and explain why it slopes upward and what shifts it, using a graph where it helps.
- Explain how a movement along the SRAS curve ties a rising price level, and inflation, to lower unemployment, using a graph where it helps.
Key vocabulary
| Term | What it means | The exam trap |
|---|---|---|
| Short-run aggregate supply (SRAS) curve | The curve showing the relationship between the price level and the quantity of real output firms across an economy supply while some wages and prices are fixed. | Leftward shifts of SRAS also look like upward shifts on the graph, yet they mean less real output at every price level, not more. |
| Sticky wages and prices | Wages and prices that do not adjust right away when the price level changes, often because they are set by contracts. | Resources moving from one good to another explain one market's supply curve; SRAS slopes up because wages and some input prices lag behind a rising price level. |
| Production costs | What firms pay for the inputs they use, such as wages, energy and raw materials; a change in them across the economy shifts SRAS. | Only a change in costs across the economy shifts SRAS, so a higher price level, which raises firms' selling prices, moves the economy along SRAS instead. |
| Inflationary expectations | The inflation rate that workers and firms expect in the future, which shapes the nominal wage increases they agree to. | Higher expected inflation shifts SRAS left through the bigger raises written into new wage contracts, even before actual prices have risen. |
| Short-run trade-off between inflation and unemployment | The pattern along the SRAS curve in which a higher price level comes with more output and employment and a lower unemployment rate. | With the labor force held constant, more output along SRAS means more employment and a lower unemployment rate, but the trade-off lasts only while wages and some prices are sticky. |
 Tap to open the picture full size
Part 1 Think first Prices rise, pay does not
Guess before you learn. A wrong guess still makes the answer stick.
Predict first
In January, Brightwater Toys signed contracts that fix its workers' hourly pay and the price of the plastic it buys for the rest of the year. By June, prices across the whole economy, including the prices its toys sell for, are 6 percent higher than in January. Over the next few months, what is Brightwater most likely to do?
In short. The short-run aggregate supply (SRAS) curve shows how much real output firms across an economy will supply at each price level while some wages and prices are still fixed.
- SRAS slopes upward because wages and some other input prices are sticky in the short run.
- Anything that changes production costs across the economy, including a change in inflationary expectations, shifts SRAS; a change in the price level moves the economy along it.
- Along SRAS, a higher price level comes with more output and employment and lower unemployment: a short-run trade-off between inflation and unemployment.
Part 2 Learn it Four short ideas, each checked as you go
2a. What the SRAS curve shows
Aggregate demand tells you how much real output buyers want at each price level. Short-run aggregate supply (SRAS) is the sellers' side. The SRAS curve describes the relationship between the price level and the quantity of goods and services that firms across the whole economy supply.
It goes on the same axes as AD: Price level up the side and Real output along the bottom. Each point pairs one price level with the total real output firms would produce at that price level in the short run. The curve slopes upward: a higher price level goes with more real output supplied, and a lower price level with less.
Keep the labels exact. The price level is an average of all prices, not the price of one good, and real output is everything the economy produces, not one product. A graph labeled Price and Quantity is a graph of one market, and a free-response grader reads it that way.
Quick check · Sketch the graph
Northmoor's short-run aggregate supply schedule: at a price level of 96, firms supply $600 billion of real output; at 100, $650 billion; at 104, $700 billion; at 108, $750 billion; and at 112, $800 billion. Sketch Northmoor's SRAS curve: drag one point for each level of real output so your curve follows the same pattern as the schedule. The exact price levels are not needed.
One shape that fits
Drag a point up or down, or tap it and use the arrow keys. Only the shape is checked.
2b. Why SRAS slopes upward: sticky wages and prices
Many costs do not change the moment the price level does. Wages are the big one. Employers and workers often agree on pay for a year or more, and even without a contract, few firms rewrite pay every month. Some other input prices are fixed for a while too: rent under a lease, a price set in a supply contract. Economists call these sticky wages and prices.
Now let the price level rise. Firms sell their output for more, but much of what they pay out has not moved yet. Output that did not cover its cost last month covers it now, so firms across the economy produce more. If the price level falls, the reverse happens: selling prices drop while costs stay stuck, and firms cut back.
This is not the reason one market's supply curve slopes up. When only the price of printer paper rises, paper mills pull workers and machines away from making other things. When the price level rises, nearly every price rises together, so there is no better-paid product to move toward. SRAS slopes up because costs lag behind selling prices.
Quick check · Decide and justify
Over a few months, the price level across an economy rises 4 percent. In the short run, what happens to the total real output its firms supply?
Which reason supports your choice?
2c. What shifts SRAS
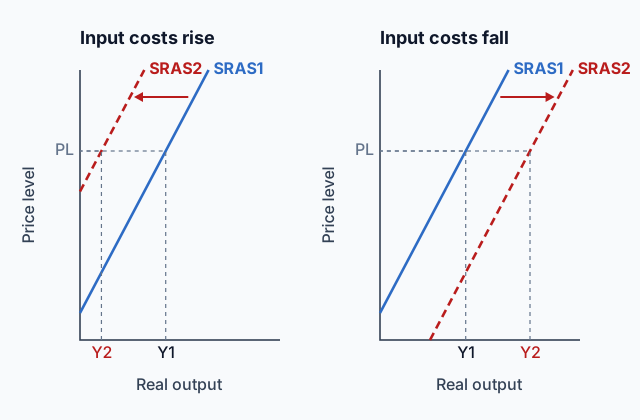
A change in the price level moves the economy along SRAS. The whole curve shifts when something changes production costs for firms across the economy at every price level. The rule is short: any factor that changes production costs shifts SRAS.
- Nominal wages. Higher pay per hour raises costs, so firms supply less at every price level: SRAS shifts left. Lower nominal wages shift it right.
- Prices of widely used inputs, such as energy and raw materials. More expensive inputs shift SRAS left; cheaper ones shift it right.
- Inflationary expectations. If workers and firms expect prices to rise faster, workers ask for bigger raises so their pay keeps up, and new wage contracts build those raises in. Costs rise, and SRAS shifts left. Lower expected inflation means smaller raises and a shift right.
- Business taxes, subsidies and regulation. A new tax on businesses, or a rule that makes producing more costly, raises costs and shifts SRAS left. A subsidy paid to producers lowers their costs and shifts it right.
The left panel of the diagram at the top of this page shows a shift left: at the same price level PL, firms now supply Y2 instead of Y1. A shift left is also a shift up, which can read like more. It means less output at every price level.
Quick check · Sort it
Each event happens on its own. Tap an event, then tap what it does to short-run aggregate supply.
SRAS shifts left
SRAS shifts right
No shift of SRAS
2d. Moving along SRAS: inflation and unemployment
Go back to a move along the curve. When the price level rises and the economy slides up SRAS, firms produce more real output. Producing more takes more workers, so employment rises. If the labor force stays the same size, more people working means fewer people looking for work, so the unemployment rate falls.
Run it the other way and a falling price level comes with less output, fewer jobs and a higher unemployment rate.
So along SRAS, a rising price level, which is inflation, comes with lower unemployment, and slower inflation comes with higher unemployment. Economists call this the short-run trade-off between inflation and unemployment. It lasts only while wages and some prices are sticky. Once they catch up, the reason firms produced more is gone. A later unit draws this trade-off as a curve of its own.
Quick check · Put it in order
In an economy, nominal wages are fixed by contracts and the labor force does not change. Tap the steps in the order they happen when the price level rises.
Part 3 Watch it done Prices rise while wages wait
Watch each step, then do the last one yourself.
Tavira's labor force is 50 million people, and it stays that size. Nominal wages are set by contracts with another year to run, and nothing else changes firms' costs. At a price level of 100, Tavira's firms supply $800 billion of real output and employ 46.0 million workers. The price level then rises to 105. Tavira's SRAS curve shows firms now supplying $840 billion of real output, and producing the extra output takes 1.2 million more workers. What is Tavira's unemployment rate now?
Step 1 · Name the move
Only the price level changed. Wages and other costs did not, so this is a move along Tavira's SRAS curve, from $800 billion to $840 billion of real output. The curve itself did not shift.
Step 2 · Say why output rose
Firms now sell at prices 5 percent higher, while the wages they pay are fixed by contract. Output that did not pay at a price level of 100 pays at 105, so firms produce it.
Step 3 · Count the workers
Employment rises by 1.2 million, from 46.0 million to 47.2 million workers. The labor force is still 50 million.
Why this step?
Why does it matter that the labor force stays at 50 million?
The unemployment rate is the number unemployed as a share of the labor force. If the labor force grew along with the jobs, more jobs would not have to mean a lower rate. Holding it fixed means every new job comes out of the unemployed.
Your step · Calculate
Finish it. Tavira's labor force is 50 million and 47.2 million people are now employed. What is Tavira's unemployment rate, in percent?
%
Part 4 Try it Draw it yourself
What to watch for. Every situation here changes what producing costs. Decide whether firms' costs rise or fall at every price level before you touch a curve. For the one about expected inflation, ask what workers and firms write into their next wage contracts.
Part 5 Explain it Write it the way the exam asks
Nothing you type leaves this page.
Free response is 33.35% of the exam score. This one is shaped like Question 3, Short.
Free-response practice · Question 3 style
Halvard is a fictional country. For the past three years, workers and firms there have expected inflation of about 5 percent a year.
(a) Draw a correctly labeled graph of short-run aggregate supply for Halvard. Label the curve SRAS1.
(b) Halvard's workers and firms now come to expect inflation of only 2 percent a year from here on. On your graph in part (a), show the effect on short-run aggregate supply. Label the new curve SRAS2.
(c) Explain why the change in part (b) shifts short-run aggregate supply in the direction you showed.
(d) Explain why SRAS1 slopes upward.
Model answer
(a) Price level on the vertical axis and real output on the horizontal axis, with an upward-sloping curve labeled SRAS1. (b) SRAS2 drawn to the right of SRAS1, with an arrow from SRAS1 to SRAS2. (c) Expecting slower inflation, workers need smaller raises to keep what their pay buys, so the wage contracts they sign build in smaller nominal wage increases than before. Labor then costs firms less than it would have, so firms supply more real output at every price level and SRAS shifts right. (d) Nominal wages and some other input prices are sticky in the short run, often fixed by contracts. When the price level rises, firms' selling prices rise but those costs do not, so producing more output becomes profitable and firms supply more.
Score your own answer. This is a self-check, not a grade. Tick each point your answer makes.
Part 6 Check yourself Read a schedule that moved
Read the case and the table first, then answer both questions from them.
Corvania, a fictional economy, publishes a short-run aggregate supply schedule: the real output its firms would supply at each price level. In February, Corvania began charging every business a new tax equal to 4 percent of the wages it pays. Wage rates themselves, and the prices of energy and raw materials, did not change.
| Price level | January | December |
|---|---|---|
| 100 | 600 | 480 |
| 110 | 680 | 560 |
| 120 | 760 | 640 |
| 130 | 840 | 720 |
Case question 1 · Multiple choice
Which statement describes how Corvania's short-run aggregate supply changed between January and December?
Case question 2 · Calculate
Use only the January column of Corvania's short-run aggregate supply schedule. If the price level rises from 110 to 130 with nothing else changing, by how many billion dollars does the real output firms supply change? Give a negative number for a decrease.
The rest stand on their own and do not use the case.
Check yourself · Spot the error
A student explained the effect of a sharp, lasting rise in the prices of copper and aluminum on short-run aggregate supply. Tap the first line with a mistake.
Check yourself · Fill the statement
An economy moves up along its SRAS curve while its labor force stays the same size. Tap a blank, then tap a word or phrase.
The price level rises, firms supply real output, and the unemployment rate . Along SRAS, a lower inflation rate comes with unemployment.
Part 7 Keep it Keep it
From 3.2 Multipliers · Decide and justify
Households in Country A spend 90 cents of each extra dollar of disposable income. Households in Country B spend 60 cents. Which country has the larger expenditure multiplier?
Which reason supports your choice?
From 2.5 Costs of Inflation · Fill the statement
Tap a blank, then tap a word or phrase.
Tomas would lend $1,000 for a year at 2% if prices were steady. Tomas and the borrower both expect prices to rise 5%, so the rate they agree on is 2%. Over the year, prices rise exactly 5%. gains at the other's expense, because the inflation was .
In three lines
- SRAS slopes up because sticky wages make more output pay at a higher price level.
- Production costs, including expected inflation via wage contracts, shift SRAS.
- Along SRAS, higher inflation comes with lower unemployment in the short run.
Exam strategy for this topic
- Section I, Multiple Choice: 60 questions in 70 minutes.
- Section II, Free Response: 3 questions in 60 minutes.
- This lesson's Explain it is shaped like free-response question 3, Short.
- A four-function calculator is allowed on both sections of the exam.
Before you move SRAS, say what happened to firms' costs at every price level; if nothing did, the curve stays put. For a question about expected inflation, trace the change through the next wage contract to costs, then to the shift.
Questions students ask
Why does SRAS slope up?
Wages and some other input prices are sticky, often fixed by contracts. When the price level rises, firms sell for more while those costs stay put, so output that did not pay before pays now and firms produce more.
Does expecting higher inflation really shift SRAS?
Yes, to the left. Workers ask for bigger raises so their pay keeps up, new contracts build those raises in, and higher labor costs mean firms supply less at every price level.
Is a new tax on businesses an SRAS shifter or an AD shifter?
A tax on businesses raises what producing costs, so SRAS shifts left. A change in what buyers want to spend is what moves AD.
Why does unemployment fall as the economy moves up SRAS?
More output takes more workers. If the labor force stays at 50 million and employment rises from 46.0 million to 47.2 million, the unemployment rate falls from 8.0 percent to 5.6 percent.
Is the price level the same thing as the price of a product?
No. The price level is an average of all prices in the economy, which is why the axis reads Price level and not Price.
Course alignment, for teachers
AP Macroeconomics topic 3.3, Unit 3: National Income and Price Determination.
- Skill 4.A: Draw an accurately labeled graph or visual to represent an economic model or market.
This lesson maps all 4 essential knowledge statements of the topic to the part that teaches each one: 4 are checked by a scored question. The map is in the lesson file.