Unit 4 · Topic 4.5 · about 30 minutes · 7 parts · 12 scored checks, 2 of them multiple choice, plus 2 from earlier lessons
AP Macroeconomics 4.5: The Money Market
Unit 4: 18 to 23% of the multiple-choice section
What you'll be able to do
- Define the money market, money demand and money supply using a graph, and explain how the nominal interest rate relates to the quantity of money demanded and the quantity supplied.
- Define equilibrium in the money market using a graph.
- Explain, using a graph, how the nominal interest rate adjusts to bring the money market back to equilibrium.
- Explain, using a graph, what shifts money demand and money supply, and how each shift changes the equilibrium nominal interest rate.
Key vocabulary
| Term | What it means | The exam trap |
|---|---|---|
| Money market | The market in which the demand for money and the supply of money set the equilibrium nominal interest rate. | Label the vertical axis the nominal interest rate, never the real interest rate, which belongs on the loanable funds graph. |
| Money demand | The quantity of money people want to hold at each nominal interest rate, which falls as the rate rises. | A change in the price level or real GDP shifts MD, while a change in the nominal interest rate is only a movement along it. |
| Money supply | The quantity of money in the economy, which, given the monetary base the central bank determines, does not depend on the nominal interest rate. | Draw MS as a vertical line, because a higher interest rate creates no currency and no reserves, so the quantity of money is the same at every rate. |
| Nominal interest rate | The interest rate in dollars, with no adjustment for inflation; in the money market it is the opportunity cost of holding money. | Higher bond prices mean a lower interest rate, so when people spend surplus money on bonds the rate falls rather than rises. |
| Equilibrium (money market) | The nominal interest rate at which the quantity of money demanded equals the quantity of money supplied. | Because MS is vertical, a shift of MD changes only the equilibrium rate and leaves the quantity of money at Q1. |
| Monetary policy | A central bank's actions to change the money supply or interest rates. | Central bank bond purchases and sales move MS, not MD, so under limited reserves a sale shifts MS left and raises the nominal interest rate. |
 Tap to open the picture full size
Part 1 Think first A year of higher prices
Guess before you learn. A wrong guess still makes the answer stick.
Predict first
Over one year, the prices of nearly everything in Halvany rise about 10 percent. Families and stores need more cash and bigger checking balances just to pay for the same things. Halvany's central bank keeps the total amount of money in the economy the same. What most likely happens to interest rates in Halvany?
In short. The money market sets the nominal interest rate where the quantity of money people want to hold equals the quantity of money there is.
- Money demand slopes down because the nominal interest rate is the opportunity cost of holding money.
- Money supply is vertical: given the monetary base the central bank sets, the quantity of money does not depend on the interest rate.
- A shift of either curve changes the equilibrium nominal interest rate.
Part 2 Learn it Four short ideas, each checked as you go
2a. Why people hold less money when rates are high
The money market is where the quantity of money people want to hold meets the quantity of money there is. Its price is the nominal interest rate.
Money demand (MD) shows how much money households and firms want to hold at each nominal interest rate. You saw in 4.1 that holding money is not free. Cash and checking balances earn little or nothing, so every dollar you hold gives up the interest it could have earned in a bond. The nominal interest rate is the opportunity cost of holding money.
When the rate is high, holding money is expensive, so people keep less of it and move the rest into bonds. When the rate is low, holding money costs little and they keep more. That inverse relationship makes money demand slope down, on a graph with the nominal interest rate on the vertical axis and the quantity of money on the horizontal axis.
Why nominal and not real? Inflation shrinks the buying power of money and of bonds alike, so what you give up by holding money instead of a bond is the bond's whole nominal interest.
Quick check · Sketch the graph
Households and firms in Talloway want to hold $200 billion of money when the nominal interest rate is 9 percent, $300 billion at 7 percent, $400 billion at 5 percent, $500 billion at 3 percent and $600 billion at 1 percent. Use that schedule to sketch the shape of Talloway's money demand curve: drag the points so the curve falls or rises, and bends or runs straight, the way the schedule does. The exact heights are up to you.
One shape that fits
Drag a point up or down, or tap it and use the arrow keys. Only the shape is checked.
2b. Why money supply is a vertical line
Money supply (MS) is the quantity of money in the economy. The central bank determines the monetary base, the currency and bank reserves you met in 4.3. In an economy with limited reserves, banks lend out their excess reserves, and the money multiplier from 4.4 turns that base into a money supply.
Given that base, the quantity of money does not depend on the nominal interest rate. A higher rate prints no currency and creates no reserves, and in this model banks already lend all the excess reserves they have. So at 2 percent or at 8 percent the quantity of money is the same, and MS is drawn as a vertical line at that quantity.
The line moves only when something changes the quantity of money itself, and that is the central bank's job. Changing it is monetary policy, the subject of 4.6.
One warning before you draw: this graph's vertical axis is the nominal interest rate. The real interest rate belongs on a different graph, loanable funds, in 4.7.
Quick check · Decide and justify
A classmate drawing the money market slopes the money supply curve upward, saying a higher nominal interest rate brings more money into the economy. In the model, the central bank determines the monetary base. Is the classmate's curve right?
Which reason supports your choice?
2c. Equilibrium, and how the rate gets there
Put the two curves on one graph. Equilibrium in the money market is at the nominal interest rate where the quantity of money demanded equals the quantity supplied, where MD crosses MS. Mark that rate i1 and the quantity Q1.
At any other rate the market is in disequilibrium, and bonds do the adjusting.
Above i1, people want to hold less money than there is: a surplus of money. They spend the money they do not want on bonds. More buyers push bond prices up, and as you saw in 4.1, a higher price for a bond means a lower interest rate on it. Rates keep falling until people are content to hold all the money there is.
Below i1, people want more money than there is: a shortage of money. They sell bonds to get it, bond prices fall, and interest rates rise back to i1.
Equilibrium in the money market
Downward-sloping MD crosses the vertical MS at the equilibrium nominal interest rate, i1, and quantity of money, Q1.
Quick check · Put it in order
The nominal interest rate in a country's money market is higher than its equilibrium level. Tap the steps in the order they happen as the rate returns to equilibrium.
2d. What moves each curve
Money demand shifts when people want to hold more or less money at every interest rate.
- A higher price level: the same purchases take more dollars, so MD shifts right. A lower price level shifts it left.
- Higher real GDP: more output means more purchases to pay for, so MD shifts right. Lower real GDP shifts it left.
That is the Think first answer. MD shifted right along a money supply that did not move, so the rate rose, and the quantity of money stayed at Q1 because MS stayed put. A change in the nominal interest rate on its own never shifts MD; it is a movement along the curve.
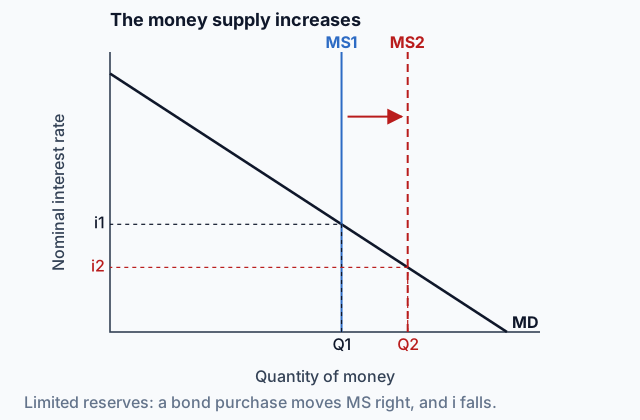
Money supply shifts when the central bank changes the quantity of money. In an economy with limited reserves, a central bank purchase of bonds adds reserves, banks lend them, and MS shifts right: the rate falls and the quantity of money rises. A sale shifts MS left. Lowering the required reserve ratio from 4.4 lets banks lend more of each deposit, so MS shifts right; raising it shifts MS left. 4.6 covers how these tools work when reserves are ample.
Quick check · Sort it
Each change happens on its own in an economy whose banking system has limited reserves. Tap a change, then tap what it does on the money market graph.
Money demand shifts right
Money demand shifts left
Money supply shifts right
Money supply shifts left
No shift: a movement along money demand
Part 3 Watch it done A bond purchase in Kelvara
Watch each step, then do the last one yourself.
Kelvara's banking system has limited reserves. In its money market, households and firms want to hold $400 billion of money at a nominal interest rate of 6 percent, and along its money demand curve each extra $50 billion they hold goes with a rate 1 percentage point lower. The money supply is $400 billion. The central bank buys government bonds, and the money supply rises to $550 billion. Find the new equilibrium nominal interest rate.
Step 1 · Find the starting point
MS1 is vertical at $400 billion and crosses MD where people want to hold exactly $400 billion. So i1 = 6 percent and Q1 = $400 billion.
Step 2 · Pick the curve and the side
With limited reserves, the bond purchase adds reserves that banks lend, and the money supply rises. MS shifts right, from MS1 at $400 billion to MS2 at $550 billion.
Why this step?
Why does money demand stay where it is?
Nothing in the story changes the price level or real GDP, so at each interest rate people want the same amount of money as before. Only the rate they face changes, which is a movement along MD.
Step 3 · Read the new crossing
At 6 percent there is now a surplus of money, so people buy bonds and the rate falls until they want to hold all $550 billion.
Your step · Calculate
Kelvara's banking system has limited reserves. In its money market, households and firms want to hold $400 billion of money at a nominal interest rate of 6 percent, and along its money demand curve each extra $50 billion they hold goes with a rate 1 percentage point lower. After the central bank buys government bonds, the money supply rises from $400 billion to $550 billion. What is the new equilibrium nominal interest rate, in percent?
percent
Part 4 Try it Draw it yourself
One step further. When both curves move at once, take each shift on its own.
Try it · Multiple choice
The banking system in Pellbridge has limited reserves. In the same quarter, Pellbridge's central bank sells government bonds and real GDP rises. Draw the money supply curve as vertical, as this lesson does. Compared with the starting equilibrium in the money market, what happens to the nominal interest rate and the quantity of money?
Try it · Match
Tap a shift in the money market, then tap what happens to the equilibrium.
Part 5 Explain it Write it the way the exam asks
Nothing you type leaves this page.
Free response is 33.35% of the exam score. This one is shaped like Question 2, Short.
Free-response practice · Question 2 style
The banking system in Vessany has limited reserves.
(a) Draw a correctly labeled graph of the money market. Label the equilibrium nominal interest rate i1 and the equilibrium quantity of money Q1.
(b) Vessany's central bank sells government bonds. On your graph in part (a), show the effect on the money market. Label the new nominal interest rate i2 and the new quantity of money Q2.
(c) Suppose instead that the money supply does not change and real GDP in Vessany increases. Will the equilibrium nominal interest rate increase, decrease, or stay the same? Explain.
Model answer
(a) The nominal interest rate is on the vertical axis and the quantity of money on the horizontal axis. MD slopes down and MS1 is vertical; they cross at i1 and Q1, marked on the axes with dashed lines. (b) The sale takes reserves out of the banking system, so money supply shifts left from MS1 to MS2, shown by an arrow. MS2 crosses MD at i2, above i1, and at Q2, to the left of Q1. (c) It increases. With more real GDP, people make more purchases and want to hold more money at every interest rate, so money demand shifts right along the unchanged money supply, and the new crossing is at a higher nominal interest rate.
Score your own answer. This is a self-check, not a grade. Tick each point your answer makes.
Part 6 Check yourself Read the money market from a table
Read the table first, then answer the questions from it.
Larkmoor, a fictional economy, has a banking system with limited reserves, and its money supply is $600 billion. The table shows how much money households and firms in Larkmoor want to hold at each nominal interest rate.
| Nominal interest rate | Quantity of money demanded (billions of dollars) |
|---|---|
| 2% | 800 |
| 3% | 700 |
| 4% | 600 |
| 5% | 500 |
| 6% | 400 |
| 7% | 300 |
Case question 1 · Fill the statement
Tap a blank, then tap an amount.
Larkmoor's money market is in equilibrium at a nominal interest rate of , where the quantity of money demanded equals .
Case question 2 · Multiple choice
Suppose the nominal interest rate in Larkmoor were 6 percent. Which describes Larkmoor's money market at that rate?
Case question 3 · Calculate
Larkmoor's money supply is $600 billion, and its money market starts at the equilibrium given by its money demand table. The price level in Larkmoor then rises, and households and firms want to hold $100 billion more money at every nominal interest rate. The money supply does not change. What is the new equilibrium nominal interest rate, in percent?
The rest stand on their own and do not use the case.
Check yourself · Select all
Along one money demand curve, compare a nominal interest rate of 6 percent with a rate of 3 percent. Which two statements are true at 6 percent? Select two.
Select 2 answers, then check.
Check yourself · Spot the error
A student showed the effect of a fall in Quillon's price level on its money market, with the money supply unchanged. Tap the first line that goes wrong.
Part 7 Keep it Keep it
From 4.4 Banking and the Expansion of the Money Supply · Decide and justify
Esterra is an invented economy whose banks have limited reserves and a required reserve ratio of 20 percent. Its banks receive $10 billion of new excess reserves, and an analyst says the money supply will now grow by exactly $50 billion. Will it?
Which reason supports your choice?
Teravia, a fictional country, reports the interest rate on newly issued government bonds each year:
| Year | Interest rate |
|---|---|
| Year 1 | 2% |
| Year 2 | 5% |
| Year 3 | 3% |
| Year 4 | 6% |
From 4.1 Financial Assets · Multiple choice
A long-term Teravian government bond issued in Year 1 pays a fixed $20 a year for every $1,000 it cost. Assume nothing affects its price except the interest rate on newly issued Teravian government bonds. In which year would it sell for the lowest price?
In three lines
- Money demand slopes down because the nominal interest rate is the cost of holding money; money supply is vertical at the quantity the monetary base allows.
- Away from equilibrium, people buy or sell bonds until the quantity of money demanded equals the quantity supplied.
- The price level and real GDP move MD, monetary policy moves MS, and either shift changes the equilibrium nominal interest rate.
Exam strategy for this topic
- Section I, Multiple Choice: 60 questions in 70 minutes.
- Section II, Free Response: 3 questions in 60 minutes.
- This lesson's Explain it is shaped like free-response question 2, Short.
- A four-function calculator is allowed on both sections of the exam.
Label the curves MD, MS1 and MS2, draw an arrow showing the shift, and mark i1, i2, Q1 and Q2 on the axes with dashed lines. Then write which way the nominal interest rate moves and which curve moved to cause it.
Questions students ask
Why does money demand slope down?
The nominal interest rate is the opportunity cost of holding money. When the rate is high, every dollar held as cash or in checking gives up more interest, so people hold less money and more bonds.
Why is the money supply curve vertical?
The central bank sets the monetary base, and a higher interest rate creates no currency and no reserves. So the quantity of money is the same at 2 percent or 8 percent.
What happens if the interest rate is above equilibrium?
People hold more money than they want, a surplus. They buy bonds with it, bond prices rise, and the interest rate falls until the quantity of money demanded equals the quantity supplied.
Does a higher price level change the money supply or money demand?
Money demand. The same purchases now take more dollars, so people want more money at every rate and MD shifts right. With MS unchanged, the nominal interest rate rises and the quantity of money stays the same.
If the central bank sells bonds and real GDP rises at the same time, what happens to the interest rate?
It rises, because both shifts push it up: the sale moves MS left and higher real GDP moves MD right. The quantity of money falls, since it sits wherever the vertical MS is.
Course alignment, for teachers
AP Macroeconomics topic 4.5, Unit 4: Financial Sector.
- Skill 4.A: Draw an accurately labeled graph or visual to represent an economic model or market.
This lesson maps all 5 essential knowledge statements of the topic to the part that teaches each one: 5 are checked by a scored question. The map is in the lesson file.