Unit 4 · Topic 4.7 · about 30 minutes · 7 parts · 12 scored checks, 2 of them multiple choice, plus 2 from earlier lessons
AP Macroeconomics 4.7: The Loanable Funds Market
Unit 4: 18 to 23% of the multiple-choice section
What you'll be able to do
- Define the loanable funds market and the demand for and supply of loanable funds using a graph, and explain how the real interest rate relates to the quantity of loanable funds demanded and supplied.
- Define national savings in a closed economy and in an open economy.
- Define equilibrium in the loanable funds market using a graph.
- Explain, using a graph, how the real interest rate adjusts to bring the loanable funds market back to equilibrium.
- Explain, using a graph, what shifts the demand for and supply of loanable funds, and how each shift changes the equilibrium real interest rate and the equilibrium quantity of loanable funds.
Key vocabulary
| Term | What it means | The exam trap |
|---|---|---|
| Loanable funds market | The market in which savers supply funds and borrowers demand them, with the real interest rate as the price. | Put the real interest rate on the vertical axis of this graph; the nominal interest rate belongs to the money market. |
| Demand for loanable funds | The quantity of funds borrowers want at each real interest rate, which falls as the rate rises. | Government borrowing to cover a deficit can be drawn as DLF shifting right, so firms are not the only borrowers on the demand side. |
| Supply of loanable funds | The quantity of funds savers offer at each real interest rate, which rises as the rate rises. | A change in saving behavior shifts SLF, but a fall in the real rate only moves savers down along it to a smaller quantity supplied. |
| Real interest rate | The interest rate with inflation taken out, which measures what a loan's payments will actually buy. | Every shift of DLF or SLF changes it, yet a change in it never shifts either curve; it is a movement along both. |
| National savings | Private savings plus public savings, the funds an economy's own households, businesses and government provide. | Subtract a deficit rather than adding it: $640 billion of private savings with a $120 billion deficit gives national savings of $520 billion. |
| Public savings | The government's budget balance: tax revenue minus government spending, negative when the budget is in deficit. | Deficit spending makes public savings negative, so a deficit means less saving, never more. |
| Private savings | The part of after-tax income that households and businesses do not spend. | Households choosing to save a bigger share of each paycheck shifts SLF right and lowers the real rate, which is different from saving more only because the rate rose. |
| Net capital inflow | Funds that foreigners lend into a country minus funds its residents lend abroad, which can be negative. | Negative net capital inflow means more funds leave than come in, so investment ends up below national savings rather than above it. |
| Investment tax credit | A tax cut tied to buying new capital, which raises the demand for loanable funds at every real interest rate. | Check how the credit is paid for: if the government cuts its own spending by the same amount, the budget balance holds and only DLF shifts right. |
 Tap to open the picture full size
Part 1 Think first A country starts saving
Guess before you learn. A wrong guess still makes the answer stick.
Predict first
In Sundria, news of layoffs spreads, and over a few months households put a much larger share of every paycheck into savings accounts and bonds. A furniture maker plans to borrow to build a new warehouse. Compared with before the news, what interest rate is the furniture maker likely to be offered?
In short. The loanable funds market is where savers lend to borrowers, and the real interest rate is its price.
- The demand for loanable funds slopes down and the supply slopes up, both against the real interest rate.
- National savings is private savings plus public savings, and in an open economy investment equals national savings plus net capital inflow.
- A change in borrowing plans shifts demand, a change in saving behavior shifts supply, and government borrowing can be drawn as either.
Part 2 Learn it Four short ideas, each checked as you go
2a. Savers, borrowers and the real interest rate
The loanable funds market describes the behavior of savers and borrowers. Savers are the lenders: households that put part of their income into bank accounts and bonds, and a government that collects more in taxes than it spends. Borrowers are firms that want funds for new factories, equipment and software, and a government that spends more than it collects.
The price in this market is the real interest rate, the interest rate with inflation taken out (4.2). Savers care about what their interest will buy, and so do borrowers about what their payments will cost.
The demand for loanable funds (DLF) slopes down. At a high real rate, only a few projects earn enough to cover the cost of borrowing. As the rate falls, more projects pay off, so the quantity of loanable funds demanded rises.
The supply of loanable funds (SLF) slopes up. A higher real rate is a bigger reward for not spending today, so savers offer more.
The graph puts Real interest rate on the vertical axis and Quantity of loanable funds on the horizontal axis.
Quick check · Sketch the graph
Firms in a country want to borrow $200 billion when the real interest rate is 9%, $300 billion at 8%, $400 billion at 7%, $500 billion at 6% and $600 billion at 5%. Use that schedule to sketch the shape of the demand for loanable funds: drag the points so the curve falls or rises, and bends or runs straight, the way the schedule does. The exact heights are up to you.
One shape that fits
Drag a point up or down, or tap it and use the arrow keys. Only the shape is checked.
2b. National savings: where the funds come from
In an economy with no international borrowing or lending, the funds come from national savings, which has two parts.
- Private savings: what households and businesses save out of their income after taxes.
- Public savings: the government's budget balance, tax revenue minus government spending on purchases and transfer payments. A surplus is positive public savings. A deficit is negative public savings, so it subtracts.
National savings = private savings + public savings.
Say households and businesses save $500 billion and the government runs a $70 billion deficit. National savings = 500 + (−70) = $430 billion.
An open economy also trades funds with the rest of the world. Foreign savers lend into the country and its own savers lend abroad. Net capital inflow is the funds coming in minus the funds going out, and it can be negative. The funds available for investment are then:
Investment = national savings + net capital inflow.
With national savings of $430 billion and a net capital inflow of $50 billion, investment is $480 billion.
Quick check · Calculate
Doranth does no international borrowing or lending. This year its households and businesses save $640 billion out of their after-tax income. Its government collects $910 billion in taxes and spends $1,030 billion on purchases and transfer payments. What is Doranth's national savings, in billions of dollars?
2c. Equilibrium, and how the rate gets there
The market is in equilibrium at the real interest rate where the quantity of loanable funds demanded equals the quantity supplied. In the graph below that is a real rate of 6% and $400 billion. On a drawn graph, mark them r1 and Q1 with dashed lines to both axes.
Away from that rate, the market pushes back.
- Below equilibrium, borrowers want more than savers offer, a shortage of loanable funds. At 4%, borrowers want $600 billion and savers offer $200 billion, a shortage of $400 billion. Lenders can charge more, so the real rate rises, and as it rises borrowers cut back and savers offer more until the two quantities match.
- Above equilibrium, savers offer more than borrowers want, a surplus. Lenders compete for borrowers by cutting rates, so the real rate falls.
While the rate adjusts, the market moves along both curves. A change in the real interest rate never shifts DLF or SLF.
Equilibrium in the loanable funds market
DLF and SLF cross at a real interest rate of 6% and a quantity of $400 billion.
Quick check · Put it in order
A country's loanable funds market starts at a real interest rate lower than the equilibrium rate. Tap the steps in the order they happen.
2d. What shifts the curves
A curve shifts when something other than the real interest rate changes how much people want to borrow or lend at every rate.
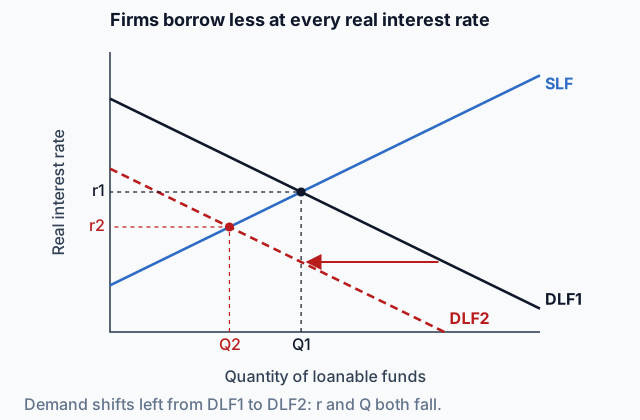
The demand for loanable funds moves with borrowing plans. An investment tax credit lets firms subtract part of what they spend on new capital from their taxes, so more projects pay and DLF shifts right. Better expected returns, from new technology or strong expected sales, also shift DLF right. Gloomier expectations shift it left.
The supply of loanable funds moves with saving behavior. When households decide to save more of their income, SLF shifts right. When they save less, it shifts left.
Government borrowing. A government with a deficit borrows by selling bonds. The released scoring guidelines accept either of two ways to show it: as more demand for loanable funds (DLF right), or as negative public savings that lowers national savings (SLF left). Either way the real interest rate rises. A surplus works in reverse.
In a tax credit question, check how it is paid for. If the government cuts its own spending by the same amount, the budget balance does not change and only DLF moves.
After any shift, the new equilibrium is where the moved curve crosses the one that stayed: label it r2 and Q2.
Quick check · Sort it
Each event happens on its own, and none changes the government's budget. Tap an event, then tap the shift it causes in the loanable funds market.
DLF shifts right
DLF shifts left
SLF shifts right
SLF shifts left
Part 3 Watch it done A government starts to borrow
Watch each step, then do the last one yourself.
Kalvia's government has balanced its budget for years. This year it spends $60 billion more on schools without raising taxes, and it sells bonds to borrow the difference. Show the effect on Kalvia's loanable funds market and decide what happens to the real interest rate.
Step 1 · Find the borrower
To cover the $60 billion deficit, the government sells bonds. Selling a bond is borrowing, so the government is now a borrower in the loanable funds market, next to firms.
Step 2 · Pick the curve and the side
At every real interest rate, total borrowing is now larger, so the demand for loanable funds shifts right, from DLF1 to DLF2. Draw an arrow from DLF1 to DLF2. (The released scoring guidelines also accept showing the deficit as lower public savings, SLF shifting left. Draw one of the two, not both.)
Why this step?
Why draw only one of the two shifts?
Both pictures show the same $60 billion deficit, one as a new borrower and one as public savings falling by $60 billion. Drawing both would count the deficit twice.
Step 3 · Mark the new equilibrium
Find where DLF2 crosses SLF, the curve that did not move. Drop dashed lines from that point to both axes and label them r2 and Q2.
Your step · Decide and justify
Finish the analysis. Kalvia's government borrows $60 billion to cover a new deficit. What happens to Kalvia's real interest rate?
Which reason supports your choice?
Part 4 Try it Draw it yourself
Funds that leave. Net capital inflow can be negative. When more funds leave a country than come in, it is a net capital outflow, and the money invested at home is less than national savings.
Try it · Calculate
Ardenia is an open economy. This year private savings is $410 billion and the government runs a $30 billion budget deficit. Ardenians lend $45 billion more abroad than foreigners lend into Ardenia, so net capital inflow is −$45 billion. How much is investment in Ardenia, in billions of dollars?
Two shifts at once. When two curves move together, decide what each does on its own. Where both push a result the same way, you know its direction. Where they push opposite ways, it depends on which shift is bigger, and without sizes you cannot say.
Try it · Multiple choice
In one year, households in a country put a bigger part of each paycheck into savings, and at the same time firms come to expect that new equipment will earn more and plan to buy more of it. Compared with the starting equilibrium in the loanable funds market, what can you say for certain?
Part 5 Explain it Write it the way the exam asks
Nothing you type leaves this page.
Free response is 33.35% of the exam score. This one is shaped like Question 2, Short.
Free-response practice · Question 2 style
Assume Mirevia is a closed economy whose government budget is balanced. (a) Draw a correctly labeled graph of the loanable funds market, showing the equilibrium real interest rate labeled r1 and the equilibrium quantity of loanable funds labeled Q1. (b) Geologists find a large deposit of lithium in Mirevia, and mining companies expect new mines there to be very profitable. On your graph, show the effect, labeling the new real interest rate r2 and quantity Q2. (c) Instead of the lithium discovery, suppose Mirevia's government pays for a new flood-defense program by selling bonds, and its budget moves into a deficit. Households' saving behavior at each real interest rate does not change. Will the quantity of loanable funds that Mirevia's households save increase, decrease, or stay the same? Explain using the loanable funds market.
Model answer
(a) Real interest rate on the vertical axis and quantity of loanable funds on the horizontal axis, a downward-sloping DLF1 and an upward-sloping SLF crossing at r1 and Q1, with dashed lines to both axes. (b) Mining companies now want to borrow more at every real interest rate, so DLF shifts right to DLF2, shown with an arrow. Where DLF2 crosses SLF, r2 is above r1 and Q2 is to the right of Q1, both marked on the axes. (c) The real interest rate increases, so the quantity households save increases. The government's borrowing increases the demand for loanable funds (or the deficit lowers public savings and the supply of loanable funds), and that pushes the real rate up. Households' saving behavior has not changed, so a higher real rate, a bigger reward for saving, moves them along it to a larger quantity saved.
Score your own answer. This is a self-check, not a grade. Tick each point your answer makes.
Part 6 Check yourself Read a market from its schedule
Read the table first, then answer both questions from it.
Selvara, a fictional economy, estimated how much its borrowers want to borrow and its savers want to lend at each real interest rate.
| Real interest rate | Quantity demanded | Quantity supplied |
|---|---|---|
| 2% | 640 | 400 |
| 3% | 600 | 440 |
| 4% | 560 | 480 |
| 5% | 520 | 520 |
| 6% | 480 | 560 |
| 7% | 440 | 600 |
Case question 1 · Multiple choice
Using Selvara's loanable funds schedule, what are the equilibrium real interest rate and the equilibrium quantity of loanable funds?
Case question 2 · Calculate
Using Selvara's loanable funds schedule, suppose the real interest rate were 3%. How large is the shortage of loanable funds at that rate, in billions of dollars?
The rest stand on their own and do not use the case.
Check yourself · Decide and justify
In Lorvan, firms cut their borrowing plans, and the real interest rate falls from 4% to 2%. Nothing changes households' saving plans. What happens to the quantity of loanable funds that savers supply?
Which reason supports your choice?
Check yourself · Fill the statement
Tap a blank, then tap a word.
A furniture company sells bonds to pay for a new warehouse, and a retired nurse buys some of them with her savings. In the loanable funds market, the company is on the side, the nurse is on the side, and the price that settles how much changes hands is the interest rate.
Check yourself · Select all
Brevia's government lets firms subtract 20% of what they spend on new machines from the taxes they owe. It cuts its own purchases of vehicles by the same amount, so its budget balance does not change, and households' saving behavior does not change. Which two results follow in Brevia's loanable funds market? Select two.
Select 2 answers, then check.
Part 7 Keep it Keep it
On September 16, 2026, the Federal Open Market Committee raised its target range for the federal funds rate by a quarter point, "in support of the Federal Reserve's dual mandate" of maximum employment and stable prices. Its statement said inflation was still above the Committee's 2 percent goal and that the increase would help bring it back sooner. It also said the Committee was keeping reserves in the banking system ample. The table shows U.S. rates on September 16, the day of the decision, and on September 17, the day the change took effect.
| Rate | Sept. 16 | Sept. 17 |
|---|---|---|
| Interest on reserves | 3.65% | 3.90% |
| Primary credit (discount) | 3.75% | 4.00% |
| Target range (fed funds) | 3.50% to 3.75% | 3.75% to 4.00% |
| Effective fed funds | 3.63% | 3.88% |
From 4.6 Monetary Policy · Multiple choice
Using the Federal Reserve's statement of September 16, 2026, which describes that decision? U.S. banks hold ample reserves.
These figures were read on October 14, 2026 from FRED, the economic data site of the Federal Reserve Bank of St. Louis. Buying a U.S. Treasury security is lending to the federal government. The 10-year breakeven inflation rate is, in FRED's words, what market participants expect inflation to be in the next 10 years, on average. The FRED series are DGS1 and DGS10 for the Treasury yields, CPIAUCSL for the consumer price index for all urban consumers, and T10YIE for the breakeven rate.
| Series | Date | Value |
|---|---|---|
| 1-year Treasury yield | Oct 1, 2025 | 3.62% |
| Consumer price index | Sep 2025 | 324.245 |
| Consumer price index | Sep 2026 | 336.298 |
| 10-year Treasury yield | Oct 13, 2026 | 5.21% |
| 10-year breakeven inflation | Oct 13, 2026 | 2.33% |
From 4.2 Nominal v. Real Interest Rates · Calculate
On October 1, 2025, a one-year U.S. Treasury security paid a nominal yield of 3.62%. The consumer price index was 324.245 in September 2025 and 336.298 in September 2026. Using the percent change in that index as the actual inflation rate for the year, what real interest rate did a buyer earn in hindsight? Give the percent to the nearest tenth, as a negative number if it is negative.
In three lines
- Savers supply loanable funds and borrowers demand them; the real interest rate is the price.
- National savings is private plus public savings; investment is national savings plus net capital inflow.
- Borrowing plans shift DLF, saving behavior shifts SLF, and a deficit raises the real rate.
Exam strategy for this topic
- Section I, Multiple Choice: 60 questions in 70 minutes.
- Section II, Free Response: 3 questions in 60 minutes.
- This lesson's Explain it is shaped like free-response question 2, Short.
- A four-function calculator is allowed on both sections of the exam.
Draw a deficit as one shift, DLF right or SLF left, never both, because drawing both counts the same deficit twice. Mark r1, r2, Q1 and Q2 on the axes, and say in words which curve moved and why.
Questions students ask
Why does the loanable funds market use the real interest rate and the money market the nominal one?
Savers and borrowers care about what a loan's payments will actually buy, so their price is the real rate. In the money market the cost of holding money is the full interest a bond would pay, which is the nominal rate.
How do I calculate national savings when the government has a deficit?
Add private savings and public savings, keeping the deficit's minus sign. If households and businesses save $640 billion and the government collects $910 billion while spending $1,030 billion, public savings is negative $120 billion and national savings is $520 billion.
What changes in an open economy?
Funds can flow in from abroad or out to it. Investment equals national savings plus net capital inflow, so with national savings of $380 billion and a net capital inflow of negative $45 billion, investment is $335 billion.
Does a government deficit shift demand or supply?
You can show it either way. The government is a new borrower, so DLF shifts right, or its negative public savings lowers national savings, so SLF shifts left. Draw one, and either way the real interest rate rises.
If people save more and firms want to borrow more in the same year, what happens to the real interest rate?
You cannot tell without sizes. SLF shifting right lowers the rate and DLF shifting right raises it, so it depends on which shift is bigger. The quantity of loanable funds rises for certain, because both shifts push it up.
Course alignment, for teachers
AP Macroeconomics topic 4.7, Unit 4: Financial Sector.
- Skill 4.C: Demonstrate the effect of a change in an economic situation on an accurately labeled graph or visual.
This lesson maps all 9 essential knowledge statements of the topic to the part that teaches each one: 9 are checked by a scored question. The map is in the lesson file.