Unit 5 · Topic 5.3 · about 30 minutes · 7 parts · 13 scored checks, 3 of them multiple choice, plus 2 from earlier lessons
AP Macroeconomics 5.3: Money Growth and Inflation
Unit 5: 20 to 30% of the multiple-choice section
What you'll be able to do
- Explain, with graphs where they help, why inflation is a monetary phenomenon; define the quantity theory of money; and use it to calculate the money supply, velocity, the price level or real output.
Key vocabulary
| Term | What it means | The exam trap |
|---|---|---|
| Quantity theory of money | The theory that the money supply times velocity equals the price level times real output, so that in the long run the growth rate of the money supply determines the inflation rate. | Its growth-rate form says inflation is about money growth minus real output growth, so setting inflation equal to money growth while output is also growing overstates it. |
| Velocity | The average number of times a unit of money is spent on final goods and services in a year, equal to nominal GDP divided by the money supply. | Flipping it to money supply divided by nominal GDP gives a fraction such as 0.2 instead of 5; velocity is spending per dollar, nominal GDP divided by the money supply. |
| Money supply | The total quantity of money, such as currency and checkable deposits, that people in an economy can spend. | Solving for it means dividing nominal GDP by velocity, and multiplying instead gives a money supply bigger than total spending, which cannot happen when each dollar is spent several times. |
| Price level | The average level of prices in the economy, written in the quantity theory as a number such as 1.25, meaning 1.25 times the base-year level. | Given a price index such as 150, divide by 100 first, because putting 150 into the equation makes the price level a hundred times too large. |
| Real output | The quantity of final goods and services an economy produces, measured in base-year prices so that changes in the price level are taken out. | Changes in the money supply leave it unchanged in the long run at full employment, so showing real output higher after sustained money growth answers a long-run question with the short run. |
| Inflation and deflation | A sustained increase (inflation) or decrease (deflation) in the general price level. | A one-time jump in prices or one small rise in money is not what this topic calls inflation; it takes money growth that is too rapid for a sustained period, and a sustained fall in money gives deflation. |
 Tap to open the picture full size
Part 1 Think first One bill, many purchases
Guess before you learn. A wrong guess still makes the answer stick.
Predict first
Over one year, a single $20 bill changes hands five times, and each time it pays for something new: a haircut, a lunch, a phone case, a car wash and a movie ticket. How much spending on new goods and services did that one bill pay for during the year?
In short. The quantity theory of money says the money supply times velocity equals the price level times real output, and in the long run it ties the growth of money to the growth of prices.
- Money supply × velocity = price level × real output, so any one of the four can be found from the other three.
- Inflation (deflation) comes from the money supply growing (shrinking) too fast for a sustained period of time.
- At full employment, a change in the money supply changes the price level in the long run, not real output.
Part 2 Learn it Four short ideas, each checked as you go
2a. The quantity theory of money
Most money is spent many times a year. What you pay a barber becomes part of what the barber spends on groceries. Velocity is the average number of times a dollar is spent on final goods and services in a year.
So total spending on final goods and services is the money supply times velocity. That spending is nominal GDP, which is also the price level times real output. The quantity theory of money sets the two equal:
money supply × velocity = price level × real output
Textbooks and review books often write it as M × V = P × Y.
The price level here is a number such as 1.25, meaning prices are 1.25 times their base-year level. If you are given a price index such as 125 (base year = 100), divide it by 100 first. Real output is in base-year dollars.
Know any three and you can find the fourth:
- price level = money supply × velocity ÷ real output
- velocity = price level × real output ÷ money supply
- real output = money supply × velocity ÷ price level
- money supply = price level × real output ÷ velocity
Say the money supply is $500 billion and velocity is 4. Spending is $2,000 billion. If real output is $1,600 billion, the price level is 2,000 ÷ 1,600 = 1.25.
Quick check · Calculate
In Aldren, a fictional country, the money supply is $2,400 billion, real output is $8,000 billion in base-year dollars, and the price level is 1.5, meaning prices are 1.5 times their base-year level. Using the quantity theory of money, what is velocity?
2b. Inflation needs money that keeps growing
A sudden jump in the price of a key input can push the price level up, but it is one jump, not a rise that repeats every year. Inflation that runs year after year needs spending that rises year after year, and what can keep rising without limit is the amount of money.
So when the money supply increases at too rapid a rate for a sustained period of time, the result is inflation. It runs the other way too. When the money supply shrinks for a sustained period, spending keeps falling and so does the price level. That is deflation.
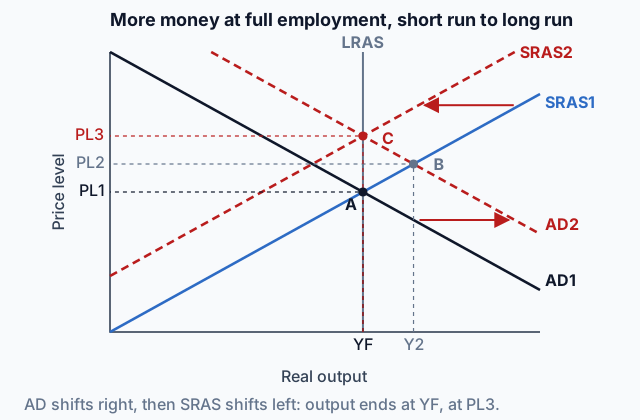
On the AD-AS graph, each round of extra money pushes aggregate demand to the right. An economy cannot keep producing more and more past full employment, so round after round, the price level is what climbs. The graph at the top of this page shows one round: AD shifts right, SRAS adjusts, and only the price level ends higher.
A one-time price shock is not inflation from the money supply, and neither is one small increase in money. It takes growth that is too rapid and sustained.
Quick check · Multiple choice
For five years in a row, a central bank cuts its country's money supply by about 4% a year, while velocity and real output change very little. What happens to the price level over those five years?
2c. At full employment, money moves prices, not output
In the short run, when an economy is below full employment, more money can raise real output. In an economy with limited reserves, a bigger money supply lowers the nominal interest rate, households and firms borrow and spend more, and idle workers and machines go back to work.
At full employment, the extra spending pushes output past YF for a while. Firms are short of workers and compete for them. Nominal wages and other input prices rise, so SRAS shifts left, and it keeps shifting until output is back at full employment. In the graph at the top of this page, that is the path from A to B to C.
In the long run, real output depends on the economy's labor, capital and technology, and money changes none of them. So when the economy is at full employment, a change in the money supply has no effect on real output in the long run. It changes the price level.
The quantity theory says the same thing with numbers. If velocity holds steady and real output stays at full employment, then when the money supply doubles, the price level doubles.
Quick check · Decide and justify
An economy is at full employment. Its central bank increases the money supply by 20% a year for several years, and velocity stays about the same. In the long run, is real output higher than it would have been without the money growth?
Which reason supports your choice?
2d. From money growth to the inflation rate
The quantity theory also works in growth rates. In the long run, the growth rate of the money supply determines the growth rate of the price level, which is the inflation rate.
If velocity is constant and real output is not growing, the two rates match: money grows 10% a year, so prices rise about 10% a year.
When real output grows too, part of the new money pays for the extra goods. With velocity constant, a close approximation is: inflation rate ≈ money growth rate − real output growth rate. Money growing 8% a year with output growing 3% gives inflation of about 5%. (The exact figure, 1.08 ÷ 1.03 − 1, is 4.85%, which is why questions say "approximately".)
All of this needs velocity to hold still, and in real data it does not. These are U.S. figures from the Federal Reserve Bank of St. Louis, FRED series M2V (nominal GDP divided by the M2 money stock), read on October 14, 2026:
| Quarter | Velocity |
|---|---|
| 1997, third quarter | 2.192 |
| 2007, first quarter | 1.992 |
| 2019, fourth quarter | 1.435 |
| 2020, second quarter | 1.126 |
| 2026, second quarter | 1.418 |
Velocity drifts over years and can drop fast in a crisis. When it moves, money growth and inflation come apart for a while.
Quick check · Calculate
In an economy, the money supply grows 9% a year, velocity stays constant, and real output grows 3% a year. Approximately what is the long-run inflation rate, in percent?
Part 3 Watch it done Doubling the money supply in Montavo
Watch each step, then do the last one yourself.
Montavo, a fictional country, is at full employment. Its money supply is $600 billion, velocity is 4, and real output is $1,500 billion in base-year dollars. Find the price level. Then the central bank doubles the money supply, and velocity stays at 4. Find the price level in the long run.
Step 1 · Find spending
Money supply × velocity = $600 billion × 4 = $2,400 billion. That is nominal GDP: spending on final goods and services at current prices.
Step 2 · Find the price level
Price level = nominal GDP ÷ real output = 2,400 ÷ 1,500 = 1.6. Prices are 1.6 times their base-year level.
Step 3 · Double the money
The central bank doubles the money supply from $600 billion to $1,200 billion. Velocity stays at 4.
Why this step?
Why does real output stay at $1,500 billion after the money supply doubles?
Montavo started at full employment. The extra spending raises output only until nominal wages and other input prices catch up; then SRAS shifts left and output returns to full employment. Real output depends on labor, capital and technology, and doubling the money changed none of them.
Your step · Calculate
Finish the analysis. In Montavo, the money supply is now $1,200 billion, velocity is still 4, and real output stays at $1,500 billion in base-year dollars. What is the long-run price level?
The money supply doubled, the price level doubled from 1.6 to 3.2, and real output stayed at $1,500 billion. That is the long run at full employment.
Part 4 Try it Every unknown, with new numbers
Each question gives its own numbers. Write the quantity theory out, put in the three you know, and solve for the fourth. The last question uses real U.S. data from FRED, the Federal Reserve Bank of St. Louis database, read on October 14, 2026.
Try it · Calculate
In Laridia, a fictional country, the money supply is $900 billion, velocity is 6, and the price index is 120 (base year = 100). Using the quantity theory of money, what is real output, in billions of base-year dollars?
Try it · Calculate
In Brenmoor, a fictional country, velocity is 4, the price level is 1.25, and real output is $6,000 billion in base-year dollars. What money supply, in billions of dollars, fits the quantity theory of money?
Try it · Multiple choice
From December 2019 to December 2020, the U.S. M2 money stock rose from $15,351.5 billion to $19,119.4 billion, about 25% (FRED series M2SL). M2 velocity fell from 1.435 in the fourth quarter of 2019 to 1.165 in the fourth quarter of 2020, about 19% (FRED series M2V). The GDP deflator, a price index, rose about 1.6% between those quarters (FRED series GDPDEF). Which best explains why the price level rose so much less than the money supply?
Part 5 Explain it Write it the way the exam asks
Nothing you type leaves this page.
Free response is 33.35% of the exam score. This one is shaped like Question 3, Short.
Free-response practice · Question 3 style
Dravia, a fictional country, is at full employment. In Year 1 its money supply is $900 billion, velocity is 4, and real output is $2,400 billion in base-year dollars. In Year 2 the money supply is $972 billion, and velocity and real output are unchanged.
(a) Using the quantity theory of money, calculate Dravia's price level in Year 1. Show your work.
(b) Calculate the inflation rate from Year 1 to Year 2. Show your work.
(c) Suppose Dravia's central bank keeps increasing the money supply at the same rate every year for the next five years, and velocity stays constant. In the long run, will real output increase, decrease, or stay the same? Explain.
(d) Suppose instead that over those five years Dravia's labor force and capital grow, so real output grows 3% a year, while money growth and velocity stay as in part (c). Identify the approximate annual inflation rate.
Model answer
(a) Spending = money supply × velocity = $900 billion × 4 = $3,600 billion. Price level = $3,600 billion ÷ $2,400 billion = 1.5. (b) In Year 2, spending = $972 billion × 4 = $3,888 billion, so the price level is 3,888 ÷ 2,400 = 1.62. Inflation rate = (1.62 − 1.5) ÷ 1.5 × 100 = 8%. (c) Real output stays the same. Dravia is at full employment, so the extra spending bids up nominal wages and other input prices, SRAS shifts left, and output returns to full employment. Money does not change the labor, capital or technology that set full-employment output, so only the price level rises. (d) About 5%: money grows 8% a year and real output grows 3%, so inflation is about 8% − 3% = 5%.
Score your own answer. This is a self-check, not a grade. Tick each point your answer makes.
Part 6 Check yourself Read the quantity theory from data
Read the table first, then answer both questions from it.
Quillan, a fictional country, reports its money supply, velocity and real output for three years. Its economy reached full employment in Year 2, and real output did not grow after that.
| Measure | Year 1 | Year 2 | Year 3 |
|---|---|---|---|
| Money supply (billions of dollars) | 400 | 420 | 462 |
| Velocity | 5 | 5 | 5 |
| Real output (billions of base-year dollars) | 1,600 | 1,680 | 1,680 |
Case question 1 · Calculate
Using the quantity theory of money and Quillan's table, what is Quillan's price level in Year 3? Give it as a number such as 1.2, not as an index.
Case question 2 · Multiple choice
In Quillan's table, the money supply grew 5% from Year 1 to Year 2, yet the price level did not change. Which explains this?
The rest stand on their own and do not use the case.
Check yourself · Put it in order
An economy with limited reserves is at full employment. Its central bank buys government bonds on the open market, increasing the money supply. Tap the steps in the order they happen.
Check yourself · Spot the error
In an economy, the money supply grows 6% a year, velocity is constant, and real output grows 2% a year. A student estimated the long-run inflation rate. Tap the first line with a mistake.
Check yourself · Match
Velocity holds steady in each situation. Tap a situation, then tap what happens to the price level over several years.
Part 7 Keep it Keep it
From 5.1 Fiscal and Monetary Policy Actions in the Short Run · Put it in order
A central bank in an economy with ample reserves acts against a positive (inflationary) output gap. Tap the steps in the order they happen.
From 4.2 Nominal v. Real Interest Rates · Calculate
A water utility and its bank agree on a one-year loan at a nominal interest rate of 8.2%. Both sides are aiming for an expected real interest rate of 3.4%. What inflation rate are they expecting over the year?
In three lines
- Money supply × velocity = price level × real output; find any one from the other three.
- Too-rapid money growth sustained over years causes inflation; a sustained fall causes deflation.
- At full employment, more money raises the price level in the long run, not real output.
Exam strategy for this topic
- Section I, Multiple Choice: 60 questions in 70 minutes.
- Section II, Free Response: 3 questions in 60 minutes.
- This lesson's Explain it is shaped like free-response question 3, Short.
- A four-function calculator is allowed on both sections of the exam.
Write the equation out first, money supply × velocity = price level × real output, then put in the three numbers you know and solve for the fourth. Turn any price index into a price level by dividing by 100 before it goes in, and show each step.
Questions students ask
What does velocity actually mean?
It is how many times an average dollar is spent on final goods and services in a year. A money supply of $500 billion with a velocity of 4 supports $2,000 billion of spending.
How do I find the price level with the quantity theory?
Multiply the money supply by velocity to get nominal GDP, then divide by real output. With $600 billion of money, a velocity of 4 and real output of $1,500 billion, the price level is 2,400 ÷ 1,500 = 1.6.
If the money supply doubles, does the price level double?
In the long run at full employment, with velocity steady, yes. Real output does not change, so the price level takes the whole increase: in the lesson's Montavo example, money going from $600 billion to $1,200 billion takes the price level from 1.6 to 3.2.
How do I estimate inflation when real output is also growing?
With velocity constant, inflation is approximately money growth minus real output growth. Money growing 8% a year with output growing 3% gives inflation of about 5%; the exact figure, 1.08 ÷ 1.03 minus 1, is about 4.85%.
Can more money ever raise real output?
In the short run, below full employment, yes: a bigger money supply lowers interest rates, borrowing and spending rise, and idle workers go back to work. At full employment the gain lasts only until wages and input prices catch up.
Why didn't U.S. prices rise as fast as the money supply in 2020?
Velocity fell about 19% that year while M2 rose about 25%, so most of the new money was offset and spending grew far less. Money growth turns into the same inflation only when velocity and real output hold steady.
Course alignment, for teachers
AP Macroeconomics topic 5.3, Unit 5: Long-Run Consequences of Stabilization Policies.
- Skill 3.A: Determine the outcome of an economic situation using economic concepts, principles, or models.
This lesson maps all 3 essential knowledge statements of the topic to the part that teaches each one: 3 are checked by a scored question. The map is in the lesson file.