Unit 5 · Topic 5.2 · about 30 minutes · 7 parts · 12 scored checks, 1 of them multiple choice, plus 2 from earlier lessons
AP Macroeconomics 5.2: The Phillips Curve
Unit 5: 20 to 30% of the multiple-choice section
What you'll be able to do
- Define the short-run and long-run Phillips curves, and explain short-run and long-run equilibrium in the Phillips curve model, using graphs where they help.
- Explain, using graphs where they help, how unemployment and inflation respond in the short run and in the long run.
Key vocabulary
| Term | What it means | The exam trap |
|---|---|---|
| Short-run Phillips curve (SRPC) | A downward-sloping curve that shows the short-run trade-off between the inflation rate and the unemployment rate; the economy is always at some point on it. | Drawing a new SRPC for a change in spending is wrong: a change in aggregate demand moves the economy along the SRPC it is already on. |
| Long-run Phillips curve (LRPC) | A vertical line at the natural rate of unemployment, showing that in the long run there is no trade-off between inflation and unemployment. | Put it at the natural rate of unemployment with that number on the horizontal axis, never at the unemployment rate the economy happens to have today. |
| Natural rate of unemployment | The unemployment rate that would exist when the economy produces full-employment real output, equal to the sum of frictional and structural unemployment. | Cyclical unemployment is left out: the natural rate is frictional plus structural, so adding all three kinds gives the actual rate, not where the LRPC goes. |
| Long-run equilibrium | In the Phillips curve model, the point where the SRPC crosses the LRPC. | At this crossing actual inflation equals expected inflation, so the SRPC meets the LRPC at the expected rate, not at whatever inflation the economy has now. |
| Inflationary and recessionary gaps | Points to the left of long-run equilibrium, with unemployment below the natural rate, are inflationary gaps; points to the right are recessionary gaps. | Left of the LRPC means unemployment below the natural rate, which is an inflationary gap; reading left as a weak economy flips the two. |
| Demand shock | An event that shifts aggregate demand, which moves the economy along the SRPC. | Expect unemployment and inflation to move in opposite directions after one, so if a question says both rates rose, a demand shock alone cannot explain it. |
| Supply shock | An event that shifts short-run aggregate supply, which shifts the SRPC. | An adverse one shifts the SRPC right (up), so unemployment and inflation rise together, unlike the trade-off a demand shock produces. |
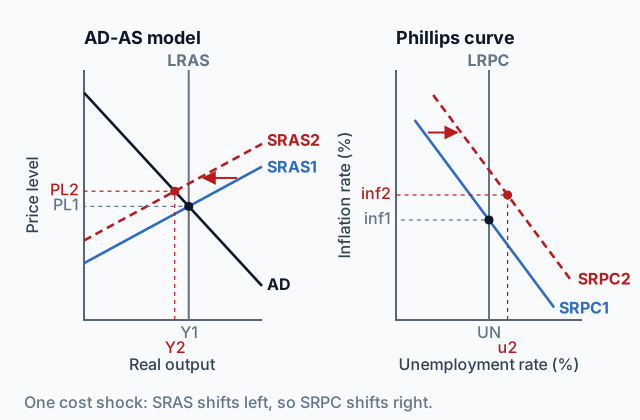 Tap to open the picture full size
Part 1 Think first One dial, two goals
Guess before you learn. A wrong guess still makes the answer stick.
Predict first
A country's leaders want lower unemployment and lower inflation this year. The only thing they can change is total spending in the economy, up or down. What can they get?
In short. The Phillips curve model plots the inflation rate against the unemployment rate, with a downward-sloping short-run curve and a vertical long-run curve at the natural rate of unemployment.
- A change in aggregate demand moves the economy along the short-run Phillips curve.
- A supply shock or a change in expected inflation shifts the short-run Phillips curve.
- Long-run equilibrium is where the two curves cross, and a change in the natural rate moves the long-run curve.
Part 2 Learn it Four short ideas, each checked as you go
2a. The short-run trade-off
The Phillips curve graph puts the inflation rate (%) on the vertical axis and the unemployment rate (%) on the horizontal axis. Both are rates. Neither is the price level or real output from AD-AS.
The short-run Phillips curve (SRPC) slopes down. It shows the short-run trade-off: a point with lower unemployment has higher inflation, and a point with higher unemployment has lower inflation. Wherever the economy is, it is at some point on its SRPC.
What moves the economy along that curve is a demand shock, a shift of aggregate demand. You drew it in 3.6 Changes in the AD–AS Model in the Short Run: when AD shifts right, firms produce more and hire more, and the price level rises. On the Phillips graph the same event is a move up and to the left along the SRPC, with unemployment falling and inflation rising. When AD shifts left, the economy moves down and to the right along it.
The curve itself stays where it is, because neither production costs nor expected inflation has changed.
Quick check · Fill the statement
Tap a blank, then tap a word.
Tourists from abroad suddenly spend far more at a country's hotels and restaurants. Nothing else changes. Aggregate demand shifts . On the Phillips curve graph, the economy the short-run Phillips curve, and the unemployment rate while the inflation rate .
2b. The long run: a vertical curve at the natural rate
In the long run there is no trade-off. The long-run Phillips curve (LRPC) is vertical at the natural rate of unemployment, the rate when the economy produces full-employment output. From 2.3 Unemployment, that rate is frictional plus structural unemployment, with no cyclical unemployment. The LRPC plays the part LRAS plays on AD-AS: spending can push unemployment away from the natural rate for a while, but wages and prices adjust and it comes back (3.7 Long-Run Self-Adjustment).
Long-run equilibrium is where the SRPC crosses the LRPC. Other points on the same SRPC are the output gaps you already know:
- Left of long-run equilibrium, unemployment is below the natural rate and output is above full employment. That is an inflationary gap.
- Right of long-run equilibrium, unemployment is above the natural rate. That is a recessionary gap.
Draw the LRPC at the natural rate, never at whatever the actual unemployment rate happens to be, and mark the natural rate on the horizontal axis, as UN or as its number.
Quick check · Calculate
Dalmuth's statistics agency estimates that frictional unemployment is 3.5%, structural unemployment is 1.5% and cyclical unemployment is 2%. At what unemployment rate, in percent, should Dalmuth's long-run Phillips curve be drawn?
2c. What shifts each curve
A supply shock does not move the economy along the SRPC. It shifts the SRPC. When the cost of producing rises for most firms, SRAS shifts left (3.6 Changes in the AD–AS Model in the Short Run): output falls and the price level rises, so unemployment and inflation both rise. On the Phillips graph the SRPC shifts right (up). Cheaper inputs shift SRAS right and the SRPC left (down). The diagram at the top of the page shows the costly case on both graphs.
Expected inflation shifts the SRPC too. Each SRPC is drawn for one expected inflation rate, and it crosses the LRPC at that rate. If people come to expect faster inflation, wage contracts and prices build it in, SRAS shifts left, and the SRPC shifts up. Lower expected inflation shifts it down.
That is how a gap closes with no policy (3.7 Long-Run Self-Adjustment). In a recession, inflation runs below what people expected, so expected inflation and wages come down, SRAS shifts right, and the SRPC shifts left until the economy is back at the natural rate. In an inflationary gap the same steps run the other way.
The LRPC shifts only when the natural rate itself changes, for example when the makeup of the labor force changes.
Quick check · Sort it
Each event happens on its own, with nothing else changing. Tap an event, then tap what it does on the Phillips curve graph.
Movement along the SRPC
The SRPC shifts
The LRPC shifts
2d. Drawing it with numbers
When a question gives you numbers and asks for a correctly labeled graph, the graph shows four things:
- Axes labeled Inflation rate (%) and Unemployment rate (%).
- A vertical LRPC at the natural rate, with that number on the horizontal axis.
- A downward-sloping SRPC that crosses the LRPC at the expected inflation rate, with that number on the vertical axis when you are given it.
- The economy's point, often called X, on the SRPC at the given unemployment and inflation rates, with dashed lines to both axes.
Work out the side before you draw. If actual unemployment is above the natural rate, X sits right of the LRPC. Follow the SRPC left from X to the LRPC and inflation goes up, so the crossing, the expected rate, is above X. Left of the LRPC it is the other way round.
After a change in spending, put the new point on the same SRPC, on the side the AD shift sends it. A second SRPC is only for a supply shock or a change in expected inflation.
Quick check · Decide and justify
Isvara's natural rate of unemployment is 5.5%. Its actual unemployment rate is 7.5%, and its inflation rate is 2%. Is the inflation rate that people in Isvara expect higher than, lower than, or equal to 2%?
Which reason supports your choice?
Part 3 Watch it done Plot it, then move along it
Watch each step, then do the last one yourself.
Lorvia's natural rate of unemployment is 5%, and workers and firms expect inflation of 4%. Today Lorvia's unemployment rate is 3% and its inflation rate is 7%. Its SRPC is a straight line. Show Lorvia on a Phillips curve graph as point X. Then Lorvia's central bank, whose banking system has ample reserves, raises the interest rate it pays on reserves. Unemployment rises to 4%, and expected inflation does not change. Find Lorvia's new inflation rate.
Step 1 · Draw the axes and the LRPC
Inflation rate (%) goes up the side and unemployment rate (%) along the bottom. The LRPC is vertical at the natural rate, so mark 5 on the horizontal axis and draw it there.
Step 2 · Plot X
X goes at 3% unemployment and 7% inflation, with dashed lines to both axes. It is left of the LRPC: unemployment is below the natural rate, so Lorvia is in an inflationary gap.
Step 3 · Draw SRPC1
The SRPC crosses the LRPC at the expected inflation rate, so it passes through (5%, 4%) as well as through X.
Why this step?
Why does SRPC1 cross the LRPC at 4% and not at X's 7%?
At long-run equilibrium, actual inflation equals the inflation people expect, so the crossing sits at the expected rate, 4%. X is away from that crossing because Lorvia is in an inflationary gap, where actual inflation runs above what people expected.
Step 4 · Move along SRPC1
A higher interest rate on reserves pushes interest rates up, so borrowing and spending fall and AD shifts left (4.6 Monetary Policy, 3.6 Changes in the AD–AS Model in the Short Run). Expected inflation has not changed, so SRPC1 stays put and the economy moves down and to the right along it, to a new point Z at 4% unemployment.
Your step · Calculate
Finish it. Lorvia's SRPC1 is a straight line through point X, at 3% unemployment and 7% inflation, and through 5% unemployment and 4% inflation, where it crosses the LRPC. After the central bank's action, the economy moves along SRPC1 to 4% unemployment. What is Lorvia's inflation rate there, in percent?
%
Part 4 Try it Draw it yourself
One step further. Every move on the Phillips curve graph has a twin on the AD-AS graph. Sketch the two side by side until the pairing comes without thinking.
Try it · Match
Tap a change on the AD-AS graph, then tap what it looks like on the Phillips curve graph.
Part 5 Explain it Write it the way the exam asks
Nothing you type leaves this page.
Free response is 33.35% of the exam score. This one is shaped like Question 1, Long.
Free-response practice · Question 1 style
Assume that Marvane's natural rate of unemployment is 4.5%. Its actual unemployment rate is 3.2%, and its inflation rate is 5.4%.
(a) Draw a correctly labeled graph of the short-run and long-run Phillips curves. Using the numbers above, plot Marvane's current position and label it X.
(b) Is the expected inflation rate in Marvane higher than, lower than, or equal to 5.4%? Explain.
(c) Assume that no policy action is taken. In the long run, will the short-run Phillips curve shift to the left, shift to the right, or not shift?
Model answer
(a) Inflation rate (%) on the vertical axis and unemployment rate (%) on the horizontal axis. A vertical LRPC at 4.5% and a downward-sloping curve labeled SRPC1. X is on SRPC1 at 3.2% unemployment and 5.4% inflation, to the left of the LRPC, with dashed lines to 3.2 on the horizontal axis and 5.4 on the vertical axis. (b) Lower than 5.4%. Unemployment is below the natural rate, so X is left of the LRPC. Following the downward-sloping SRPC right to the LRPC lowers inflation, so the crossing, at the expected inflation rate, is below 5.4%. (c) It shifts to the right. Actual inflation is above what people expected, so expected inflation and wages rise and SRAS shifts left, until unemployment is back at the natural rate.
Score your own answer. This is a self-check, not a grade. Tick each point your answer makes.
Part 6 Check yourself Read the U.S. data
These are real figures. Read the table first, then answer from it.
The table uses U.S. data from FRED, the Federal Reserve Bank of St. Louis database, read on October 15, 2026. The unemployment rate is series UNRATE and the natural rate is the Congressional Budget Office's estimate, series NROU (FRED titles it the noncyclical rate of unemployment), each averaged over the year. Inflation is the percent change in the yearly average of the consumer price index, series CPIAUCSL.
| Percent | 1973 | 1974 | 2009 |
|---|---|---|---|
| Unemployment rate | 4.9 | 5.6 | 9.3 |
| Natural rate (CBO) | 6.1 | 6.1 | 5.0 |
| Inflation rate (CPI) | 6.3 | 11.0 | -0.3 |
Case question 1 · Multiple choice
Judge each year in the U.S. table by its annual average unemployment rate, with the CBO's estimate as the natural rate. By that test, in which of the years 1973, 1974 and 2009 was the economy in a recessionary gap?
Case question 2 · Decide and justify
In the U.S. figures, from 1973 to 1974 unemployment rose from 4.9% to 5.6% and inflation rose from 6.3% to 11.0%. Could a change in aggregate demand alone, moving the economy along one short-run Phillips curve, produce both of those changes?
Which reason supports your choice?
Case question 3 · Fill the statement
Tap a blank, then tap a word.
In the U.S. figures, the CBO's estimate of the natural rate of unemployment was 6.1% in 1974 and 5.0% in 2009. On a Phillips curve graph, that change appears as a shift of the to the .
The rest stand on their own and do not use the case.
Check yourself · Spot the error
A student showed the effect of a boom in business investment, as firms build new offices, on a Phillips curve graph. Expected inflation did not change. Tap the first line with a mistake.
Check yourself · Calculate
Haverin's short-run Phillips curve is a straight line through two points: 2% unemployment with 10% inflation, and 6% unemployment with 2% inflation. Its long-run Phillips curve is at 5%. Haverin is on its SRPC with an inflation rate of 5%. What is its unemployment rate, in percent?
Check yourself · Put it in order
An economy is to the right of its long-run Phillips curve, and no policy action is taken. Tap the steps in the order they happen in the long run.
Part 7 Keep it Keep it
Classify each policy first, as expansionary or contractionary, using the regime the plan names. Then ask which results both policies push the same way. Those are the only certain ones.
From 5.1 Fiscal and Monetary Policy Actions in the Short Run · Match
In each plan, any rise in the government's budget deficit is paid for by borrowing. Tap a plan, then tap what you can say for certain about its short-run effects.
From 3.6 Changes in the AD–AS Model in the Short Run · Select all
An economy is in long-run equilibrium when a recession abroad sharply cuts foreign purchases of its exports. Which two of these happen in the short run? Select two.
Select 2 answers, then check.
In three lines
- A change in AD moves the economy along the SRPC, so unemployment and inflation move opposite ways.
- Supply shocks and changes in expected inflation shift the SRPC; a change in the natural rate shifts the LRPC.
- Long-run equilibrium is where SRPC meets LRPC; left of it is an inflationary gap, right of it a recessionary gap.
Exam strategy for this topic
- Section I, Multiple Choice: 60 questions in 70 minutes.
- Section II, Free Response: 3 questions in 60 minutes.
- This lesson's Explain it is shaped like free-response question 1, Long.
- A four-function calculator is allowed on both sections of the exam.
Label the vertical axis inflation rate and the horizontal axis unemployment rate, draw the LRPC at the natural rate with its number on the axis, and place every point on an SRPC. Before you move anything, decide whether the event shifted AD, which moves the point along the SRPC, or shifted SRAS or expectations, which moves the SRPC itself.
Questions students ask
Why is the long-run Phillips curve vertical?
In the long run, wages and expected inflation adjust, so unemployment returns to the natural rate whatever the inflation rate is. Spending can push unemployment away from the natural rate only for a while.
What is the difference between moving along the SRPC and shifting it?
A change in aggregate demand moves the economy along the SRPC, trading lower unemployment for higher inflation or the reverse. A supply shock or a change in expected inflation moves the whole curve, and then both rates can rise or fall together.
How can I tell whether expected inflation is above or below the current inflation rate?
Place the economy against the LRPC. If unemployment is above the natural rate, follow the downward-sloping SRPC left to the LRPC: inflation rises on the way, so the expected rate is above today's rate. Left of the LRPC it is below.
What makes the LRPC shift?
Only a change in the natural rate of unemployment. Retraining that cuts structural unemployment moves it left, and a labor force full of frequent job changers raises frictional unemployment and moves it right.
If nothing is done about a recessionary gap, what happens to the SRPC?
Inflation runs below what people expected, so expected inflation and wages come down. SRAS shifts right, the SRPC shifts left, and the economy ends back at the natural rate.
How does a move on the Phillips curve graph match the AD-AS graph?
AD shifting right is a move up and to the left along the SRPC, and AD shifting left is a move down and to the right. SRAS shifting left shows up as the SRPC shifting right, and SRAS shifting right as the SRPC shifting left.
Course alignment, for teachers
AP Macroeconomics topic 5.2, Unit 5: Long-Run Consequences of Stabilization Policies.
- Skill 4.B: Demonstrate your understanding of a specific economic situation on an accurately labeled graph or visual.
This lesson maps all 8 essential knowledge statements of the topic to the part that teaches each one: 8 are checked by a scored question. The map is in the lesson file.