Unit 5 · Topic 5.5 · about 30 minutes · 7 parts · 9 scored checks, 1 of them multiple choice, plus 2 from earlier lessons
AP Macroeconomics 5.5: Crowding Out
Unit 5: 20 to 30% of the multiple-choice section
What you'll be able to do
- Define crowding out, and explain, with graphs where they help, how fiscal policy can cause it.
Key vocabulary
| Term | What it means | The exam trap |
|---|---|---|
| Crowding out | The adverse effect of increased government borrowing, which raises the real interest rate and lowers interest-sensitive private spending in the short run. | It means less interest-sensitive private spending in the short run, such as business investment and new houses, not less spending of every kind, and with upward-sloping supply private borrowing falls by less than the government borrows. |
| Loanable funds market | The market in which savers supply funds and borrowers demand them, with the real interest rate as its price. | Drawing the borrowing as both a rightward DLF shift and a leftward SLF shift counts it twice, and this graph is not the money market, whose curves are the demand for and supply of money. |
| Real interest rate | The nominal interest rate minus the inflation rate, which measures the cost of borrowing in terms of what money will buy. | Government borrowing raises it even though the government goes on to spend the money, because that money was first borrowed from savers. |
| Government budget deficit | The amount by which government purchases plus transfer payments exceed tax revenue in a given year. | Covering one by borrowing is what ties the budget to the loanable funds market, so the chain starts with the government selling bonds, not with net exports. |
| Physical capital | Buildings, machines, equipment and other produced goods used to make other goods and services. | Slower accumulation of it is the long-run effect, so putting slower growth in the short run, or jumping from a deficit straight to slower growth, skips the interest rate and investment links. |
 Tap to open the picture full size
Part 1 Think first A decade of new bonds
Guess before you learn. A wrong guess still makes the answer stick.
Predict first
Every year for a decade, Dravos's treasury sells $250 billion of new government bonds to pay for a larger public payroll, and savers at home buy them. Compare Dravos at the end of that decade with the same country if it had kept its old payroll and sold no new bonds. How many factories, machines and other equipment do Dravos's firms probably own?
In short. Crowding out is the fall in interest-sensitive private spending, in the short run, that follows an increase in government borrowing.
- A government in budget deficit typically borrows to cover the gap, by selling bonds to savers.
- On the loanable funds graph that borrowing is drawn as DLF shifting right or SLF shifting left, one shift and not both.
- The loanable funds market's price is the real interest rate, the interest rate after inflation.
Part 2 Learn it Four short ideas, each checked as you go
2a. A deficit is paid for by borrowing
In 5.4 Government Deficits and the National Debt you met the budget deficit: a year in which government purchases plus transfer payments exceed tax revenue. The gap has to be paid for, and a government in deficit typically borrows. It sells bonds, and each buyer lends the government money now in return for repayment with interest later.
The buyers are savers: households, firms, banks and pension funds with money they are not spending. So the government becomes a borrower in the loanable funds market, the same market a firm turns to for funds to build a warehouse and a family turns to for a mortgage. That market's price is the real interest rate, the interest rate after inflation, because savers care about what their repayment will buy.
Savers are the government's lenders and a bakery's lenders too. When government borrowing rises, a bakery that wants a loan for a new oven has to compete with the government for savers' funds, and that competition pushes up the price of borrowing.
Quick check · Fill the statement
Tap a blank, then tap a word or phrase.
This year Vessaly's government buys $900 billion of goods and services, pays $300 billion in transfer payments and collects $1,050 billion in taxes. Its budget is in , so this year it typically in the market, whose price is the real interest rate.
2b. The real interest rate rises
The loanable funds graph puts the real interest rate on the vertical axis and the quantity of loanable funds on the horizontal axis. Demand (DLF) slopes down, because borrowers want more at lower rates. Supply (SLF) slopes up, because savers lend more at higher rates.
Take Vessaly's market before the deficit: DLF1 is r = 10 − 0.01Q and SLF1 is r = 2 + 0.01Q, with r in percent and Q in billions of dollars. They cross at r1 = 6% and Q1 = $400 billion.
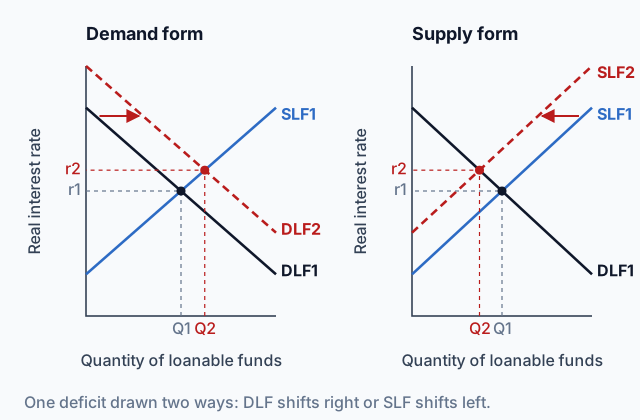
Now the government borrows $200 billion, the same amount at every real interest rate. The two graphs at the top of this page show the two accepted ways to draw it:
- Demand form. The government is one more borrower, so demand shifts right by 200 to DLF2. It crosses SLF1 at r2 = 7%, with Q2 = $500 billion.
- Supply form. The government's borrowing uses up saving private borrowers could have had, so the supply left for them shifts left by 200 to SLF2. It crosses DLF1 at the same r2 = 7%, with Q2 = $300 billion.
The released scoring guidelines accept either form. Both raise the real interest rate. Draw one shift, not both: doing both counts the same borrowing twice.
Quick check · Decide and justify
Vessaly's government raises its spending and covers the new budget deficit by borrowing. A commentator says the government is pumping money into the economy, so borrowing will get cheaper. What happens to the equilibrium real interest rate in Vessaly's loanable funds market?
Which reason supports your choice?
2c. Who gets crowded out
In the demand form, the quantity of loanable funds rose from $400 billion to $500 billion. That is not more private investment, because $200 billion of it is the government. Private borrowers are still on DLF1, and at the new real rate of 7% they want 10 − 0.01Q = 7, so Q = $300 billion. Private borrowing fell by $100 billion. The supply form shows the same $300 billion directly, as its Q2.
That fall is crowding out: increased government borrowing raises the real interest rate, and interest-sensitive private spending decreases in the short run. The spending hit hardest is the kind people pay for with borrowed money or weigh against the interest they could earn: firms' purchases of machines and buildings, new houses bought with mortgages, cars bought on loans. A family's groceries barely respond.
Notice the size. The government borrowed $200 billion, and private borrowing fell by $100 billion, not $200 billion. The higher rate also drew out $100 billion of extra saving. Crowding out lowers private borrowing, but in this market by less than the government borrowed.
Quick check · Sort it
Government borrowing has just pushed the real interest rate up. Tap each private spending plan, then tap how it is likely to respond.
Interest-sensitive: likely to be cut back
Little affected by the real interest rate
2d. The long run: less capital, slower growth
Investment spending is how an economy adds physical capital: factories, machines, equipment, delivery fleets. If crowding out keeps private investment lower year after year, less new capital gets built each year than would have been built otherwise. Workers end up with fewer and older tools than they would have had, so output per worker grows more slowly.
So a potential long-run effect of crowding out is a lower rate of physical capital accumulation and, as a result, less economic growth. Give every link when you explain it, because a jump from "deficit" straight to "slower growth" leaves out what makes it true:
- The budget moves into deficit and the government borrows.
- DLF shifts right (or SLF shifts left), and the real interest rate rises.
- Borrowing costs more, so interest-sensitive investment falls.
- Less physical capital accumulates, so long-run growth slows.
Keep the timing straight. In the short run, crowding out shows up as lower interest-sensitive spending. The slower growth is a long-run effect, and it is a potential one: its size depends on how far investment falls and for how long.
Quick check · Put it in order
A government that had balanced budgets starts running large deficits and keeps running them for many years. Tap the steps in the order they happen, from the deficit to the long-run result.
Part 3 Watch it done How much is crowded out in Brevik
Watch each step, then do the last one yourself.
Brevik's loanable funds market has demand DLF1: r = 18 − 0.02Q and supply SLF1: r = 3 + 0.01Q, with r the real interest rate in percent and Q in billions of dollars. Brevik's government starts borrowing $150 billion a year to cover a new budget deficit, the same amount at every real interest rate. By how much does private borrowing fall?
Step 1 · The starting equilibrium
Set the curves equal: 18 − 0.02Q = 3 + 0.01Q, so 0.03Q = 15 and Q1 = $500 billion. Then r1 = 18 − 0.02 × 500 = 8%.
Step 2 · Add the government to demand
The government borrows $150 billion at every rate, so demand shifts right by 150. DLF2 is r = 18 − 0.02(Q − 150) = 21 − 0.02Q. Setting 21 − 0.02Q = 3 + 0.01Q gives 0.03Q = 18, so Q2 = $600 billion, and r2 = 21 − 0.02 × 600 = 9%.
Why this step?
Why does DLF2 sit 150 to the right of DLF1 at every real interest rate, not only at the old one?
The government has to cover its deficit whatever the rate, so its $150 billion is added to what private borrowers want at each real interest rate. Borrowing that does not respond to the rate moves the whole curve over by the same amount.
Your step · Calculate
Finish it. In Brevik, private borrowers' demand for loanable funds is DLF1: r = 18 − 0.02Q, and the supply is SLF1: r = 3 + 0.01Q, with r in percent and Q in billions of dollars. Before the deficit they crossed at 8% and $500 billion. The government then borrows $150 billion at every real interest rate, which raises the equilibrium real interest rate to 9% and the total quantity of loanable funds to $600 billion. By how much does private borrowing fall, in billions of dollars?
billion dollars
The supply form gets there in one step. Taking the government's $150 billion out of supply gives SLF2: r = 3 + 0.01(Q + 150) = 4.5 + 0.01Q, which crosses DLF1 at Q = $450 billion and the same 9%. The government borrowed $150 billion; private borrowing fell by $50 billion, and savers lent the other $100 billion because the rate rose.
Part 4 Try it Draw it yourself
What to watch for. A surplus runs the deficit backward. The government borrows less, so demand shifts left or supply shifts right, and the real interest rate falls. A lower rate leaves room for more private investment. Whichever form you draw, the real interest rate moves the same way; only the quantity can differ.
Part 5 Explain it Write it the way the exam asks
Nothing you type leaves this page.
Free response is 33.35% of the exam score. This one is shaped like Question 3, Short.
Free-response practice · Question 3 style
Kestova, a fictional country, has a balanced government budget. Its government raises pension payments to retirees by $40 billion a year and does not change its purchases or its taxes. It borrows to cover any gap.
(a) Will Kestova's government budget move into surplus, move into deficit, or stay balanced? Explain.
(b) Draw a correctly labeled graph of the loanable funds market. Show the effect of the government's borrowing on the real interest rate and the quantity of loanable funds, labeling the original values r1 and Q1 and the new values r2 and Q2.
(c) What will happen to Kestova's long-run rate of economic growth? Explain using the change in the real interest rate you showed in part (b).
Model answer
(a) It moves into deficit. Pension payments are transfer payments, so government outlays rise by $40 billion while tax revenue stays the same, and outlays now exceed tax revenue. (b) Real interest rate on the vertical axis and quantity of loanable funds on the horizontal axis. DLF1 slopes down and SLF1 slopes up, crossing at r1 and Q1. The government's borrowing shifts demand right to DLF2, shown with an arrow, and DLF2 crosses SLF1 at r2, above r1, and Q2, to the right of Q1, each marked on its axis with a dashed line. (Shifting supply left to SLF2 instead, with r2 above r1 and Q2 to the left of Q1, is also correct.) (c) Long-run growth slows. The higher real interest rate raises the cost of borrowing, so firms cut investment spending on physical capital. Less capital accumulates each year, so the economy's capacity to produce grows more slowly.
Score your own answer. This is a self-check, not a grade. Tick each point your answer makes.
Part 6 Check yourself Read a loanable funds schedule
Read the case first, then answer both questions from it.
Pellaro, a fictional country, has had a balanced government budget. Next year its government will run a deficit and borrow $200 billion to cover it, the same amount at every real interest rate. Before that borrowing, Pellaro's loanable funds market looks like this:
| Real interest rate | Quantity demanded by private borrowers | Quantity supplied by savers |
|---|---|---|
| 2% | 580 | 380 |
| 3% | 520 | 420 |
| 4% | 460 | 460 |
| 5% | 400 | 500 |
| 6% | 340 | 540 |
| 7% | 280 | 580 |
| 8% | 220 | 620 |
Case question 1 · Calculate
Pellaro's government will borrow $200 billion at every real interest rate. Using Pellaro's loanable funds schedule, what will the new equilibrium real interest rate be, in percent?
Case question 2 · Multiple choice
In Pellaro, the government's new borrowing raises the real interest rate. Which spending is most directly reduced by crowding out in the short run?
The rest stand on their own and do not use the case.
Check yourself · Spot the error
A student was asked how a large, lasting budget deficit in Marbeck, covered by borrowing, affects Marbeck's long-run rate of economic growth. Tap the first line that goes wrong.
Check yourself · Decide and justify
Tolvane's government borrows an extra $150 billion a year to cover a deficit. Its demand for loanable funds slopes down and its supply slopes up. A columnist writes that crowding out will cut private borrowing by the full $150 billion. Is the columnist right?
Which reason supports your choice?
Part 7 Keep it Keep it
From 5.4 Government Deficits and the National Debt · Decide and justify
Some lawmakers propose a rule that the government's budget must balance every year. Suppose the rule is in force and the budget is balanced when a recession begins. As incomes fall, income tax revenue falls automatically, and more people qualify for unemployment benefits under laws already in place. To obey the rule, would the government have to change tax rates or spending during the recession?
Which reason supports your choice?
From 4.7 The Loanable Funds Market · Calculate
Doranth does no international borrowing or lending. This year its households and businesses save $640 billion out of their after-tax income. Its government collects $910 billion in taxes and spends $1,030 billion on purchases and transfer payments. What is Doranth's national savings, in billions of dollars?
In three lines
- A budget deficit is borrowed: DLF shifts right, or SLF shifts left, and the real interest rate rises.
- Crowding out: at the higher real rate, interest-sensitive private spending falls in the short run.
- In the long run, less investment can mean less physical capital and slower economic growth.
Exam strategy for this topic
- Section I, Multiple Choice: 60 questions in 70 minutes.
- Section II, Free Response: 3 questions in 60 minutes.
- This lesson's Explain it is shaped like free-response question 3, Short.
- A four-function calculator is allowed on both sections of the exam.
On the loanable funds graph, label the axes real interest rate and quantity of loanable funds, shift one curve with an arrow, and mark r1, r2, Q1 and Q2 with dashed lines to the axes. Then write each link in order, from the borrowing to the higher real interest rate to the fall in investment.
Questions students ask
Why does the real interest rate rise if the government is spending more?
The government spends money it first borrows from savers. That borrowing adds to the demand for loanable funds, or leaves less supply for private borrowers, so the real interest rate rises.
Should I shift the demand or the supply of loanable funds?
Either shows the same result for the real interest rate: DLF shifting right and SLF shifting left both raise it. Draw only one, because shifting both counts the same borrowing twice.
Does private borrowing fall by the full amount the government borrows?
Not when supply slopes up. In Brevik, the lesson's worked case, the government borrowed $150 billion, the real rate rose from 8% to 9%, and private borrowing fell by only $50 billion, because the higher rate drew out $100 billion of extra saving.
What kinds of spending get crowded out?
Interest-sensitive spending: firms' purchases of machines and buildings, new houses bought with mortgages, cars bought on loans. Groceries and haircuts barely respond.
How does crowding out affect long-run growth?
If investment stays lower year after year, less physical capital gets built and workers have fewer and older tools, so output per worker grows more slowly. It is a potential effect, and its size depends on how far investment falls and for how long.
What happens in the loanable funds market when the government runs a surplus?
It borrows less, so demand shifts left or supply shifts right, and the real interest rate falls. That leaves room for more private investment.
Course alignment, for teachers
AP Macroeconomics topic 5.5, Unit 5: Long-Run Consequences of Stabilization Policies.
- Skill 3.B: Determine the effect(s) of one or more changes on other economic markets.
This lesson maps all 4 essential knowledge statements of the topic to the part that teaches each one: 4 are checked by a scored question. The map is in the lesson file.