Unit 5 · Topic 5.6 · about 30 minutes · 7 parts · 10 scored checks, 1 of them multiple choice, plus 2 from earlier lessons
AP Macroeconomics 5.6: Economic Growth
Unit 5: 20 to 30% of the multiple-choice section
What you'll be able to do
- Define how economic growth is measured and what determines it, explain those determinants using graphs and data, and calculate real GDP per capita and the rate of economic growth.
- Explain, with graphs where they help, how an outward shift of the PPC relates to a rightward shift of the long-run aggregate supply (LRAS) curve.
Key vocabulary
| Term | What it means | The exam trap |
|---|---|---|
| Economic growth | A rise in an economy's real output per person over time, measured as the growth rate of real GDP per capita. | Measured with total real GDP, a country whose population grows almost as fast as its output looks like it is booming, so use the growth rate of real GDP per capita. |
| Real GDP per capita | Real GDP divided by the population: the real output for each person in the economy. | Dividing nominal GDP by population lets rising prices pass for growth, so use real GDP and then divide by population. |
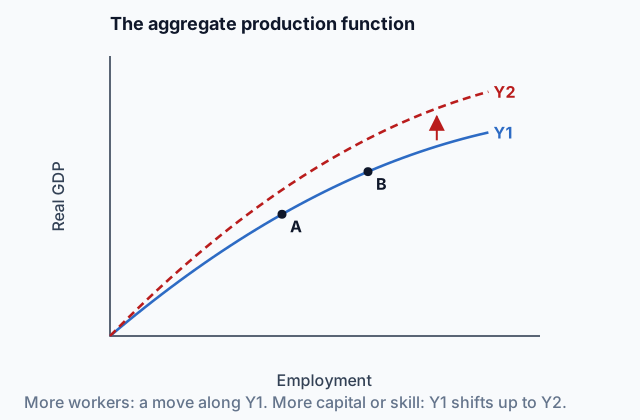
| Aggregate production function | A curve showing the real GDP an economy produces at each level of employment, given its capital and technology. | Hiring more workers is a movement along this curve, while more capital per worker or better technology shifts it up; calling the movement a shift confuses more workers with more productive ones. |
| Average labor productivity | Real output per employed worker: real GDP divided by the number of people employed. | Employed workers are the divisor, not the population or the labor force, since children, retirees and job seekers did not produce the output. |
| Physical capital | The machines, tools, equipment and buildings workers use to produce goods and services. | More of it per worker raises productivity, but new workers who each get the usual tools leave capital per worker, and so output per worker, unchanged. |
| Human capital | The skills, training and education that make a worker more productive. | Skills and education count as capital too, so a training program that raises them shifts the production function up and LRAS right, just as new machines do. |
| Technology | The knowledge of how to produce, which sets how much output given workers and capital can make. | Better methods let the same workers with the same machines produce more and shift LRAS right, while a rise in aggregate demand is not a technology change and leaves LRAS where it was. |
 Tap to open the picture full size
Part 1 Think first Two countries, two growth rates
Guess before you learn. A wrong guess still makes the answer stick.
Predict first
Over the last decade, Arvelo's real GDP grew 5 percent a year and its population grew 4 percent a year. Kalden's real GDP grew 2.5 percent a year and its population grew 0.5 percent a year. Economists judge growth by how fast output per person rises. Which country grew faster by that measure?
In short. Economic growth is a rise over time in real output per person, and it lasts when each worker produces more.
- Economists measure growth as the percent change in real GDP per capita from one year to the next.
- Average labor productivity is real output per employed worker, and it rises with better technology and with more physical and human capital per worker.
- Growth shifts the PPC outward and the long-run aggregate supply curve to the right.
Part 2 Learn it Four short ideas, each checked as you go
2a. Growth is measured per person
An economy grows when the real output available for each person rises over time. So economists measure economic growth as the growth rate of real GDP per capita, real GDP divided by population, from one year to the next.
Using real GDP keeps rising prices from passing for growth. Dividing by population means output has to rise faster than the number of people sharing it.
The calculation from a table takes three steps:
- Real GDP per capita in each year: real GDP ÷ population.
- The change: the later year's figure minus the earlier year's.
- The growth rate: that change ÷ the earlier year's figure, times 100.
Sometimes you are given growth rates instead of levels. Then real GDP per capita grows by approximately the growth rate of real GDP minus the growth rate of population. Real GDP up 3 percent with population up 1 percent is roughly 2 percent growth per person.
Quick check · Calculate
Pellon's real GDP rose from $640 billion in Year 1 to $676.5 billion in Year 2. Its population rose from 32 million to 33 million. What was Pellon's growth rate of real GDP per capita from Year 1 to Year 2, in percent?
2b. Output per worker
Firms need workers to produce. Hold everything else fixed and hire more people, and total output rises; lay people off and it falls. So aggregate employment and aggregate output are directly related. The aggregate production function shows this as a graph: real GDP on the vertical axis, employment on the horizontal, and a rising curve labeled Y1, like the one at the top of this page. Hiring more workers is a movement along that curve, from A to B. The course treats this as a graph you read when it is given to you, not one you draw.
How much each worker produces is a separate question. Average labor productivity is output per employed worker:
productivity = real GDP ÷ number of employed workers
Divide by the people who are working. Children, retirees and unemployed job seekers count in the population, and the unemployed count in the labor force, but none of them produced this output. If real GDP rises 4 percent while employment also rises 4 percent, output per worker has not changed at all.
Quick check · Calculate
Tavrin's real GDP is $1,296 billion. Its population is 48 million, its labor force is 25.6 million, and 24 million people are employed. What is Tavrin's average labor productivity, in dollars of real output per employed worker?
2c. What raises output per worker
Productivity is set by the level of technology and by how much capital each worker has:
- Physical capital per worker: the machines, tools, vehicles and buildings a worker uses.
- Human capital per worker: the skills, training and education a worker brings.
- Technology: better methods and designs, so the same worker with the same tools turns out more.
Read the words per worker closely. Hire a thousand new workers and give each the same tools and training as everyone else, and total output rises, but each worker produces what workers produced before. Capital per worker has not changed, so productivity has not either.
On the aggregate production function, more physical or human capital per worker, or better technology, shifts the curve up from Y1 to Y2: at every level of employment the economy produces more. Hold the population fixed and that is more real output per person. That is the link the curve shows: output per capita rises as physical and human capital per capita rise.
Quick check · Sort it
Each change happens on its own in an economy, with nothing else changing. Tap a change, then tap what it does.
Raises output per worker
Raises total output, not output per worker
2d. Growth on the PPC and LRAS
An outward shift of the PPC and a rightward shift of LRAS are the same event drawn two ways. Both curves show what the economy can produce with all its resources fully employed. When technology improves, or the economy gains physical capital, human capital or workers, that capacity grows: the PPC shifts outward and LRAS shifts to the right, to a larger full-employment output.
To show growth on an AD-AS graph, label the axes Price level and Real output, draw LRAS1 vertical at YF1, then LRAS2 to its right at YF2, with an arrow between them. On a PPC with Capital goods and Consumption goods on the axes, draw PPC2 outside PPC1, again with an arrow.
Moving from a point inside the PPC to a point on it is not growth. It puts idle workers and machines back to use, but the curve has not moved. Nor is a rise in aggregate demand, which raises output in the short run without moving LRAS. Growth changes what the economy can produce.
Quick check · Decide and justify
Over ten years, Nerith opens new technical colleges and its factories install faster machinery. Economists show this as an outward shift of Nerith's PPC. What happens to Nerith's long-run aggregate supply curve?
Which reason supports your choice?
Part 3 Watch it done Growth per person and per worker in Ondara
Watch each step, then do the last one yourself.
Ondara's statistics agency reports real GDP in base-year dollars. In Year 1, real GDP was $900 billion, the population 45 million and employed workers 20 million. In Year 2, real GDP was $947.7 billion, the population 45.9 million and employed workers 20.25 million. Find Ondara's rate of economic growth, then the growth rate of its labor productivity.
Step 1 · Real GDP per capita each year
Year 1: $900 billion ÷ 45 million = $20,000 per person. Year 2: $947.7 billion ÷ 45.9 million = $20,647.06 per person.
Step 2 · The growth rate per person
($20,647.06 − $20,000) ÷ $20,000 × 100 = 3.24 percent. Real GDP itself rose 5.3 percent, but the population rose 2 percent, so each person's share grew by less.
Step 3 · Output per worker in Year 1
Productivity divides by employed workers: $900 billion ÷ 20 million = $45,000 of real output per worker.
Why this step?
Why divide by 20 million employed workers rather than the population of 45 million?
Productivity asks how much each person at work produces. Dividing by 45 million would give real GDP per capita again, which counts children, retirees and the unemployed, who did not produce this output.
Your step · Calculate
Finish the analysis. Ondara's real GDP rose from $900 billion to $947.7 billion while its employed workers rose from 20 million to 20.25 million. What was the growth rate of Ondara's output per employed worker, in percent?
percent
Part 4 Try it Measure U.S. growth
These are real figures for the United States, from FRED at the Federal Reserve Bank of St. Louis, read October 14, 2026: annual averages of series GDPC1 (real GDP) and A939RX0Q048SBEA (real GDP per capita), both in chained 2017 dollars. They will be revised as new data come in.
| Measure | 2024 | 2025 |
|---|---|---|
| Real GDP (billions of chained 2017 dollars) | 23,394.9 | 23,943.3 |
| Real GDP per capita (chained 2017 dollars) | 68,789 | 70,020 |
Try it · Calculate
FRED lists U.S. real GDP per capita of $68,789 in 2024 and $70,020 in 2025, and real GDP of $23,394.9 billion in 2024 and $23,943.3 billion in 2025, all annual averages in chained 2017 dollars. Measured as economists measure growth, how fast did the U.S. economy grow from 2024 to 2025, in percent, to two decimal places?
One step further. FRED's series CE16OV puts U.S. civilian employment at 161.3 million in 2024 and 163.6 million in 2025 (the 2025 average covers 11 months, because October 2025 was not collected). Dividing real GDP by it, output per employed worker went from about $144,996 to about $146,396, a rise of about 0.97 percent. Employment grew about 1.37 percent. So most of the 2.34 percent rise in total real GDP came from more people working, and a smaller part from each worker producing more.
Part 5 Explain it Write it the way the exam asks
Nothing you type leaves this page.
Free response is 33.35% of the exam score. This one is shaped like Question 2, Short.
Free-response practice · Question 2 style
Corrin's statistics agency reports these figures, with real GDP in base-year dollars. Year 1: real GDP $2,400 billion, population 80 million, employed workers 40 million. Year 2: real GDP $2,520 billion, population 82 million, employed workers 40.5 million. (a) Calculate Corrin's rate of economic growth from Year 1 to Year 2. Show your work. (b) Did average labor productivity in Corrin increase, decrease or stay the same from Year 1 to Year 2? Explain using numbers. (c) Identify one change, other than employing more workers, that could explain your answer to (b). (d) Draw a correctly labeled graph of aggregate demand and aggregate supply showing the effect of the change you identified in (c) on long-run aggregate supply. Label full-employment output YF1 before the change and YF2 after it. (e) Draw a correctly labeled production possibilities curve for capital goods and consumption goods showing the effect of the same change.
Model answer
(a) Real GDP per capita was $2,400 billion ÷ 80 million = $30,000 in Year 1 and $2,520 billion ÷ 82 million = $30,731.71 in Year 2, so growth was ($30,731.71 − $30,000) ÷ $30,000 × 100 = 2.44 percent. (b) It increased. Output per employed worker rose from $2,400 billion ÷ 40 million = $60,000 to $2,520 billion ÷ 40.5 million = $62,222.22. (c) Workers had more physical capital to work with, such as more machines per worker. (d) Price level on the vertical axis and real output on the horizontal, with AD and SRAS drawn as usual. LRAS1 is vertical at YF1, and LRAS2 is vertical to its right at YF2, with an arrow from LRAS1 to LRAS2. (e) Capital goods on one axis and consumption goods on the other. PPC2 lies outside PPC1, with an arrow showing the outward shift.
Score your own answer. This is a self-check, not a grade. Tick each point your answer makes.
Part 6 Check yourself Read a production function
Read the table first, then answer both questions from it.
Lumeria's statistics agency estimated its aggregate production function: the real GDP Lumeria produces at each level of employment. Curve Y1 uses this year's physical capital, human capital and technology. Curve Y2 is the same economy after every worker gains an extra year of technical training, with nothing else changed. Lumeria's population is 60 million.
| Employment (millions) | Real GDP on Y1 ($ billions) | Real GDP on Y2 ($ billions) |
|---|---|---|
| 10 | 275 | 330 |
| 20 | 500 | 600 |
| 30 | 675 | 810 |
| 40 | 800 | 960 |
Case question 1 · Multiple choice
Lumeria keeps the capital, skills and technology of curve Y1, and employment rises from 20 million to 30 million. Using Lumeria's production function table, what happens to its real GDP?
Case question 2 · Calculate
Using Lumeria's production function table, with employment at 30 million and a population of 60 million, by how many dollars does the extra year of training (the move from Y1 to Y2) raise Lumeria's real GDP per capita?
The rest stand on their own and do not use the case.
Check yourself · Spot the error
Dovania's nominal GDP rose from $600 billion in Year 1 to $648 billion in Year 2, its real GDP at Year 1 prices rose from $600 billion to $612 billion, and its population rose from 20 million to 20.2 million. A student found Dovania's rate of economic growth. Tap the first line with a mistake.
Check yourself · Select all
Over fifteen years, Quintor's firms install far more equipment for each worker, and its workers become much better trained. Which two describe how this growth appears on graphs? Select two.
Select 2 answers, then check.
Part 7 Keep it Keep it
From 5.4 Government Deficits and the National Debt · Sort it
Tap a quantity, then tap the kind of measure it is.
Flow: measured across a period
Stock: measured on one date
From 2.6 Real v. Nominal GDP · Calculate
Brisa produces only three final goods. In Year 1 it made 1,000 e-readers at $120 each, 4,000 haircuts at $25 each and 6,000 bags of rice at $10 each. In Year 2 it made 1,400 e-readers at $100 each, 4,200 haircuts at $30 each and 6,100 bags of rice at $13 each. Using Year 1 as the base year, what is Brisa's real GDP in Year 2, in dollars?
In three lines
- Growth is the percent change in real GDP per capita, not in total or nominal GDP.
- Productivity is output per employed worker; technology and capital per worker raise it.
- Growth shifts the PPC outward and LRAS to the right.
Exam strategy for this topic
- Section I, Multiple Choice: 60 questions in 70 minutes.
- Section II, Free Response: 3 questions in 60 minutes.
- This lesson's Explain it is shaped like free-response question 2, Short.
- A four-function calculator is allowed on both sections of the exam.
When a table gives levels, find real GDP per capita in each year and then the percent change from the starting year; save the subtraction shortcut for questions that give growth rates. To show growth, draw LRAS2 to the right of LRAS1 or PPC2 outside PPC1, label both curves and add an arrow.
Questions students ask
Why divide by population to measure growth?
Growth is about how much output each person has. In the lesson's opening puzzle, Arvelo's real GDP grew 5% a year but its population grew 4%, so output per person rose only about 1%, slower than Kalden's roughly 2%.
How do I calculate the growth rate of real GDP per capita?
Divide real GDP by population in each year, subtract, and divide the change by the earlier year's figure. Pellon went from $640 billion ÷ 32 million = $20,000 to $676.5 billion ÷ 33 million = $20,500, which is 2.5% growth.
What is the difference between productivity and real GDP per capita?
Productivity divides real output by employed workers; real GDP per capita divides by the whole population. Tavrin's $1,296 billion of real GDP is $54,000 per employed worker but $27,000 per person, because only half of its 48 million people work.
Does hiring more workers raise productivity?
Not by itself. More workers with the same capital, skills and technology raise total output, a movement along the production function, but each worker produces what workers produced before.
Why does an outward PPC shift go with LRAS shifting right?
Both show what the economy can produce with all its resources fully employed. When that capacity grows, the PPC moves out and LRAS moves right to a larger full-employment output.
Is moving from inside the PPC to a point on it economic growth?
No. That puts idle workers and machines back to use, but the curve has not moved, and growth changes what the economy can produce.
Course alignment, for teachers
AP Macroeconomics topic 5.6, Unit 5: Long-Run Consequences of Stabilization Policies.
- Skill 2.A: Using economic concepts, principles, or models, explain how a specific economic outcome occurs or what action should be taken in order to achieve a specific economic outcome.
This lesson maps all 6 essential knowledge statements of the topic to the part that teaches each one: 6 are checked by a scored question. The map is in the lesson file.