Unit 5 · Topic 5.7 · about 30 minutes · 7 parts · 11 scored checks, 2 of them multiple choice, plus 2 from earlier lessons
AP Macroeconomics 5.7: Public Policy and Economic Growth
Unit 5: 20 to 30% of the multiple-choice section
What you'll be able to do
- Explain, with graphs where they help, public policies aimed at influencing long-run economic growth, and define supply-side fiscal policies.
Key vocabulary
| Term | What it means | The exam trap |
|---|---|---|
| Supply-side fiscal policies | Tax and spending policies that change the incentives households and firms face, so that they work, save and invest more and potential output grows. | A tax cut is supply-side only when it changes the reward for working, saving or investing; a flat rebate of the same size for every family is demand-side. |
| Labor force participation rate | The percentage of the adult population that is in the labor force, either working or looking for work. | Its base is the adult population, not the labor force, and when new participants find jobs it can raise real GDP per capita with no change in output per worker. |
| Productivity | How much real output a worker produces, measured on average as output per employed worker. | Raising it means more output per employed worker, so a policy that only puts more people to work raises real GDP per capita through participation, not productivity. |
| Infrastructure | Public capital that many firms and households use, such as roads, ports, power grids and communication networks. | Building it raises AD this year like any purchase, but what makes it a growth policy is the capacity left afterward, so naming only the AD shift misses the long-run effect. |
| Potential output | Full-employment output: the level of real GDP where unemployment equals the natural rate, shown by LRAS at YF. | Shifting LRAS right at once and saying the price level falls in the short run skips a step, because most supply-side policies move AD first and raise potential output later. |
| Real GDP per capita | Real GDP divided by the population; its growth over time is how economic growth is measured. | Equal to output per employed worker times the share of the population employed, it can rise while productivity stays flat if more people work. |
 Tap to open the picture full size
Part 1 Think first A puzzle in the growth figures
Guess before you learn. A wrong guess still makes the answer stick.
Predict first
A country's statistics office reports that output per employed worker was exactly the same in 2016 and 2026, and so was the population. Yet real GDP per capita was 8 percent higher in 2026. Which explanation fits?
In short. Public policy raises long-run growth when it leaves the economy able to produce more per person, not just to spend more this year, and supply-side fiscal policy does it by changing the incentives households and firms face.
- Growth is a rise in real GDP per capita over time, so a growth policy has to add to what the economy can produce.
- Public investment in infrastructure and technology raises productivity, which shifts LRAS right and the PPC outward.
- Supply-side fiscal policies change incentives to work, save and invest; most shift AD first and LRAS later.
Part 2 Learn it Four short ideas, each checked as you go
2a. Two pieces of output per person
Economic growth is a rise in real GDP per capita over time: real output divided by the whole population.
Real GDP per capita = output per employed worker × share of the population that is employed
The first piece is productivity. The second rises when more adults join the labor force and find work. The labor force participation rate measures the joining part: the percentage of the adult population that is in the labor force, working or looking for work.
So public policy can raise real GDP per capita through either piece. Training and better schools raise what each worker can produce. Subsidized child care, or letting retirees keep their pension while they work part-time, brings more people into jobs.
Take a country of 20 million people with 9 million employed, each producing $60,000 of real output a year. Real GDP is $540 billion and real GDP per capita is $27,000. If a child care program brings 450,000 more people into jobs at the same productivity, real GDP becomes $567 billion and real GDP per capita $28,350: 5 percent higher, with no change in what each worker produces.
Quick check · Calculate
In Tamsin, 48 percent of the population is employed. A new public child care program raises that share to 51 percent, while output per employed worker and the population stay the same. By what percent does Tamsin's real GDP per capita rise? Give your answer to two decimal places.
2b. Building what the whole economy uses
Some capital is paid for by the public and used by almost everyone. Roads, ports, power lines and broadband networks are infrastructure. When a highway is widened, a delivery driver makes more stops in a shift. When a port gets new cranes, the same dock crew unloads more ships. Output per worker rises, so this kind of public investment raises productivity.
Governments also pay for technology: basic research at universities, public laboratories, and grants that help new methods spread to firms. A better method lets the same workers and machines make more.
Both raise the economy's capacity to produce, so they show up as an outward shift of the PPC and a rightward shift of LRAS.
Not every dollar of government spending does this. A one-time payment to households raises spending this year, which moves aggregate demand, but it leaves capacity where it was. Building a road adds to spending this year too; what makes it a growth policy is the road that is still there afterward. The test is whether the economy can produce more ten years later.
Quick check · Multiple choice
Which government spending plan is most likely to raise an economy's long-run growth of real GDP per capita?
2c. Supply-side fiscal policy
Supply-side fiscal policies are changes to taxes and government spending meant to change incentives, so that households and firms choose to work, save and invest more. The name describes the target, the economy's capacity to supply output. It says nothing about who gains.
Some examples:
- A lower tax rate on each additional dollar a person earns, which raises the reward for taking a job or working more hours.
- A tax credit for firms that buy new equipment or spend on research.
- Letting firms deduct the cost of a machine from their taxes sooner, so investing pays off faster.
What makes a policy supply-side is the incentive, not the fact that a tax falls. A rebate check that is the same size whatever a family earns cuts taxes, but it rewards no extra work or investment. It raises spending, which makes it demand-side. A tax credit that a firm collects only when it invests does change behavior, because the firm has to invest to get it.
Quick check · Fill the statement
Tap a blank, then tap a phrase.
A supply-side fiscal policy works by changing that households and firms face. A tax credit that a firm receives only when it buys new machines is policy, while a rebate of the same size for every family, whatever it earns, is policy.
2d. Short run and long run on the graph
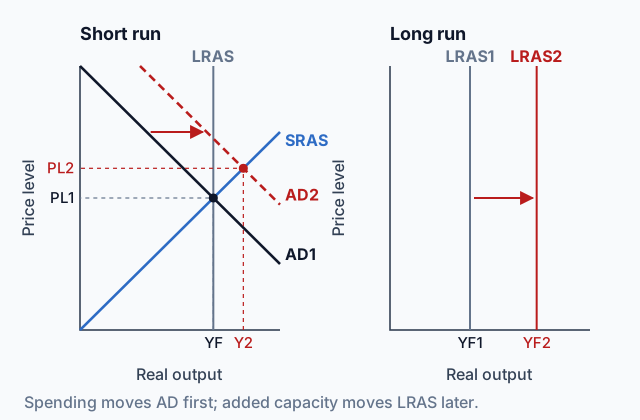
Short run. The policy sets off spending. Firms buying equipment to collect a tax credit raise investment spending; households keeping more of their pay raise consumption. Spending is aggregate demand, so AD shifts right, from AD1 to AD2, and real output and the price level both rise along SRAS. A supply-side policy that lowers firms' costs right away, such as a cut in the tax firms pay on each worker's wages, can shift SRAS right in the short run too, but for the investment and work incentives in this lesson the first shift to draw is AD.
Long run. The new machines are installed and more people are working, so the economy can produce more at full employment. Potential output grows: LRAS shifts right, from LRAS1 at YF1 to LRAS2 at YF2, and the PPC shifts outward. Draw an arrow for each shift.
The diagram at the top of the page shows both steps. How large the long-run gain is depends on the policy, and nothing in this course asks you to judge the size. The direction is what you need: AD first, then LRAS.
Quick check · Spot the error
A student explained the effects of a new tax credit that Rosmark gives firms for buying equipment. Tap the first line with a mistake.
Part 3 Watch it done A tax credit for new equipment
Watch each step, then do the last one yourself.
Varnholm's economy is in long-run equilibrium. Its government announces that for the next five years, firms can subtract 10 percent of what they spend on new machinery from the taxes they owe. Trace what happens to aggregate demand now and to the economy's capacity later.
Step 1 · Find the incentive
A machine that costs $100,000 now costs a firm $90,000 after the credit. Projects that were not quite worth doing become worth doing, so firms plan to buy more equipment.
Step 2 · The short run
Buying machines is investment spending, a part of aggregate demand. AD shifts right, from AD1 to AD2. Along SRAS, real output and the price level both rise, and unemployment falls.
Why this step?
Why does the credit move AD this year, before any new machine is running?
Buying new machines is investment spending, and the purchases happen this year as suppliers build and deliver them. Spending counts toward AD when it happens, whether or not the machine is running yet.
Your step · Decide and justify
Varnholm gives firms a tax credit: for five years, they can subtract 10 percent of what they spend on new machinery from the taxes they owe. Once the machines firms buy because of the credit are installed and in use, what happens to Varnholm's full-employment output?
Which reason supports your choice?
Varnholm in the short run
Investment spending shifts AD right from AD1 to AD2 along SRAS: Y2 is above Y1 and PL2 above PL1. Here Y1 is full-employment output, YF, where LRAS sits. The long-run LRAS shift is in the diagram at the top.
Part 4 Try it Judge the fishbowl
A fishbowl is a class discussion in two rings. Students in the inner circle argue about what a policy decision will do to economic growth. Students in the outer circle listen and judge whose argument the evidence supports. You are in the outer circle.
Sundal, a fictional country, has $4 billion to spend over five years. Three evidence cards sit on the table, and two speakers make their cases.
| Card | What it says |
|---|---|
| 1 | Trucks on Sundal's main freight highway average 19 miles per hour at busy times. On uncrowded roads they average 55. |
| 2 | Ships wait three days on average to unload at Sundal's largest port, whose cranes are 40 years old. |
| 3 | Household spending has grown every year for five years, and unemployment is at its natural rate. |
Speaker A: Spend the $4 billion widening the freight highway and replacing the port's cranes.
Speaker B: Send the $4 billion to households as a one-time payment. People will spend it, firms will sell more, and that is growth.
Try it · Decide and justify
In Sundal, freight trucks crawl on a crowded highway, ships wait three days to unload at an old port, and unemployment is at its natural rate. Which use of $4 billion does that evidence support as the better policy for long-run growth?
Which reason supports your choice?
Real participation data. FRED, the Federal Reserve Bank of St. Louis's data site, publishes the U.S. labor force participation rate measured by the Bureau of Labor Statistics (series CIVPART, seasonally adjusted, last updated October 2, 2026, read October 14, 2026). It was 66.4% in September 1990 and 61.8% in September 2026. The question below is arithmetic about the participation channel, not a claim about why the rate fell.
Try it · Calculate
The U.S. labor force participation rate was 66.4% in September 1990 and 61.8% in September 2026 (FRED series CIVPART, read October 14, 2026). Suppose it were 66.4% instead of 61.8%, with output per employed worker, the unemployment rate and the adult population's share of the total population all held at their September 2026 levels. By what percent would U.S. real GDP per capita be higher? Give your answer to two decimal places.
Part 5 Explain it Write it the way the exam asks
Nothing you type leaves this page.
Free response is 33.35% of the exam score. This one is shaped like Question 2, Short.
Free-response practice · Question 2 style
Assume the economy of Halvik is in long-run equilibrium. The government permanently lowers the tax rate on each additional dollar that households earn from work.
(a) Draw a correctly labeled graph of aggregate demand and aggregate supply showing LRAS at full-employment output labeled YF, the equilibrium price level labeled PL1 and real output labeled Y1.
(b) The tax cut raises households' disposable income. On your graph in part (a), show the short-run effect, labeling the new price level PL2 and real output Y2.
(c) Will Halvik's potential output increase, decrease, or stay the same in the long run? Explain, using the effect of the tax change on household behavior.
(d) Draw a correctly labeled production possibilities curve for Halvik, with capital goods and consumption goods on the axes, and show the long-run effect you identified in part (c).
Model answer
(a) Price level on the vertical axis and real output on the horizontal. AD1 slopes down, SRAS slopes up, and LRAS is vertical at YF. AD1 and SRAS cross on LRAS at PL1 and Y1. (b) AD shifts right to AD2, with an arrow from AD1. At the crossing of AD2 and SRAS, PL2 is above PL1 and Y2 is to the right of Y1, marked on the axes with dashed lines. (c) Potential output increases. Each extra hour of work now pays more after tax, so more people choose to join the labor force and some work more hours. More labor raises what the economy can produce at full employment. (d) Capital goods on one axis and consumption goods on the other, with a bowed-out PPC1 and a PPC2 outside it, shown by an arrow pointing outward.
Score your own answer. This is a self-check, not a grade. Tick each point your answer makes.
Part 6 Check yourself Read the growth figures
Read the table first, then answer each question from it.
Wrenmoor, a fictional country, spent eight years paying for child care for parents who take jobs and rebuilding its freight rail lines. Its statistics agency reports:
| Measure | Year 1 | Year 8 |
|---|---|---|
| Population (millions) | 40 | 42 |
| Employed workers (millions) | 18 | 21 |
| Real GDP (billions of Year 1 dollars) | 1,440 | 1,848 |
Case question 1 · Calculate
Wrenmoor's population grew from 40 million in Year 1 to 42 million in Year 8, and its real GDP, in Year 1 dollars, grew from $1,440 billion to $1,848 billion. By what percent did Wrenmoor's real GDP per capita rise from Year 1 to Year 8? Give your answer to one decimal place.
Case question 2 · Select all
Between Year 1 and Year 8, Wrenmoor's population grew from 40 million to 42 million, its employed workers from 18 million to 21 million, and its real GDP from $1,440 billion to $1,848 billion. Which two statements do these figures support? Select two.
Select 2 answers, then check.
The rest stand on their own and do not use the case.
Check yourself · Sort it
Each policy is on its own. Tap a policy, then tap the piece of real GDP per capita it mainly raises.
Output per employed worker
Share of the population that works
Check yourself · Multiple choice
A government gives firms a permanent tax credit for money they spend on research and development. Which describes the most likely effects?
Part 7 Keep it Keep it
From 5.6 Economic Growth · Calculate
Tavrin's real GDP is $1,296 billion. Its population is 48 million, its labor force is 25.6 million, and 24 million people are employed. What is Tavrin's average labor productivity, in dollars of real output per employed worker?
From 3.7 Long-Run Self-Adjustment · Sort it
Tap an event, then tap what it does to the long-run aggregate supply curve.
LRAS shifts right
LRAS shifts left
LRAS does not shift
In three lines
- Real GDP per capita grows through output per worker or the share of people working.
- Infrastructure and technology raise productivity, shifting LRAS right and the PPC out.
- Supply-side fiscal policy works through incentives: AD first, then LRAS.
Exam strategy for this topic
- Section I, Multiple Choice: 60 questions in 70 minutes.
- Section II, Free Response: 3 questions in 60 minutes.
- This lesson's Explain it is shaped like free-response question 2, Short.
- A four-function calculator is allowed on both sections of the exam.
For a supply-side policy, show two steps: AD shifts right first, with an arrow, and LRAS shifts right later to a larger full-employment output, with the PPC moving out on its own graph. Name the incentive the policy changes before you name the curve that moves.
Questions students ask
What makes a policy supply-side?
The incentive. A policy is supply-side when its benefit depends on working, saving or investing more, such as a tax credit firms get only when they buy new equipment.
Is all government spending good for long-run growth?
No. A one-time payment to households raises spending this year and shifts AD, but leaves capacity where it was. A road or a broadband line counts as a growth policy because it is still there years later.
How can real GDP per capita rise if each worker produces the same amount?
A larger share of the population can work. Take the lesson's country of 20 million: it adds 450,000 workers at $60,000 each, real GDP rises from $540 billion to $567 billion, and real GDP per capita rises 5%.
Why does a supply-side tax change shift AD before LRAS?
The first thing it changes is spending: firms buy equipment, and households keep more of their pay. The extra capacity from new machines and more workers takes time to arrive.
Does a supply-side policy lower the price level?
Not in the short run for the work and investment incentives in this topic. The first shift is AD, which raises the price level along SRAS, and any downward pull on prices comes later as LRAS moves right.
Which policies raise productivity and which raise participation?
Training for people who already have jobs, better-equipped schools and new infrastructure raise output per worker. Paid child care, letting retirees keep their pensions while they work, and a lower tax on a second earner bring more people into jobs.
Course alignment, for teachers
AP Macroeconomics topic 5.7, Unit 5: Long-Run Consequences of Stabilization Policies.
- Skill 2.A: Using economic concepts, principles, or models, explain how a specific economic outcome occurs or what action should be taken in order to achieve a specific economic outcome.
This lesson maps all 3 essential knowledge statements of the topic to the part that teaches each one: 3 are checked by a scored question. The map is in the lesson file.