Unit 6 · Topic 6.3 · about 30 minutes · 7 parts · 10 scored checks, 2 of them multiple choice, plus 2 from earlier lessons
AP Macroeconomics 6.3: The Foreign Exchange Market
Unit 6: 10 to 13% of the multiple-choice section
What you'll be able to do
- Define the foreign exchange market, the demand for a currency and the supply of a currency, and explain with a graph why the quantity of a currency demanded falls and the quantity supplied rises as its exchange rate rises.
- Define the equilibrium exchange rate and show it on a foreign exchange market graph.
- Explain with a graph how the exchange rate moves back to equilibrium when it starts above or below it.
Key vocabulary
| Term | What it means | The exam trap |
|---|---|---|
| Foreign exchange market | The market in which one currency is traded for another, with the exchange rate as the price. | Graph one currency at a time: the market for euros has quantity of euros across the bottom and dollars per euro up the side, never euros per dollar. |
| Demand for currency | The quantities of a currency people want to buy at each exchange rate, arising from the demand for the country's goods, services and financial assets. | Buyers of a currency are mostly people abroad who want the country's goods, services or assets, so a Boston family booking a hike in Iceland demands krónur though none of them is Icelandic. |
| Supply of currency | The quantities of a currency its holders offer at each exchange rate, arising from their need to make payments in other currencies. | This is not the country's money supply; it counts units of the currency offered in trade for other currencies, mostly by residents paying for things priced abroad. |
| Equilibrium exchange rate | The exchange rate at which the quantity of a currency demanded equals the quantity supplied. | At equilibrium the quantity of the currency demanded equals the quantity supplied in this market, not the demand for the currency and the country's money supply. |
| Surplus | In a currency market, the amount by which quantity supplied exceeds quantity demanded at an exchange rate above equilibrium. | Measure it as quantity supplied minus quantity demanded at the given rate, not as the distance from Q1: at 4.80 dollars per ducat that is 700 - 300 = 400 million, not 200. |
| Shortage | In a currency market, the amount by which quantity demanded exceeds quantity supplied at an exchange rate below equilibrium. | Below equilibrium the currency is cheap, so more buyers and fewer sellers leave a shortage and the rate rises, rather than a surplus that pushes it lower. |
 Tap to open the picture full size
Part 1 Think first A glacier hike in Iceland
Guess before you learn. A wrong guess still makes the answer stick.
Predict first
A family in Boston books a glacier hike with a tour company in Iceland. The company prices the hike in Icelandic krónur, so before the family can pay, U.S. dollars have to be swapped for krónur. In the foreign exchange market for krónur, what does this booking add to?
In short. The foreign exchange market is where one currency is traded for another, and its exchange rate settles where the quantity of a currency demanded equals the quantity supplied.
- The exchange rate is the currency's price, so its demand curve slopes down and its supply curve slopes up.
- On the graph, the vertical axis is the price of one unit of the currency, counted in the other currency.
- A rate above equilibrium leaves a surplus and falls; a rate below it leaves a shortage and rises.
Part 2 Learn it Four short ideas, each checked as you go
2a. Who buys a currency
The foreign exchange market is where one currency is traded for another. Look at the market for one currency at a time, say the Icelandic króna, and treat its exchange rate as its price.
The demand for a currency comes from wanting what the country sells. A tourist booking a hike, a U.S. shop importing Icelandic wool sweaters, a fund in Germany buying Icelandic government bonds: each holds some other currency and needs krónur to pay. So the demand for krónur arises from the demand for Iceland's goods, services and financial assets, and most of the buyers live abroad.
The demand curve slopes down for the same reason any demand curve does. Suppose a króna gets cheaper, so it costs fewer dollars. Then a hike priced at 30,000 krónur costs fewer dollars too, and so do the sweaters and the bonds. Buyers abroad want more of them, so they want more krónur. A lower exchange rate goes with a larger quantity of the currency demanded: an inverse relationship, as with any price.
Quick check · Sketch the graph
Varnia, a fictional country, uses a currency called the peseta. Suppose people holding U.S. dollars want to buy 100 million pesetas a day when a peseta costs $1.60, 200 million at $1.40, 300 million at $1.20, 400 million at $1.00 and 500 million at $0.80. Use that schedule to sketch the shape of the demand for pesetas: drag the points so the curve falls or rises, and bends or runs straight, the way the schedule does. The exact heights are up to you.
One shape that fits
Drag a point up or down, or tap it and use the arrow keys. Only the shape is checked.
2b. Who sells a currency
Every swap has two sides. When the Boston family buys krónur, someone hands the krónur over and takes the family's dollars. The supply of a currency comes from people who hold it and need to make payments in other currencies: an Icelandic family paying for a hotel in Orlando, an Icelandic shop importing U.S. phones, an Icelandic pension fund buying shares in U.S. companies. To pay in dollars, they sell krónur.
So one trade is a demand for one currency and a supply of the other at the same moment. The Boston family demands krónur and supplies dollars. The Icelandic shop supplies krónur and demands dollars.
The supply curve slopes up. When a króna costs more dollars, each króna an Icelander sells brings back more dollars, so U.S. goods and assets cost fewer krónur. Icelanders buy more of them and offer more krónur to pay. A higher exchange rate goes with a larger quantity of the currency supplied: a positive relationship.
The supply of krónur here is not Iceland's money supply. It counts krónur offered in trade for other currencies, not all the krónur that exist.
Quick check · Multiple choice
In the foreign exchange market for South Korean won, traded against the U.S. dollar, who supplies won?
2c. Drawing the market, and its equilibrium
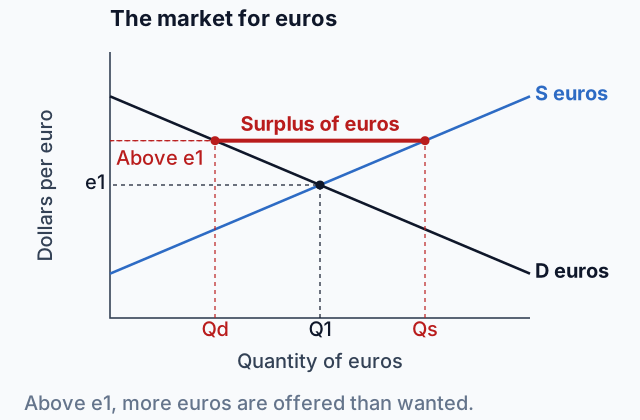
A foreign exchange graph is a demand and supply graph for one currency, and the labels are where most of the trouble is. Take the market for euros, traded against the dollar.
- The horizontal axis counts the currency being traded: Quantity of euros.
- The vertical axis is the price of one euro, counted in the other currency: Dollars per euro, which a scoring guide may write as USD/EUR.
- The curves are the demand for euros and the supply of euros, labeled with the currency: D euros and S euros.
The vertical axis is the hard one, because both currencies appear in it. Use the rule from reading quotes: the currency after "per" is the one being bought. In the market for euros, euros are being bought, so the euro goes after "per" and the price is counted in dollars. Euros per dollar is the price of a dollar, for the dollar's graph.
Traders quote it the other way round (EUR/USD 1.08 is 1.08 dollars per euro), so spell the axis out in words.
The equilibrium exchange rate is where the two curves cross. At that rate, e1, the quantity of euros demanded equals the quantity supplied, Q1. Mark both on the axes with dashed lines.
Quick check · Fill the statement
Tap a blank, then tap a phrase.
On a correctly labeled graph of the foreign exchange market for Thai baht, traded against the U.S. dollar, the vertical axis is and the horizontal axis is . The equilibrium exchange rate is the rate at which .
2d. When the rate is away from equilibrium
Suppose the euro's exchange rate sits above e1 for a moment. A euro costs more dollars than at equilibrium, so buyers want fewer euros. Holders of euros get more dollars for each one, so they offer more. Quantity supplied is greater than quantity demanded: a surplus of euros, the gap marked on the graph at the top of the page. Sellers who cannot find buyers accept fewer dollars per euro, so the rate falls and the euro depreciates. As it falls, buyers want more euros and sellers offer fewer, until the two quantities meet at e1.
Below e1 it runs the other way. A cheap euro brings more buyers and fewer sellers: a shortage of euros. Buyers who cannot get euros offer more dollars for each one, and the rate rises back to e1.
The size of a surplus or a shortage is the gap between the two quantities at that rate. It is not the distance from Q1. If buyers want 300 million euros and sellers offer 500 million, the surplus is 200 million.
Nobody has to arrange any of this. With a flexible exchange rate, buyers and sellers push the rate toward equilibrium on their own.
Quick check · Calculate
Ostavia, a fictional country, uses a currency called the ducat, and its exchange rate with the U.S. dollar is flexible. In the market for ducats, quantity demanded is Qd = 1,500 - 250e and quantity supplied is Qs = 250e - 500, where e is the exchange rate in dollars per ducat and both quantities are in millions of ducats a day. The equilibrium rate is 4 dollars per ducat. Suppose the rate is 4.80 dollars per ducat for a moment. How large is the surplus of ducats, in millions?
Part 3 Watch it done The market for rupees, labeled
Watch each step, then do the last one yourself.
India and the United States trade goods, services and financial assets, and the exchange rate between the Indian rupee and the U.S. dollar is flexible. Draw a correctly labeled graph of the foreign exchange market for rupees, showing the equilibrium exchange rate and quantity.
Step 1 · Name the market
The graph is for one currency, the rupee, so the horizontal axis is Quantity of rupees.
Step 2 · Price the rupee
The vertical axis is the price of one rupee, counted in the currency its buyers pay with: Dollars per rupee (USD/INR). Rupees are being bought, so the rupee goes after "per".
Why this step?
Why is the rupee's price counted in dollars?
On this graph the people buying rupees are paying with dollars, so a rupee's price is what one costs them in dollars. Counting it in rupees would make the price of a rupee always 1.
Step 3 · Draw and name the curves
The demand for rupees, D rupees, slopes down. It comes from people holding dollars who want Indian goods, services and assets, and they want more rupees when a rupee costs fewer dollars. The supply of rupees, S rupees, slopes up. It comes from rupee holders paying for things priced in dollars, who offer more rupees when each one brings back more dollars.
Step 4 · Mark equilibrium
Where the curves cross, the quantity of rupees demanded equals the quantity supplied. Drop dashed lines to both axes and label them e1 and Q1. The graph at the top of this page is the same drawing for the euro.
Your step · Decide and justify
Trades between India and the United States also make up a foreign exchange market for U.S. dollars, traded against the Indian rupee. On a correctly labeled graph of the foreign exchange market for dollars, what is the title of the vertical axis?
Which reason supports your choice?
Every currency market has a mirror. Each trade on the rupee graph is also a trade on the dollar graph, and the two vertical axes are the same exchange rate written the two ways you learned to flip a quote.
Part 4 Try it Draw it yourself
In the lab, each situation starts at equilibrium and then something changes how many of a currency people want to buy or sell at every exchange rate. Use the first two ideas: ask who wants the currency and who is paying with it. When buyers abroad want more of a country's goods at every rate, they want more of its currency at every rate, and the demand curve shifts right. The supply side works the same way. When the people who hold a currency want more from abroad, they offer more of their currency at every rate, and its supply curve shifts right. 6.4 Effect of Changes in Policies and Economic Conditions on the Foreign Exchange Market takes those shifts further. Here the labels are the point.
Now one away from equilibrium. Put the steps in the order they happen.
Try it · Put it in order
The market for Ghanaian cedis, traded against the U.S. dollar at a flexible exchange rate, opens one morning at a rate above its equilibrium. Tap the steps in the order they happen.
Part 5 Explain it Write it the way the exam asks
Nothing you type leaves this page.
Free response is 33.35% of the exam score. This one is shaped like Question 2, Short.
Free-response practice · Question 2 style
Teluria, a fictional country, uses a currency called the tela. Teluria trades with the United States, and the exchange rate between the tela and the U.S. dollar is flexible.
(a) Draw a correctly labeled graph of the foreign exchange market for the tela. Label the equilibrium exchange rate e1 and the equilibrium quantity Q1.
(b) Explain why the quantity of telas demanded is larger at a lower exchange rate.
(c) Suppose the exchange rate is above e1 for a moment. Will there be a shortage or a surplus of telas? Explain how the exchange rate returns to e1.
Model answer
(a) The vertical axis is Dollars per tela (USD/tela) and the horizontal axis is Quantity of telas. A downward-sloping demand curve, D telas, and an upward-sloping supply curve, S telas, cross at the equilibrium exchange rate e1 and quantity Q1, marked with dashed lines on both axes. (b) At a lower exchange rate a tela costs fewer dollars, so Telurian goods, services and financial assets cost less for people paying in dollars. They buy more of them, so they want more telas. (c) There will be a surplus of telas, because at a rate above e1 the quantity of telas supplied is greater than the quantity demanded. Holders of telas who cannot find buyers accept fewer dollars per tela, so the exchange rate falls until the quantity demanded equals the quantity supplied at e1.
Score your own answer. This is a self-check, not a grade. Tick each point your answer makes.
Part 6 Check yourself Read a currency market from its schedule
Read the table first, then answer both questions from it.
Halvia, a fictional country, uses a currency called the dobra, and its exchange rate with the U.S. dollar is flexible. The table shows the market for dobras on one day.
| Dollars per dobra | Quantity of dobras demanded | Quantity of dobras supplied |
|---|---|---|
| 0.80 | 700 | 350 |
| 0.90 | 600 | 425 |
| 1.00 | 500 | 500 |
| 1.10 | 400 | 575 |
| 1.20 | 300 | 650 |
Case question 1 · Calculate
Using the table of Halvia's market for dobras, how large is the shortage of dobras at 0.90 dollars per dobra, in millions of dobras?
Case question 2 · Multiple choice
Using the table of Halvia's market for dobras, suppose trading opens at 1.10 dollars per dobra. Which describes the market at that rate and what happens next?
The rest stand on their own and do not use the case.
Check yourself · Sort it
Each transaction between Chile and the United States needs a swap of Chilean pesos and U.S. dollars. Tap a transaction, then tap what it adds to in the foreign exchange market for pesos.
The demand for pesos
The supply of pesos
Check yourself · Spot the error
The market for Polish zlotys, traded against the U.S. dollar at a flexible exchange rate, opens one day at a rate, in dollars per zloty, below its equilibrium rate. A student explained what happens next. Tap the first line that goes wrong.
Part 7 Keep it Keep it
One conversion runs the other way from the cello, and one asks which currency rose. Write the units before you calculate.
From 6.2 Exchange Rates · Calculate
A weaver in Vermont sells a wool blanket for $60 and ships one to a buyer in Italy. The exchange rate is 1.25 U.S. dollars per euro. What is the blanket's price in euros?
Ebbland, a fictional country, recorded these transactions with the rest of the world last year.
| Transaction | Amount |
|---|---|
| Exports of goods | 900 |
| Imports of goods | 1,100 |
| Exports of services | 250 |
| Imports of services | 150 |
| Interest and dividends received from abroad | 80 |
| Interest and dividends paid abroad | 60 |
| Money sent abroad by Ebbland residents to relatives | 40 |
| Foreigners buy Ebbland government bonds and factories | 520 |
| Ebbland residents buy shares in foreign companies | 400 |
From 6.1 Balance of Payments Accounts · Calculate
Using the table of Ebbland's international transactions, what was Ebbland's capital and financial account balance, in millions of dollars? Enter a deficit as a negative number.
In three lines
- Demand for a currency comes from wanting the country's goods, services and assets; supply comes from paying in other currencies.
- Graph a currency with its quantity across and its price, in the other currency, up the side.
- Above equilibrium is a surplus and the rate falls; below it is a shortage and the rate rises.
Exam strategy for this topic
- Section I, Multiple Choice: 60 questions in 70 minutes.
- Section II, Free Response: 3 questions in 60 minutes.
- This lesson's Explain it is shaped like free-response question 2, Short.
- A four-function calculator is allowed on both sections of the exam.
Label the vertical axis as the price of one unit of the currency in the other currency, such as dollars per euro, and the horizontal axis as the quantity of that currency, then mark e1 and Q1 with dashed lines. When the rate starts away from equilibrium, say whether there is a surplus or a shortage and which way the rate moves.
Questions students ask
Why does the demand for a currency slope down?
When a currency gets cheaper, everything priced in it costs less for people paying with other currencies. They buy more of the country's goods, services and assets, so they want more of its currency.
If an American company changes its peso profits into dollars, is that demand for pesos or supply of pesos?
Supply. Turning pesos into dollars means selling pesos, whoever is doing it. Ask what the person holds and what they need, not where they live.
Is the supply of a currency the same as the money supply?
No. In the foreign exchange market the supply counts the units offered in trade for other currencies at each exchange rate. The money supply is all the money in the economy, and it is drawn on a different graph.
What happens if the exchange rate is above equilibrium?
Quantity supplied is greater than quantity demanded, so there is a surplus of the currency. Sellers who cannot find buyers accept less of the other currency for each unit, and the rate falls until the two quantities are equal.
Why is the dollar graph's vertical axis the flip of the euro graph's?
Each graph prices its own currency. The market for euros shows dollars per euro and the market for dollars shows euros per dollar, which is the same exchange rate written the two ways.
Course alignment, for teachers
AP Macroeconomics topic 6.3, Unit 6: Open Economy—International Trade and Finance.
- Skill 4.A: Draw an accurately labeled graph or visual to represent an economic model or market.
This lesson maps all 4 essential knowledge statements of the topic to the part that teaches each one: 4 are checked by a scored question. The map is in the lesson file.