Unit 6 · Topic 6.5 · about 30 minutes · 7 parts · 10 scored checks, 1 of them multiple choice, plus 2 from earlier lessons
AP Microeconomics 6.5: Inequality
Unit 6: 8 to 13% of the multiple-choice section
What you'll be able to do
- Define the measures of inequality in income and wealth, and compare distributions using Lorenz curves and Gini coefficients.
- Explain the sources of income and wealth inequality, from what each factor of production earns to tax structures.
Key vocabulary
| Term | What it means | The exam trap |
|---|---|---|
| Income | Money a household receives over a period, from wages, interest, rent and profit. | It counts every source, not only pay from a job. Interest and rent from what a household owns are income too. |
| Wealth | The value of what a household owns, minus what it owes. | Debts are subtracted. A large house bought with a large loan may add little to a household's wealth. |
| Poverty rate | The share of people whose income is below a set poverty line. | It counts people below a line, so it says nothing about how far below the line they are. |
| Lorenz curve | A graph of the percentage of total income received by each percentage of households, lined up poorest first, beside a line of equality. | Households are lined up poorest first, so the curve can never rise above the line of equality. |
| Gini coefficient | A single number from 0 to 1 that sums up a Lorenz curve. | It compares how income is shared, not how high incomes are. Two countries with very different average incomes can have the same Gini coefficient. |
| Human capital | The knowledge and skills a worker has gained from education, training and experience. | It belongs to the worker, not the employer. A worker takes it along when she changes jobs. |
| Progressive tax | A tax that takes a larger share of income as income rises. | It is not a tax on the rich alone. Under a progressive income tax, many middle-income households pay too. |
| Regressive tax | A tax that takes a smaller share of income as income rises. | It is not a tax on the poor alone. A regressive tax can apply to every household. |
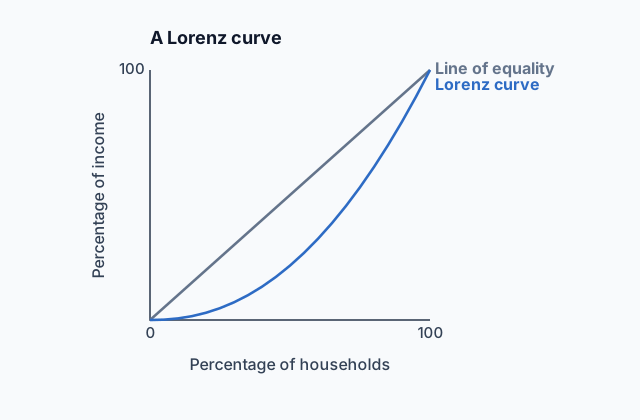 Tap to open the picture full size
Part 1 Think first Two paychecks at one hospital
Make a guess first. Even a wrong guess helps the answer stick.
Predict first
Mira is a nurse and Theo is a cashier in the cafeteria of the same hospital. They work the same hours, and Mira earns about twice Theo's pay. Which is the likeliest main reason?
In short. Inequality is how unevenly income and wealth are spread across households, within a country and between countries.
- The lesson shows how inequality is measured and compared.
- It traces where differences in income and wealth come from.
- It ends with how a tax structure changes who keeps what.
Part 2 Learn it Three ideas, with a check after each
2a. Measuring inequality
Income is what a household receives over a period, a year say, from wages, interest, rent and profit. Wealth is what it owns, its savings, home and investments, minus what it owes. A household can have a high income and little wealth, or the reverse. The poverty rate is the share of people whose income is below a set poverty line.
Income levels and poverty rates vary greatly across countries, and also within one country, across groups such as age, gender and race.
Two tools describe how evenly income or wealth is spread.
- A Lorenz curve lines households up from poorest to richest and plots the percentage of all income received by each percentage of households. If income were split equally, it would be the diagonal line of equality: the poorest 40% would get 40%. The farther the curve bows below that line, the less equal the distribution.
- The Gini coefficient sums the curve up in one number from 0 to 1: 0 is complete equality, and the closer it is to 1, the more unequal the distribution.
Both are used to compare countries, policies or years. Students read and compare them; drawing a Lorenz curve or calculating a Gini coefficient is not part of the course.
Quick check · Multiple choice
Country X's Lorenz curve for income lies farther from the line of equality than Country Y's. Which statement is true?
2b. Where differences in income and wealth come from
In factor markets, each factor of production is paid about the value of its marginal product: a worker's wage tracks what one more hour of that kind of work adds to an employer's revenue. Work that is productive and that few people can do pays more, so differences in marginal products become differences in income.
Many things shape what people earn and own:
- Human capital: education, training and experience, which raise a worker's productivity.
- Social capital: the networks of people who can pass on job openings, advice and opportunities.
- Discrimination: unequal pay or hiring for equally productive people, because of race, gender or other traits.
- Mobility: the ability to move to better jobs, cities or schools.
- Bargaining power within firms, labor unions and families: who gets what share.
- Access to financial markets: the ability to borrow to start a business or buy a home, and to invest savings.
- Inheritance: wealth passed from one generation to the next, which then earns income of its own.
Quick check · Match
Each situation shows a source of inequality. Tap a situation, then tap its source.
2c. Tax structures and inequality
A tax's effect on inequality depends on how its burden compares with income. Compare the share of income each household pays, its average tax rate, not the dollars.
- A progressive tax takes a larger share of income as income rises, such as an income tax whose rates climb in steps. It narrows the gap between after-tax incomes.
- A regressive tax takes a smaller share of income as income rises. A sales tax is often regressive: lower-income households spend more of their income, and so pay a larger share of it in tax, even at one rate for everyone. A flat dollar amount per person is regressive too.
A country's mix of taxes is one source of inequality in after-tax income. Changing the mix, toward more progressive taxes or more regressive ones, changes how unequal after-tax incomes are.
Quick check · Sort it
Each card describes a tax. Tap a card, then tap the kind of tax structure it is.
Progressive
Regressive
Part 3 Watch it done Who pays a sales tax
Follow each step, then finish the last one yourself.
A state has a 5% sales tax. The Alvarez family earns $30,000 a year and spends $24,000 of it on taxed goods. The Brooks family earns $120,000 a year and spends $60,000 on taxed goods. What share of its income does each family pay in sales tax, and is the tax progressive or regressive?
Step 1 · Dollars of tax
Alvarez: 5% × $24,000 = $1,200. Brooks: 5% × $60,000 = $3,000. The Brooks family pays more dollars.
Step 2 · Share of income for the Alvarez family
$1,200 ÷ $30,000 = 4% of its income.
Why this step?
Why compare the tax with each family's income instead of comparing the dollars?
Inequality is about how much each household keeps out of what it has. A tax that takes more dollars from the richer family can still take a smaller part of its income, leaving the gap wider.
Your step · Calculate
A state has a 5% sales tax. The Brooks family earns $120,000 a year and spends $60,000 of it on taxed goods. What percentage of its income does the Brooks family pay in sales tax?
%
The Alvarez family pays 4% of its income and the Brooks family 2.5%. The share falls as income rises, so this sales tax is regressive, even though the richer family pays more dollars.
Part 4 Try it Rank five countries
Read each country's measure the way the lesson did, and put them in order.
Try it · Rank it
Five countries report on how income is distributed. Norland's Gini coefficient is 0.27, Easton's is 0.41, Westmark's is 0.33 and Southby's is 0.48. In Highland every household receives the same income. Rank the countries by how equally income is distributed.
Most equal first
Give each one a place, 1 for first. Give two the same place if they are equal.
Your ranking: none yet
Part 5 Explain it Answer a short free-response question
Nothing you type leaves this page. Write your answer, then compare it with the model.
Free response is 33.35% of the exam score. This one is shaped like Question 2, Short.
Free-response practice · Question 2 style
Country X's Lorenz curve for income lies closer to the line of equality than Country Y's. (a) Which country has the larger Gini coefficient? Explain. (b) In both countries, workers are paid the value of their marginal product. Explain how a difference in human capital between two workers can lead to a difference in their incomes. (c) Country X replaces a sales tax, which takes a larger share of income from lower-income households, with a progressive income tax that raises the same revenue. Will after-tax income in Country X become more equally or less equally distributed? Explain.
Model answer
(a) Country Y. Its Lorenz curve lies farther from the line of equality, which means income is less equally distributed, and a less equal distribution has a larger Gini coefficient. (b) A worker with more human capital, from education or training, produces more each hour, so the value of her marginal product is higher, and employers pay her more. (c) More equally. The sales tax took a larger share of income from lower-income households and the progressive tax takes a larger share from higher-income households, so after-tax incomes move closer together.
Score your own answer. This is a self-check, not a grade. Tick each point your answer makes.
Part 6 Check yourself Lakeshire's income tax
The case questions can all be answered from this information.
The state of Lakeshire taxes income in two brackets. Every taxpayer pays the first rate on the part of their income up to $40,000, and the second rate only on the part above $40,000.
| Part of income | Tax rate on that part |
|---|---|
| Up to $40,000 | 10% |
| Above $40,000 | 25% |
Case question 1 · Calculate
How much income tax, in dollars, does a Lakeshire taxpayer with an income of $100,000 owe?
Case question 2 · Calculate
What is the average tax rate, as a percentage of income, for a Lakeshire taxpayer with an income of $100,000?
Case question 3 · Decide and justify
A Lakeshire taxpayer with an income of $40,000 pays $4,000 in income tax, and one with an income of $200,000 pays $44,000. Is Lakeshire's income tax progressive?
Which reason supports your choice?
The rest stand on their own and do not use the case.
Check yourself · Spot the error
A student wrote notes on measuring inequality. Tap the first line with a mistake.
Check yourself · Select all
Lena's employer sells its product in a perfectly competitive market, and Lena is paid the value of her marginal product. Which two of these would raise the wage she can earn, other things equal? Pick two.
Select 2 answers, then check.
Part 7 Keep it Keep it
From 6.4 The Effects of Government Intervention in Different Market Structures · Calculate
A monopoly faces demand P = 24 − Q, so its marginal revenue is MR = 24 − 2Q, and its marginal cost is $6 at every quantity. Unregulated, it sells 9 units at $15. A regulator sets a price ceiling of $10. How many units does the monopoly now sell?
From 6.2 Externalities · Calculate
In a perfectly competitive market for cement, marginal private benefit is P = 30 − 0.5Q and marginal private cost is P = 6 + 0.5Q, with P in dollars a ton and Q in thousands of tons. Dust from making each ton imposes an external cost of $4 on nearby residents, and there is no external benefit. What is the socially optimal quantity, in thousands of tons?
In three lines
- Income is a flow and wealth a stock; income levels and poverty rates vary across countries and across groups within them.
- A Lorenz curve farther from the line of equality, and a larger Gini coefficient, mean a less equal distribution.
- Factors are paid the value of their marginal product, and human capital, social capital, discrimination, mobility, bargaining power, access to finance, inheritance and tax structures all shape inequality.
Exam strategy for this topic
- Section I, Multiple Choice: 60 questions in 70 minutes.
- Section II, Free Response: 3 questions in 60 minutes.
- This lesson's Explain it is shaped like free-response question 2, Short.
- A four-function calculator is allowed on both sections of the exam.
When you compare two Lorenz curves or Gini coefficients, say which distribution is less equal and why in one sentence. When you classify a tax, compute or compare the share of income paid at two incomes, never just the dollars.
Questions students ask
What is the difference between income inequality and wealth inequality?
Income is what households receive over a period; wealth is what they own minus what they owe. Inheritance and access to financial markets shape wealth, and wealth then earns income of its own.
How do you read a Lorenz curve?
It plots the percentage of income received by each percentage of households, poorest first. The diagonal line of equality is a perfectly equal split; the farther the curve bows below it, the less equal the distribution.
What does a Gini coefficient of 0 or 1 mean?
0 means complete equality: every household has the same income. The closer it is to 1, the more unequal the distribution. Calculating a Gini coefficient, like drawing a Lorenz curve, is beyond the scope of the course; comparing them is not.
Why do some workers earn more than others?
Workers are paid about the value of their marginal product, so productive, scarce skills pay more. Human capital, social capital, discrimination, mobility and bargaining power all shape those differences.
Is a sales tax progressive or regressive?
Usually regressive. Lower-income households spend more of their income, so even a single rate takes a larger share of their income than of a higher-income household's.
Beyond the AP Exam
College Board sets this limit on what the AP Exam asks about this topic. Anything past it is not on the exam.
Drawing the Lorenz curve and calculating Gini coefficients are beyond the scope of the course and the AP Exam.
Course alignment, for teachers
AP Microeconomics topic 6.5, Unit 6: Market Failure and the Role of Government.
- Skill 1.A: Describe economic concepts, principles, or models.
This lesson maps all 4 essential knowledge statements of the topic to the part that teaches each one: 4 are checked by a scored question. The map is in the lesson file.