Unit 14 · Topic 14.2 · about 30 minutes · 7 parts · 10 scored checks, 1 of them multiple choice, plus 2 from earlier lessons
AP Physics 2: Algebra-Based 14.2: Periodic Waves
Unit 14: 12 to 15% of the multiple-choice section
What you'll be able to do
- Describe the physical properties of a periodic wave: its period, frequency, amplitude and wavelength, read from graphs against position and against time, and related by .
Key vocabulary
| Term | What it means | The exam trap |
|---|---|---|
| Oscillation | One complete cycle of a back-and-forth motion, ending where and how it began. | One oscillation is a full cycle, out and back again, not a single swing from one side to the other. |
| Crest and trough | The highest and the lowest points of a wave, as drawn on a graph of displacement. | A crest and a trough are points on the wave, not distances; a crest is a place, not a size. |
| Sinusoidal wave | A wave whose shape is a sine or cosine curve. | A sine curve and a cosine curve are both sinusoidal; they differ only in where the graph starts. |
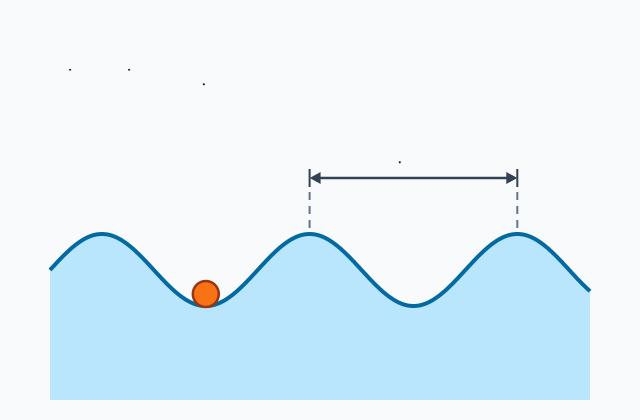 Tap to open the picture full size
Part 1 Think first A low note and a high note
Commit to a guess first. Being wrong now makes the right idea stick better.
Predict first
Two tuning forks are struck. Fork A's prongs vibrate 256 times each second and fork B's 512 times each second. How do the two sounds compare?
In short. A periodic wave repeats: its period is the time for one oscillation, its frequency is , and its wavelength is .
- A higher frequency is a higher pitch and, at a given amplitude, carries more energy; the amplitude does not depend on the frequency.
- On a graph against position, crest to crest is the wavelength; on a graph against time, crest to crest is the period.
- The source sets the frequency and the medium sets the speed, so in one medium a higher frequency means a shorter wavelength.
Part 2 Learn it Period, frequency and wavelength
2a. Period and frequency
A periodic wave repeats the same motion over and over. Two numbers describe the repeats.
- The period is the time for one complete oscillation, in seconds.
- The frequency is the rate the wave repeats: oscillations per second, in hertz (Hz). One hertz is one oscillation each second.
They are reciprocals:
A wave at 100 Hz repeats every s, or 10 ms.
Frequency is what you hear as pitch: a higher frequency is a higher note. At a given amplitude, a wave of higher frequency also carries more energy, because the medium is shaken back and forth more times each second.
The amplitude is independent of the period and the frequency. A speaker can play a high note softly or a low note loudly, and a fork struck softly or hard still sounds its own note. Amplitude and frequency are separate dials.
Quick check · Calculate
A violin string vibrates at 250 Hz. What is the period of the sound wave it makes, in milliseconds? Use it to test a friend's claim that each vibration lasts longer than 5 ms.
2b. Two graphs that look alike
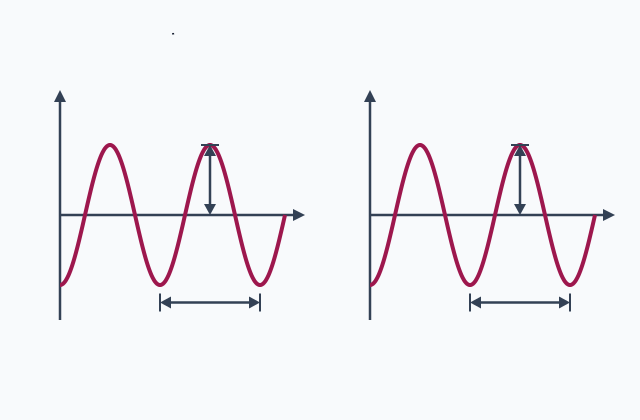
A wave can be graphed two ways, and the two graphs look almost the same. Read the horizontal axis first.
- A graph against position, displacement against , is a snapshot of the whole wave at one instant. The distance between successive corresponding points, crest to crest or trough to trough, is the wavelength , in meters.
- A graph against time, displacement against , follows one point of the medium as the wave passes. Crest to crest on this graph is the period , in seconds.
On either graph the amplitude is the height of a crest above the middle line.
For a sinusoidal wave, the graph against time at one place and the graph against position at one instant are cosine curves:
The first repeats each time grows by one period, . The second repeats each time grows by one wavelength.
Quick check · Match
Tap each measurement of a wave, then what it gives you.
2c. Wavelength, speed and frequency
In one period, a wave moves forward exactly one wavelength. So its speed is , or
The wavelength is proportional to the speed and inversely proportional to the frequency.
Read the equation the right way round. The source sets the frequency: a speaker cone that moves back and forth 400 times a second makes a 400 Hz sound. The medium sets the speed, as the last lesson showed. The wavelength is what results.
In air at room temperature, where sound travels at about 343 m/s (a typical value), a 343 Hz note has a wavelength of 1.0 m and a 686 Hz note a wavelength of 0.50 m. Neither note travels faster than the other. Played underwater, where sound travels at about 1480 m/s (typical), the 343 Hz note has a wavelength of about 4.3 m.
Quick check · Rank it
Four sound waves: A is 200 Hz in air, B is 400 Hz in air, C is 400 Hz in water, and D is 800 Hz in water. Take sound to travel at 340 m/s in this air and 1500 m/s in this water. Rank the waves by wavelength.
Longest wavelength first
Give each one a place, 1 for first. Give two the same place if they are equal.
Your ranking: none yet
Part 3 Watch it done A float on the waves
Predict first, then watch each step, then finish the problem yourself.
In the picture at the top of this lesson, waves roll past a float on open water. The float bobs up and down 12 times in 30 s, and the crests are 5.0 m apart. How fast do the crests travel?
Predict first
Before you open the first step, predict: how fast do the crests travel across the water?
Step 1 · Find the period
Twelve bobs in 30 s means each one takes s.
Step 2 · Find the frequency
Hz.
Why this step?
Why is one bob of the float one period of the wave?
The float rides the water at one place. It goes through one full up-and-down each time one whole wavelength, crest to crest, passes it, and that takes one period.
Your step · Calculate
Finish it. Water waves have a frequency of 0.40 Hz, and their crests are 5.0 m apart. How fast do the crests travel? Use your speed to test a swimmer's claim that the crests outrun her best speed, 1.5 m/s.
m/s
Part 4 Try it The source and the medium
Predict first: if you shake the end of a rope twice as often, do its crests travel faster, at the same speed, or more slowly? Then decide a claim, and sort what sets each property of a wave.
Try it · Decide and justify
Maya shakes one end of a long rope up and down 2 times each second, and the crests on the rope are 1.5 m apart. She speeds up to 4 shakes each second, with the tension unchanged. She says the crests now travel along the rope twice as fast, since they leave her hand twice as often. Is she right?
Which reason supports your answer?
Try it · Sort it
A speaker plays a steady note in a room. Each card names a property of the sound wave. Tap a card, then what sets it.
The speaker
The air
Both together
Part 5 Explain it Wave speed in a ripple tank
On the exam this is handwritten, so answer on paper first. Nothing you type here leaves this page. Then check your answer against the model and each scoring point.
Free response is 50% of the exam score. This one is shaped like Question 3, Experimental Design and Analysis.
Free-response practice · Question 3 style
A student wants to find the speed of water waves in a ripple tank whose water is the same depth everywhere. A motor-driven bar dips into the water at one end and makes straight waves. She can set the bar's frequency, and she has a ruler and a camera.
(a) Describe a procedure she could use to collect data for a graph that gives the speed of the waves. Say what she changes, what she measures, and one step that reduces experimental uncertainty. On paper, lay out the data table she would fill in, with a heading and a unit for each column.
(b) Her results, frequency and wavelength, are below. Describe what she should plot on each axis so that the slope of a straight best-fit line is the speed of the waves, and explain why. Then make that graph on paper, with a scale on each axis, and draw a best-fit line. Do this by hand before you open the model.
- 4.0 Hz and 5.1 cm
- 5.0 Hz and 3.9 cm
- 8.0 Hz and 2.6 cm
- 10 Hz and 2.0 cm
- 16 Hz and 1.2 cm
(c) Use your best-fit line to calculate the speed of the waves.
Model answer
(a) Set the bar to a frequency, say 4.0 Hz, and photograph the waves from above with the ruler lying in the tank. On the photo, measure the distance across several crests and divide by the number of wavelengths it spans, which is more precise than measuring one wavelength. Repeat at 5.0, 8.0, 10 and 16 Hz. To reduce uncertainty further, take two photos at each frequency and average. The table has three columns: frequency (Hz), wavelength (cm), and one over the frequency (s).
(b) Since , plot the wavelength on the vertical axis against , the period, on the horizontal axis. The points then fall on a straight line through the origin whose slope is . Wavelength against frequency itself would be a curve, because the two are inversely proportional. The values of are 0.250, 0.200, 0.125, 0.100 and 0.0625 s. See the graph below: a scale on each axis and one straight best-fit line through the points, passing very near the origin.
(c) From (0.050 s, 0.98 cm) and (0.250 s, 5.04 cm) on the line, the slope is cm/s, so the waves travel at about 20 cm/s, or 0.20 m/s.
Wavelength against one over the frequency, with the best-fit line
The line passes very near the origin and through (0.250 s, 5.04 cm).
Score your own answer. This is a self-check, not a grade. Tick each point your answer makes.
Part 6 Check yourself One wave, two graphs
Both case questions use the two graphs.
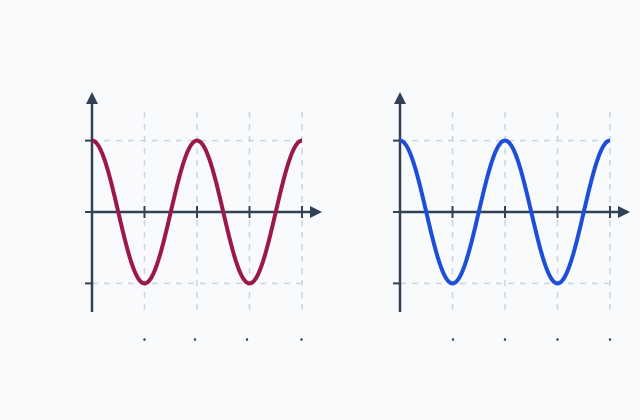
A steady wave travels along a long rope. The left graph is a snapshot: the rope's displacement against position at one instant, . The right graph follows one point of the rope, at : its displacement against time.
Case question 1 · Calculate
Using the two graphs: how fast does the wave travel along the rope? Use your speed to test a classmate's claim that the wave crosses 6.0 m of this rope in less than 3 s.
Case question 2 · Multiple choice
Using the two graphs: which equation describes the displacement of the point of the rope at as a function of time?
The rest stand on their own and do not use the case.
Check yourself · Spot the error
A student finds the wavelength of a note. Tap the first line that goes wrong.
Check yourself · Fill the statement
Complete the statements about two notes from one speaker. Tap a blank, then an answer.
A speaker plays a note, then a note of twice the frequency at the same amplitude. The second note has a pitch, and it carries energy. Its amplitude its frequency, so the speaker could also play it more softly.
Part 7 Keep it Bring back earlier ideas
What sets a pulse's speed, from the last lesson, and the critical angle from Unit 13 are still part of the course. Retrieving them now, between new ideas, is what makes them easy to find later.
From 14.1 Properties of Wave Pulses and Waves · Decide and justify
A student holds one end of a long rope tied to a wall, and the tension in the rope stays the same throughout. She says that if she flicks her end harder, making a taller pulse, the pulse will reach the wall sooner. Is she right?
Which reason supports your answer?
Predict first: in the layer with the largest index of refraction, will the ray make the smallest angle with the normal or the largest? Then rank the layers in the picture, and predict how a critical angle changes when an index grows.
From 13.3 Refraction · Calculate
For light inside one kind of glass meeting air, the critical angle is 40.0°. A second kind of glass has an index of refraction 1.20 times as large. What is the critical angle for light inside the second glass meeting air? Give your answer to the nearest 0.1°.
In three lines
- The period is the time for one oscillation and the frequency the number each second, ; frequency sets pitch and, with amplitude, energy.
- Crest to crest against position is the wavelength, against time the period; the amplitude is measured from the middle line.
- : the source sets the frequency, the medium sets the speed, and the wavelength follows.
Exam strategy for this topic
- Section I, Multiple Choice: 42 questions in 85 minutes.
- Section II, Free Response: 4 questions in 95 minutes.
- This lesson's Explain it is shaped like free-response question 3, Experimental Design and Analysis.
- A four-function, scientific, or graphing calculator is allowed on both sections of the exam.
Before you read any spacing off a wave graph, write the horizontal axis label beside it, x or t. The most common slip on these graphs is reading a wavelength off a time axis, or a period off a position axis.
Questions students ask
What is the difference between period and frequency?
The period is the time for one complete oscillation, in seconds. The frequency is how many oscillations happen each second, in hertz. They are reciprocals: .
How do you find the wavelength from a graph?
Use a graph of displacement against position and measure from one crest to the next, or one trough to the next. On a graph against time, the same spacing is the period, not the wavelength.
Does a higher frequency make a wave travel faster?
No. In one medium the speed is set by the medium. A higher frequency gives a shorter wavelength, by , at the same speed.
What is the relationship between frequency and pitch?
Pitch is how a listener hears the frequency of a sound: a higher frequency is a higher pitch. Loudness is separate, and follows the amplitude.
What equations describe a sinusoidal wave?
At one place, displacement against time is . At one instant, displacement against position is .
Course alignment, for teachers
AP Physics 2: Algebra-Based topic 14.2, Unit 14: Waves, Sound, and Physical Optics.
- Skill 1.A: Create diagrams, tables, charts, or schematics to represent physical situations.
- Skill 2.C: Compare physical quantities between two or more scenarios or at different times and locations in a single scenario.
- Skill 3.B: Apply an appropriate law, definition, theoretical relationship, or model to make a claim.
- Skill 3.C: Justify or support a claim using evidence from experimental data, physical representations, or physical principles or laws.
This lesson maps all 9 essential knowledge statements of the topic to the part that teaches each one: 9 are checked by a scored question. The map is in the lesson file.