Unit 1 · Topic 1.3 · about 30 minutes · 7 parts · 14 scored checks, 3 of them multiple choice
AP Physics C: Mechanics 1.3: Representing Motion
Unit 1: 10 to 15% of the multiple-choice section
What you'll be able to do
- Describe an object's position, velocity and acceleration from a motion diagram, a graph, an equation or a description, and move from one of those representations to another.
Key vocabulary
| Term | What it means | The exam trap |
|---|---|---|
| Motion diagram | A picture of an object's positions at equal time intervals, drawn as a row of dots along its path. | A motion diagram shows only where the object is at each tick, and the row of dots is not the shape of any graph against time. |
| Kinematic equations | The three equations , and , for motion in one dimension. | All three assume one constant acceleration for the whole interval; when the acceleration changes partway, split the motion into pieces or integrate. |
| Acceleration due to gravity | Near Earth's surface, the vertical acceleration caused by gravity, which is downward, constant and about m/s². | is a size and is always positive; the sign of comes from the direction you chose as positive. |
| Slope of a tangent line | The steepness of the line that touches a graph at one point; on a position-time graph it is the velocity at that instant, and on a velocity-time graph it is the acceleration. | A line through two separate points of a graph gives an average over the interval between them, not the value at one instant. |
| Area under a curve | The area between a graph and the time axis over an interval; under a velocity-time graph it is the displacement, and under an acceleration-time graph it is the change in velocity. | Multiply the axes' units to see what an area means: m/s times s is meters, a displacement, never a velocity. |
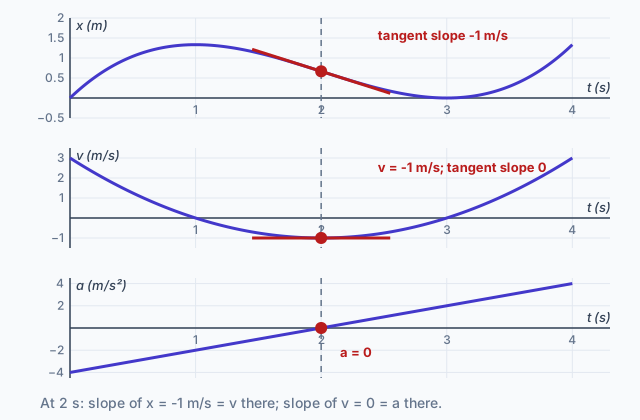 Tap to open the picture full size
Part 1 Think first The graph of a toss
Commit to a guess first. Being wrong now makes the right idea stick better.
Predict first
You toss a ball straight up and catch it on the way down. A motion sensor graphs the ball's velocity against time, with up as positive. What shape does the graph make, from the toss to the catch?
In short. One motion can be shown as a motion diagram, a graph, an equation or a description; on graphs against time, the slope of the position graph is the velocity, the slope of the velocity graph is the acceleration, and areas under those graphs give the changes.
- A tangent's slope on one graph is the value on the next: and .
- The area under a velocity graph is the displacement, , and the area under an acceleration graph is the change in velocity; area below the time axis counts as negative.
- With a constant acceleration the three kinematic equations hold, and an object in free fall near Earth's surface has a constant acceleration of m/s² downward.
Part 2 Learn it Four ideas, with a check after each
2a. One motion, several representations
A cart starts 2 m along a track from the origin, moving in the positive direction at 4 m/s and speeding up by 2 m/s every second. That sentence is a narrative description, and it is only one way to show the motion.
- A motion diagram marks where the cart is at equal time intervals, as a row of dots. Here each gap is longer than the one before, because the cart covers more ground each second.
- An equation gives the position at any time: , with in meters and in seconds.
- Graphs against time show position, velocity and acceleration. This cart's position graph curves upward, its velocity graph is a straight line rising from 4 m/s, and its acceleration graph is level at 2 m/s².
- A figure of the track, with the origin and the positive direction marked, fixes what every sign means.
Each one shows something the others hide. The equation gives exact numbers, the graph shows at a glance when the cart is fastest, and the motion diagram shows where it is. Physics questions often hand you one representation and ask you for another, so moving between them is the skill this topic practices.
Quick check · Match
Each cart moves along a straight track. Its motion diagram marks its position with a dot once every second, and is in meters with in seconds. Tap a description, then the position equation for the same motion.
2b. Slopes: from one graph to the next
The three graphs at the top of this page show one cart's motion on a shared time axis: , its velocity and its acceleration, in meters and seconds.
The slope of the tangent line to the position graph at an instant is the velocity at that instant:
At 2 s the tangent to the position graph slopes down at m/s, and the velocity graph reads m/s. The same is true one graph down: the slope of the tangent to the velocity graph is the acceleration,
At 2 s the velocity graph is at its lowest point, its tangent is level, and the acceleration graph reads 0.
So reading down the stack, each slope becomes the next graph's value. A peak or valley on one graph, where the tangent is level, is a zero on the graph below it: the position peaks at 1 s, exactly where the velocity crosses zero. A graph that curves upward has a growing slope, so the graph below it is rising there, and the graph below that one is positive.
To decide from graphs whether an object is speeding up, compare the sign of the velocity with the sign of the acceleration at that instant. The same sign means speeding up, and opposite signs mean slowing down.
Quick check · Decide and justify
A motion sensor graphs a cart's velocity against time, with the direction of increasing as positive. At s the graph is below the time axis and sloping upward toward it. At that instant, is the cart speeding up or slowing down?
Which reason supports your answer?
2c. Areas: from one graph back to the one before
Going back up the stack takes areas. The displacement over an interval is the area between the velocity graph and the time axis, and the change in velocity is the area under the acceleration graph:
Area below the time axis counts as negative. In the graphs at the top of this page, the velocity is negative from 1 s to 3 s, and
so the cart moves about 1.33 m in the negative direction, which is just what the position graph shows as it falls from 1.33 m to 0.
When a graph is made of straight pieces, you can find each area with rectangles and triangles instead of an integral. Either way, multiply the axes' units to see what an area means: m/s times s is meters.
An area is a change, not a value. To get the velocity at a later time, add the change to the velocity you started with:
The same goes for position: add the displacement to the starting position.
Quick check · Calculate
A rocket sled moves along a straight track; take forward as positive. Its acceleration is , with in m/s² and in seconds, for s. At it moves forward at 4 m/s. What is its velocity at s?
2d. Constant acceleration and free fall
When the acceleration is constant, integrating it is quick. Integrate once, then again, starting from and :
Eliminate between those two and you get the third:
These are the kinematic equations. On graphs they describe a level acceleration graph, a straight-line velocity graph with slope , and a curved position graph. They work in any single direction, so for vertical motion write in place of . Pick the equation that leaves out the quantity you neither know nor want: the third has no time in it.
Near Earth's surface, an object moving under gravity alone has a vertical acceleration that is downward, constant, and about m/s². That holds on the way up, at the top and on the way down. This course uses 10 m/s² in every calculation; the more precise 9.8 or 9.81 m/s² is also accepted.
is a size, so it is positive. The sign of comes from your choice of positive direction: with up as positive, m/s².
Quick check · Calculate
A student throws a stone straight up at 12 m/s. Air resistance is negligible. Take up as positive. How high above the point where it leaves her hand does the stone rise?
Part 3 Watch it done An elevator ride, from its acceleration
Watch each step, then do the last one yourself.
An elevator starts from rest at the ground floor; take up as positive. Its acceleration is +2.0 m/s² from to 2.0 s, zero from 2.0 s to 6.0 s, and m/s² from 6.0 s to 8.0 s. How far up does it travel in those 8.0 s?
Step 1 · Use the area under the acceleration graph
From 0 to 2.0 s the acceleration graph is a rectangle 2.0 s wide and 2.0 m/s² tall, so m/s. The elevator started from rest, so m/s at 2.0 s.
Step 2 · Build the velocity graph
From 2.0 s to 6.0 s the area is zero, so the velocity stays 4.0 m/s. From 6.0 s to 8.0 s the area is m/s, which brings the elevator back to rest. The velocity graph is a trapezoid: a ramp up to 4.0 m/s, a level top, and a ramp down to zero at 8.0 s.
Why this step?
Why does the velocity stay at 4.0 m/s from 2.0 s to 6.0 s instead of dropping to zero along with the acceleration?
Acceleration is the rate of change of velocity, so zero acceleration means the velocity stops changing, not that it disappears. The elevator keeps the velocity it had at 2.0 s until the acceleration changes it again.
Your step · Calculate
Finish it. How far up does the elevator travel from to 8.0 s? Up is positive.
m
Part 4 Try it New situations
Try it · Sketch the graph
A cart starts from rest on a level track; take forward as positive. Its acceleration is , with in m/s² and in seconds. Sketch its velocity against time from 0 to 4 s. The first point is fixed at 0.
One shape that fits
Drag a point up or down, or tap it and use the arrow keys. The shape is checked, and so are the values the question lets you work out.
Try it · Calculate
Two identical cars brake on the same dry road with the same constant acceleration until they stop. Car B is moving 3 times as fast as car A when its brakes go on. What is the ratio of B's stopping distance to A's, ?
On paper. For the cart in the sketch question, draw its position graph for the same 4 s directly above your velocity sketch, on the same time scale, with the cart starting at the origin. Use the velocity graph to decide where the position graph is steepest and whether it is ever level. Then draw the cart's motion diagram with a dot every second, and check that its gaps tell the same story as your two graphs.
Part 5 Explain it Draw it, derive it, connect the two
Nothing you type leaves this page. Check your answer against the model and each scoring point.
Free response is 50% of the exam score. This one is shaped like Question 2, Translation Between Representations.
Free-response practice · Question 2 style
A ball is launched straight up from the ground with speed and lands back on the ground. Air resistance is negligible. Take up as positive.
(a) On paper, sketch graphs of the ball's vertical velocity and its height against time, from launch to landing, one above the other on the same time scale. Label the time at which the ball is highest and the time at which it lands, in terms of and .
(b) Starting from , derive an expression for the ball's maximum height in terms of and .
(c) Explain how your velocity graph from part (a) can be used to find , and show that it gives the same expression as part (b).
(d) A second ball is launched straight up with speed . How does its maximum height compare with ? Justify your answer using your expression from part (b).
Model answer
(a) The velocity graph is a straight line from at , with slope , crossing zero at and reaching when the ball lands at . The height graph is a curve that opens downward, starting at 0, peaking at at with a level tangent there, and returning to 0 at .
(b) and . At the top , so and .
(c) is the ball's displacement from launch to the top, which is the area under the velocity graph from 0 to . That area is a triangle with base and height , so , the same as part (b).
(d) Four times as high. depends on the square of the launch speed, so doubling it gives . On the graph, the triangle has twice the height and twice the base, so four times the area.
Score your own answer. This is a self-check, not a grade. Tick each point your answer makes.
Part 6 Check yourself A cart rolls up a ramp and back
The case questions use the sensor readings and the fit. Answer them from those.
A physics class gives a cart a push up a long, straight ramp and lets it go; take up the ramp as positive. Timing starts just after the push. A motion sensor records the cart's velocity every 0.5 s, and the software fits a straight line to the readings: , with in m/s and in seconds.
| (s) | (m/s) |
|---|---|
| 0 | 2.39 |
| 0.5 | 2.02 |
| 1.0 | 1.59 |
| 1.5 | 1.21 |
| 2.0 | 0.79 |
| 2.5 | 0.41 |
| 3.0 | 0.02 |
| 3.5 | −0.41 |
| 4.0 | −0.80 |
Case question 1 · Multiple choice
Using the software's fit, what is the cart's displacement from to s? Up the ramp is positive.
Case question 2 · Calculate
Using the software's fit, how far up the ramp does the cart travel from until it turns around? Up the ramp is positive.
Case question 3 · Multiple choice
A student claims the cart's acceleration is zero at s, because the cart stops there for an instant. Which evidence from the readings best shows that the claim is wrong?
The rest stand on their own and do not use the case.
Check yourself · Sort it
Tap a card, then say whether you find it from a slope of the graph named or from an area under it.
A slope
An area
Check yourself · Spot the error
A cart starts from rest and rolls down a straight ramp with constant acceleration of size . A student derives how far it rolls in a time , , in terms of and . Tap the first line with a mistake.
Part 7 Keep it Bring back earlier ideas
This lesson stands on velocity from Topic 1.2 and on vectors from Topic 1.1. Pulling them back up is what makes them last.
Bring it back · Multiple choice
A cart's position is , with in meters and in seconds; take the direction of increasing as positive. What is the cart's average velocity from s to s?
Bring it back · Calculate
A drone's displacement is m. What is the magnitude of the displacement?
In three lines
- A motion diagram, an equation, a description and graphs of , and against time can all show the same motion.
- Slopes take you down the stack, and ; areas take you back up as changes, and .
- For a constant acceleration use the three kinematic equations, and in free fall near Earth take with up positive, m/s².
Exam strategy for this topic
- Section I, Multiple Choice: 42 questions in 85 minutes.
- Section II, Free Response: 4 questions in 95 minutes.
- This lesson's Explain it is shaped like free-response question 2, Translation Between Representations.
- A four-function, scientific, or graphing calculator is allowed on both sections of the exam.
When a question hands you one representation and asks for another, say which feature you are reading, such as the slope of the velocity graph at 3 s or the area under it from 0 to 2 s. Then write the derivative or integral that matches, the substitution, and the result with its unit. Before you use a kinematic equation, check that the acceleration is constant over the whole interval.
Questions students ask
How do I know whether to use a slope or an area?
Think of the stack position, velocity, acceleration. Going down the stack, from position to velocity or velocity to acceleration, is a slope, the derivative. Going back up is an area, the integral, plus a starting value.
Do the kinematic equations work when the acceleration changes?
No. All three assume the acceleration is constant over the interval. If it changes in steps, use them on each piece separately; if it changes smoothly with time, integrate.
What value of g should I use?
10 m/s², the value the course uses for every numerical answer. The more precise 9.8 or 9.81 m/s² is also accepted when used correctly.
What is the difference between a motion diagram and a position graph?
A motion diagram shows positions in space, along the path, at equal time steps. A position graph puts time on one axis, so it shows when as well as where. A ball thrown straight up makes a motion diagram on one vertical line, but its position graph is a curve.
Can I find a displacement from a graph without integrating?
Yes, when the velocity graph is made of straight pieces. Split the area into rectangles and triangles, count the parts below the time axis as negative, and add them up.
Course alignment, for teachers
AP Physics C: Mechanics topic 1.3, Unit 1: Kinematics.
- Skill 1.C: Create qualitative sketches of graphs that represent features of a model or the behavior of the physical system.
- Skill 2.A: Derive a symbolic expression from known quantities by selecting and following a logical mathematical pathway.
- Skill 2.D: Predict new values or factors of change of physical quantities using functional dependence between variables.
- Skill 3.C: Justify or support a claim using evidence from experimental data, physical representations, or physical principles or laws.
This lesson maps all 8 essential knowledge statements of the topic to the part that teaches each one: 8 are checked by a scored question. The map is in the lesson file.