Unit 1 · Topic 1.1 · about 30 minutes · 7 parts · 10 scored checks, 2 of them multiple choice
Change in Tandem
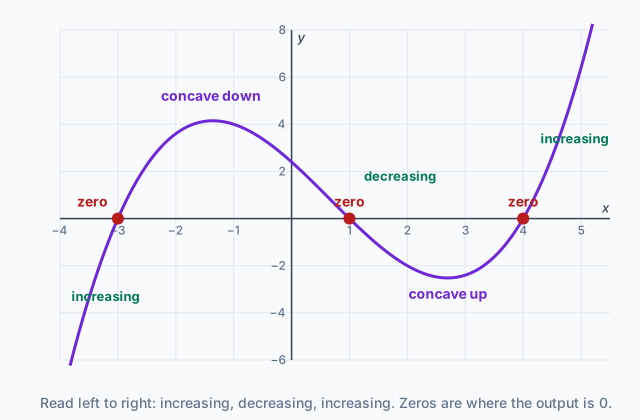 Tap to open the picture full size
Part 1 Think first
Filling a vase
Guess before you learn. A wrong guess still makes the answer stick.
Predict first
Water pours at a steady rate into a flower vase that is narrow at the bottom and wide at the top. As the vase fills, how does the height of the water change?
In short. Two quantities change in tandem when a function rule ties them together, giving each input value exactly one output value.
- The domain is the set of inputs and the range is the set of outputs. An input's image is its one output; an output's preimage is every input that gives it.
- A function is increasing on an interval if larger inputs always give larger outputs, and decreasing if they always give smaller ones.
- A graph is concave up where the rate of change is increasing and concave down where it is decreasing. Zeros are the inputs where the output is 0.
Part 2 Learn it
Four short ideas, each checked as you go
2a. What a function is
A function is a rule that takes each input value to exactly one output value. The set of input values is the domain, and the set of output values is the range. The input variable is the independent variable. The output variable is the dependent variable, because its value depends on the input.
A parking garage that charges by the hour is a function: each number of hours gives one charge, . The rule could be a sign with a table on it, a graph, a formula or a sentence. All of them say how input and output vary in tandem.
The output for one input is that input's image: is the image of 3. Going the other way, the preimage of an output is the set of every input that produces it. If the garage charges 12 dollars for any stay from 2 to 4 hours, the preimage of 12 holds all of those times, not one.
Two functions and are equal only when they have the same domain and for every input in it.
Quick check · Match
No calculator. A garage charges dollars to park for hours. Tap a term, then the phrase it matches.
2b. Increasing and decreasing
A function is increasing on an interval if, as the input values increase, the output values always increase. In symbols: for all and in the interval, if , then .
A function is decreasing on an interval if, as the input values increase, the output values always decrease: if , then .
The definition says always, so one drop anywhere in the interval rules out increasing. Here is the temperature in a greenhouse, , in degrees Fahrenheit, hours after 6 a.m.
| (hours) | (degrees) |
|---|---|
| 0 | 58 |
| 2 | 66 |
| 4 | 79 |
| 6 | 84 |
| 8 | 77 |
| 10 | 70 |
From to , each later reading is warmer, so the data show increasing. From to it is decreasing. Over the whole day, from 0 to 10, is neither, even though is bigger than : the readings fall between 6 and 10, and that fall is what rules out increasing.
Quick check · Multiple choice
No calculator. A function has , , , and . Between these inputs its graph is made of straight segments. On which interval is decreasing?
2c. Graphs and zeros
The graph of a function is its input-output pairs drawn as points: is on the graph when . Read from left to right, the graph shows how the outputs change as the inputs increase. It rises where the function is increasing and falls where it is decreasing.
Where the graph meets the -axis, the output value is zero. The input values where that happens are the zeros of the function.
In a context, a zero usually marks a moment worth knowing. A phone at 80 percent charge that loses 5 percentage points an hour has battery level . Setting gives : the zero is the hour the battery runs out.
Quick check · Calculate
No calculator. A stone is dropped from a bridge 144 feet above a river. Its height above the water after seconds is feet. What is the zero of in this context, in seconds?
2d. Concave up and concave down
Two graphs can both rise and still look different. One climbs more and more steeply; the other climbs less and less steeply. The difference is in the rate of change, how fast the output changes as the input increases.
- Where the rate of change is increasing, the graph is concave up. It bends upward, like a bowl.
- Where the rate of change is decreasing, the graph is concave down. It bends downward, like a dome.
This works for falling graphs too. A cup of coffee cools fast at first and then more slowly. Its temperature is decreasing, but its rate of change moves from about degrees per minute toward degree per minute. Those rates are getting larger, so the graph is concave up.
The vase from the start is concave down: the water keeps rising, but by less each second.
Quick check · Sort it
No calculator. Tap a description, then tap the shape of its graph.
Concave up
Concave down
Part 3 Watch it done
Describing a road into a desert basin
Watch each step, then do the last one yourself.
A road runs from a mountain pass down into a desert basin and up the far side. is the road's elevation in meters compared with sea level, kilometers from the pass. Between the listed points the road runs straight.
, , , , , .
Describe how and vary together, and find every zero.
Step 1 · Where it decreases
As goes from 0 to 12, each output is lower than the one before: 360, 120, 0, . So is decreasing from to .
Step 2 · Where it increases
From to the outputs rise: , 0, 90. So is increasing there. The lowest point in the data is 80 meters below sea level, at .
Why this step?
Why is distance the independent variable here, and not elevation?
Each distance along the road has exactly one elevation, so elevation is a function of distance. The other way round fails: the elevation 0 belongs to two different distances, so its preimage has two inputs and distance cannot be a function of elevation.
Step 3 · The first zero
The output is 0 at . The road crosses sea level 8 kilometers from the pass, on the way down.
Your step · Calculate
No calculator. Finish the description. At what other distance, in kilometers, is ?
km
Part 4 Try it
From a story to a graph
A graph can be built from words alone. Decide what the input and the output are, then ask, part by part, whether the output is rising, falling or holding still, and how fast.
Try it · Put it in order
No calculator. Maya walks from home to a bus stop at a steady pace and waits there a few minutes. She rides the bus farther from home at a much faster steady speed, then gets off and walks a short way back toward home to the library. A graph shows her distance from home against time. Tap its four pieces in order, left to right.
Part 5 Explain it
Write it the way the exam asks
Nothing you type leaves this page.
Free response is 37.5% of the exam score. This one is shaped like Question 1, Function Concepts.
Free-response practice · Question 1 style
Graphing calculator required. A function has , , and . A classmate says is increasing from to because . Explain why that reasoning does not show that is increasing, and use the values to show that it is not.
Model answer
Increasing means that for every pair of inputs in the interval, . Comparing the two endpoints checks only one pair. The values give a pair that fails: , but and , so the output went down while the input went up. So is not increasing from to .
Score your own answer. This is a self-check, not a grade. Tick each point your answer makes.
Part 6 Check yourself
A reservoir after a dry summer
The two case questions use the same data. Answer them from the table.
A town measures its reservoir against the normal level once a month. is the water level in feet above normal, months after June 1. A negative value means the water is below normal. Between readings the level changes steadily.
| (months) | (feet) |
|---|---|
| 0 | 2 |
| 1 | 0 |
| 2 | −3 |
| 3 | −4 |
| 4 | −1 |
| 5 | 0 |
| 6 | 3 |
Case question 1 · Multiple choice
No calculator. On which of these intervals is decreasing?
Case question 2 · Calculate
No calculator. How many zeros does have from to ?
The rest stand on their own and do not use the case.
Check yourself · Decide and justify
No calculator. Let for every real number , and let . Are and equal functions?
Which reason supports your answer?
Check yourself · Fill the statement
No calculator. A function gives a student's score on each of five quizzes. Quizzes 1 to 5 scored 8, 10, 7, 10 and 9. Tap a blank, then tap an answer.
The image of 3 is . The preimage of 10 is .
Part 7 Keep it
Hold on to it
This is the first lesson of the course, so there is nothing earlier to bring back yet. From the next lesson on, two questions from earlier lessons appear here.
In three lines
- A function gives each input exactly one output. The domain is the set of inputs, the range is the set of outputs, and inputs and outputs vary in tandem.
- Increasing means larger inputs always give larger outputs on the interval; decreasing means they always give smaller ones.
- Concave up means the rate of change is increasing, concave down means it is decreasing, and zeros are where the output is 0.
Vocabulary
- Function
- A rule that maps each input value to exactly one output value.
- Domain
- The set of input values of a function.
- Range
- The set of output values of a function.
- Independent variable
- The variable that stands for the input values.
- Dependent variable
- The variable that stands for the output values, which depend on the input.
- Image
- The single output value a function gives for one input value.
- Preimage
- The set of all input values that give a particular output value.
- Increasing
- On an interval, larger inputs always give larger outputs: if , then .
- Decreasing
- On an interval, larger inputs always give smaller outputs: if , then .
- Concave up
- The shape of a graph on an interval where its rate of change is increasing.
- Concave down
- The shape of a graph on an interval where its rate of change is decreasing.
- Zero
- An input value where the output is zero; the graph meets the -axis there.
Course alignment, for teachers
AP Precalculus topic 1.1, Unit 1: Polynomial and Rational Functions.
- Skill 2.B: Construct equivalent graphical, numerical, analytical, and verbal representations of functions that are useful in a given mathematical or applied context, with and without technology.
- Skill 3.A: Describe the characteristics of a function with varying levels of precision, depending on the function representation and available mathematical tools.
This lesson maps all 9 essential knowledge statements of the topic to the part that teaches each one: 9 are checked by a scored question. The map is in the lesson file.