Unit 1 · Topic 1.2 · about 30 minutes · 7 parts · 12 scored checks, 2 of them multiple choice
Rates of Change
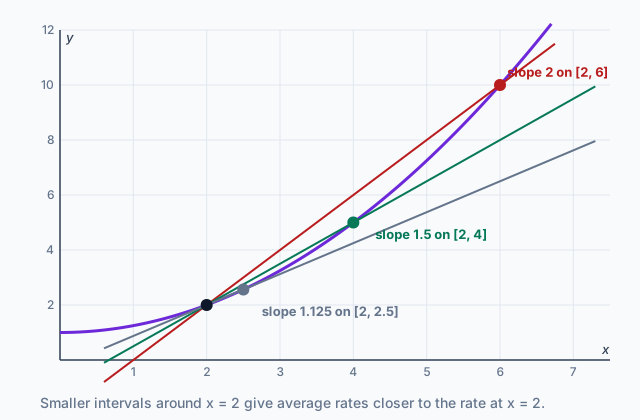 Tap to open the picture full size
Part 1 Think first
Was the car always going 60?
Guess before you learn. A wrong guess still makes the answer stick.
Predict first
A family drives 120 miles in exactly 2 hours, through a town and then onto a highway. Which statement must be true?
In short. A rate of change says how fast one quantity changes as another changes, measured in output units per input unit.
- The average rate of change over an interval is the change in output divided by the change in input.
- A positive rate means the two quantities rise or fall together; a negative rate means one rises as the other falls.
- The rate of change at a point is estimated by average rates of change over smaller and smaller intervals around it.
Part 2 Learn it
Four short ideas, each checked as you go
2a. Average rate of change
The average rate of change of a function over an interval is the ratio of the change in output values to the change in input values:
It is also the constant rate of change that would produce the same change in output over that interval. The family's car changed speed many times, but a steady 60 miles per hour gives the same 120 miles in 2 hours.
The units are always output units per input unit. A cup of tea that cools from 190 degrees to 150 degrees in 8 minutes has an average rate of change of degrees per minute. The order matters: the later value comes first on top and on the bottom, so a cooling cup gets a negative rate.
Quick check · Multiple choice
No calculator. A town's population was 52,000 in 2010 and 61,000 in 2020. What was the average rate of change of the population over that decade?
2b. Positive and negative rates
Rates of change measure how two quantities vary together, and the sign tells you the direction.
- A positive rate of change means that as one quantity increases, the other increases, and as one decreases, the other decreases. They move the same way.
- A negative rate of change means that as one quantity increases, the other decreases.
Careful with situations told backward. "As the price of a concert ticket falls, more tickets sell" describes a negative rate: read it forward, and as the price rises, fewer tickets sell. What matters is whether the two quantities move the same way or opposite ways.
Quick check · Sort it
No calculator. Tap a situation, then tap the sign of the rate of change of the second quantity with respect to the first.
Positive
Negative
2c. The rate of change at a point
The rate of change at a point is how fast the output would change if the input changed right at that moment, like the number on a speedometer. A table or a formula rarely gives it to you directly, but you can approximate it.
Use the average rate of change over a small interval containing the point. The smaller the interval, the less room the function has to speed up or slow down inside it, so the closer the average is to the rate at the point.
For a stone dropped from a cliff, the distance fallen is meters after seconds. Over the whole first 2 seconds its average rate is under 10 meters per second, but at it is falling about twice that fast. A long interval hides how fast it is going at the end.
Quick check · Calculate
No calculator. For the falling stone, , and , in meters. Use the interval from to to estimate the rate of change of at , in meters per second.
2d. Comparing rates at two points
To compare how fast a function changes at two points, estimate the rate at each one the same way: an average rate of change over a small interval containing each point, ideally intervals of the same length.
A large output and a fast change are different things. A full bathtub can have a deep water level that is barely changing, and a nearly empty one can be filling fast. Compare the rates, not the values.
Quick check · Decide and justify
No calculator. Water flows into a tank. Its depth , in centimeters, minutes after the tap opens, has , , and . Is the depth changing faster at or at ?
Which reason supports your answer?
Part 3 Watch it done
How fast is the pizza cooling?
Watch each step, then do the last one yourself.
A pizza comes out of the oven. Its surface temperature , in degrees Fahrenheit, minutes later, is measured:
, , , .
Estimate how fast it is cooling at and at , and compare.
Step 1 · Near 2 minutes
Use the small interval from 1.9 to 2.1: . At the rate of change is about degrees per minute: the pizza is cooling by about 27 degrees each minute.
Why this step?
Why use 1.9 to 2.1 instead of 0 to 2?
The rate at a point is approximated by an average over a small interval that contains the point. Over 0 to 2 the pizza was cooling faster at the start than at the end, so that average would describe the whole two minutes, not the moment .
Step 2 · Same length near 10
Use an interval of the same length, 0.2 minutes, around , so the two estimates are made the same way: from to .
Your step · Calculate
No calculator. Finish it. Estimate the rate of change of at , in degrees per minute. A falling temperature has a negative rate of change.
degrees per minute
Part 4 Try it
Find the mistake, then practice
Try it · Spot the error
No calculator. A student finds the average rate of change of from to , where and . Tap the line with the mistake.
Part 5 Explain it
Write it the way the exam asks
Nothing you type leaves this page.
Free response is 37.5% of the exam score. This one is shaped like Question 2, Modeling a Non-Periodic Context.
Free-response practice · Question 2 style
Graphing calculator required. A rain barrel drains through a tap. The volume of water in it, liters, minutes after the tap opens, has , , and . Use average rates of change, with units, to explain whether the water drains faster near the start or near the end of this time.
Model answer
From to the average rate of change is liters per minute. From to it is liters per minute. Both are negative because the volume decreases as time increases, and the first is larger in size, so the water drains faster near the start than near the end.
Score your own answer. This is a self-check, not a grade. Tick each point your answer makes.
Part 6 Check yourself
A weather balloon
The two case questions use the same data. Answer them from the table.
A weather service launches a balloon. is its altitude in meters minutes after launch.
| (minutes) | (meters) |
|---|---|
| 0 | 0 |
| 10 | 1800 |
| 20 | 3300 |
| 30 | 4500 |
| 40 | 5400 |
Case question 1 · Calculate
No calculator. What is the average rate of change of from to , in meters per minute?
Case question 2 · Multiple choice
No calculator. The average rate of change of from to is 180 meters per minute. Which statement interprets it correctly?
The rest stand on their own and do not use the case.
Check yourself · Put it in order
No calculator. Using the balloon table, tap these intervals in order from the greatest average rate of change of to the least.
Check yourself · Fill the statement
No calculator. Tap a blank, then tap a word.
As the balloon climbs, the air pressure around it drops, so the rate of change of pressure with respect to altitude is . As it climbs, its distance from the ground grows, so that rate of change is .
Part 7 Keep it
Bring back earlier ideas
Pulling an older idea back up is what makes it last.
From 1.1 Change in Tandem · Sort it
No calculator. Tap a description, then tap the shape of its graph.
Concave up
Concave down
A graph can be built from words alone. Decide what the input and the output are, then ask, part by part, whether the output is rising, falling or holding still, and how fast.
From 1.1 Change in Tandem · Put it in order
No calculator. Maya walks from home to a bus stop at a steady pace and waits there a few minutes. She rides the bus farther from home at a much faster steady speed, then gets off and walks a short way back toward home to the library. A graph shows her distance from home against time. Tap its four pieces in order, left to right.
In three lines
- Average rate of change is change in output over change in input, in output units per input unit.
- A positive rate means the two quantities move the same way; a negative rate means they move opposite ways.
- Estimate the rate at a point with an average over a small interval containing it, and compare two points the same way.
Vocabulary
- Rate of change
- How fast one quantity changes compared with another, in output units per input unit.
- Average rate of change
- The change in output divided by the change in input over an interval; the constant rate that gives the same change.
- Rate of change at a point
- How fast the output would change if the input changed at that moment, estimated with average rates over small intervals containing the point.
- Positive rate of change
- The two quantities increase together or decrease together.
- Negative rate of change
- As one quantity increases, the other decreases.
Course alignment, for teachers
AP Precalculus topic 1.2, Unit 1: Polynomial and Rational Functions.
- Skill 2.A: Identify information from graphical, numerical, analytical, and verbal representations to answer a question or construct a model, with and without technology.
- Skill 3.A: Describe the characteristics of a function with varying levels of precision, depending on the function representation and available mathematical tools.
This lesson maps all 6 essential knowledge statements of the topic to the part that teaches each one: 6 are checked by a scored question. The map is in the lesson file.