Unit 3 · Topic 3.5 · about 30 minutes · 7 parts · 13 scored checks, 1 of them multiple choice
Sinusoidal Functions
 Tap to open the picture full size
Part 1 Think first
How far does the buoy move?
Guess before you learn. A wrong guess still makes the answer stick.
Predict first
A buoy in a harbor rides up and down on the swells. At the top of each swell it sits 2.9 meters above a marker on the harbor floor, and at the bottom it sits 1.5 meters above the marker. A friend says the buoy swings 1.4 meters away from its middle height. How far does it really move from its middle height, at most?
In short. A sinusoidal function is any stretch or shift of , cosine included, and its graph is described by its amplitude, midline, period and frequency.
- Amplitude is half the difference between the maximum and minimum values, and the midline is the horizontal line through their average. For and they are 1 and .
- The period is the horizontal length of one cycle, such as from one maximum to the next, and the frequency is its reciprocal. Sine and cosine have period and frequency .
- The graph is concave down where it is higher than its midline and concave up where it is lower, so its points of inflection are on the midline. Cosine is sine shifted: .
Part 2 Learn it
Four short ideas, each checked as you go
2a. Sine, cosine and the whole family
Start with . Stretch its graph, squeeze it, slide it up or down or sideways, and whatever you get is a sinusoidal function. Those moves are the additive and multiplicative transformations you met in Unit 1, applied to sine. In topic 3.6 you will see each one written into the form .
Cosine is already in the family. Slide the sine graph units to the left and it lands exactly on the cosine graph:
Test one input. At the right side is , and . So cosine is sine with a phase shift, and both are sinusoidal.
Where the two graphs differ is symmetry. The sine graph has rotational symmetry about the origin: , so sine is an odd function. The cosine graph has reflective symmetry over the -axis: , so cosine is an even function.
Quick check · Decide and justify
No calculator. Is a sinusoidal function?
Which reason supports your answer?
2b. Amplitude and midline from the maximum and minimum
A sinusoidal graph swings between a highest output, its maximum, and a lowest output, its minimum. Two numbers come straight from those.
The amplitude is half the difference between the maximum and the minimum. The midline is the horizontal line through their average:
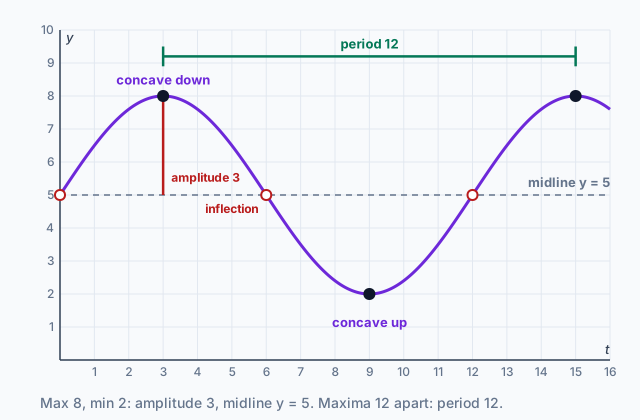
In the diagram the graph tops out at 8 and bottoms out at 2. The amplitude is and the midline is . Check it: and . The graph climbs 3 over the midline and drops 3 under it.
So amplitude is the distance from the midline to a maximum. It is not the distance from a minimum to a maximum; that is twice the amplitude. Amplitude is a distance, so it is never negative.
For and the maximum is 1 and the minimum is . That makes the amplitude 1 and the midline , the horizontal axis.
Quick check · Match
No calculator. Each sinusoidal function is described by its maximum and minimum values. Tap a function, then its amplitude and midline.
2c. Period and frequency
A sinusoidal graph repeats itself. The period is the horizontal length of one full cycle. Read it from a maximum to the next maximum, or from a minimum to the next minimum. In the diagram the maxima sit at and , so the period is .
A maximum to the next minimum is only half a cycle. In the diagram that runs from to , which is 6, half of 12.
For and the period is . One full turn around the unit circle brings the point back to where it started, so the outputs start over.
The frequency is the reciprocal of the period:
It tells you what fraction of a cycle the graph completes per unit of input. The diagram's function has period 12, so its frequency is . Sine and cosine have frequency . A shorter period means a higher frequency, and the period times the frequency is always 1.
Quick check · Calculate
No calculator. The graph of a sinusoidal function k has a maximum at , then its next minimum at , then its next maximum at . What is the period of k?
2d. Rising, falling and bending through one period
Follow through one period, from to . It starts on the midline, rises to its maximum at , falls back through the midline at to its minimum at , and climbs back to the midline at . So it is increasing on and , and decreasing on .
Watch how it bends, too. Around a maximum the graph is concave down, curving like an upside-down bowl. Around a minimum it is concave up. As the input increases, every sinusoidal graph switches back and forth between concave down and concave up.
The switch happens on the midline. The graph is concave down wherever it is higher than its midline and concave up wherever it is lower, so each midline crossing is a point of inflection. For those are at , and . In the diagram they are at , and , each halfway between a maximum and the neighboring minimum.
Increasing and concavity are separate questions. Between and , sine is decreasing and concave down; between and it is still decreasing, but concave up.
Quick check · Sort it
No calculator. Each card names a function and an open interval of in radians. Tap a card, then how the graph behaves on that whole interval.
Increasing, concave down
Decreasing, concave down
Decreasing, concave up
Increasing, concave up
Part 3 Watch it done
Four features from two points
Watch each step, then do the last one yourself.
A sinusoidal function w has a maximum value of 7 at , and its next minimum value is , at . Find the amplitude, the midline, the period, and the first input after where the graph of w has a point of inflection.
Step 1 · Amplitude
Half the difference between the maximum and the minimum:
Step 2 · Midline
The average of the maximum and the minimum: Check: and .
Step 3 · Period
From the maximum at to the next minimum at is half a cycle, 3 units. A full cycle is twice that, so the period is 6, and the next maximum is at .
Why this step?
Why double the 3 instead of using it as the period?
A period runs from a maximum back to the next maximum. At the graph is at its lowest, not back where it started; it takes 3 more units to climb back to 7 at .
Your step · Calculate
No calculator. Finish it. A sinusoidal function w has a maximum value of 7 at and its next minimum value of at . At what input t, the first one after , does the graph of w have a point of inflection?
Part 4 Try it
Read the features off the grapher
Try it · Calculate
No calculator. In the function grapher, the sinusoidal family with , , and draws a sinusoidal function g with a maximum value of 1.5 and a minimum value of . Every point of inflection of the graph of g lies on the horizontal line . What is k?
Part 5 Explain it
Write it the way the exam asks
Nothing you type leaves this page. Check your answer against the model and each scoring point.
Free response is 37.5% of the exam score. This one is shaped like Question 3, Modeling a Periodic Context.
Free-response practice · Question 3 style
No calculator. A seat on a Ferris wheel is at its highest point, 34 meters above the ground, at time minutes. The wheel turns at a constant speed, and the seat's height , in meters, is a sinusoidal function of . The seat first reaches its lowest point, 4 meters above the ground, at minutes. (A) Find the amplitude of h and an equation of the midline of the graph of h. Interpret the midline in context. (B) Find the period of h and the frequency of h. (C) On the interval , is h increasing or decreasing? Is the rate of change of h increasing or decreasing on that interval? Give a reason for your answers.
Model answer
(A) The amplitude is meters, and the midline is . The seat's height swings around 19 meters, halfway between its highest point and its lowest point. (B) Highest to lowest is half a turn, 3 minutes, so the period is 6 minutes, and the frequency is of a cycle per minute. (C) h is decreasing, because the seat is moving from its maximum at toward its minimum at . On the graph is higher than its midline, so it is concave down, and the rate of change of h is decreasing.
Score your own answer. This is a self-check, not a grade. Tick each point your answer makes.
Part 6 Check yourself
A table and a graph
The three case questions use the same function p.
The function p is sinusoidal. The table gives p at the whole numbers from 0 to 8, and the chart plots more points on its graph. The maximum value of p occurs at and next at , and the minimum value between them occurs at .
Points on the graph of
Each dot is , at every half unit from 0 to 8, rounded to two decimal places.
Case question 1 · Multiple choice
No calculator. What are the amplitude of p and the midline of the graph of p?
Case question 2 · Calculate
No calculator. What is the frequency of p? Give a decimal.
Case question 3 · Decide and justify
No calculator. Is the graph of p concave up or concave down on the interval ?
Which reason supports your answer?
The rest stand on their own and do not use the case.
Check yourself · Spot the error
No calculator. A sinusoidal function q has a maximum value of 10 and a minimum value of 2. A student describes its graph. Tap the first line with a mistake.
Check yourself · Fill the statement
No calculator. Tap a blank, then tap a word.
The graph of has symmetry about the origin, so the sine function is . The graph of has symmetry over the -axis, so the cosine function is .
Part 7 Keep it
Bring back earlier ideas
Pulling an older idea back up is what makes it last.
From 1.12 Transformations of Functions · Match
No calculator. Tap a function, then how its graph compares with the graph of .
From 2.10 Inverses of Exponential Functions · Sort it
No calculator. Each card lists four inputs and their outputs. Tap a card, then the pattern it shows.
Exponential pattern
Logarithmic pattern
Neither
In three lines
- A sinusoidal function is any transformation of ; cosine is one, since . Sine is odd and cosine is even.
- Amplitude is half of maximum minus minimum, the midline is = their average, the period is one full cycle, and frequency is .
- The graph is concave down higher than its midline and concave up lower than it, so its points of inflection sit on the midline.
Unit 3 check: 10 questions from the 5 lessons written so far in Unit 3
Vocabulary
- Sinusoidal function
- Any function made from by additive and multiplicative transformations; and are both sinusoidal.
- Amplitude
- Half the difference between the maximum and minimum values of a sinusoidal function, which is 1 for and .
- Midline
- The horizontal line through the average of the maximum and minimum values, which is for and .
- Period
- The horizontal length of one full cycle, which is for and .
- Frequency
- The reciprocal of the period, which is for and .
- Odd function
- A function whose graph has rotational symmetry about the origin, such as .
- Even function
- A function whose graph has reflective symmetry over the -axis, such as .
Course alignment, for teachers
AP Precalculus topic 3.5, Unit 3: Trigonometric and Polar Functions.
- Skill 2.A: Identify information from graphical, numerical, analytical, and verbal representations to answer a question or construct a model, with and without technology.
- Skill 3.A: Describe the characteristics of a function with varying levels of precision, depending on the function representation and available mathematical tools.
This lesson maps all 6 essential knowledge statements of the topic to the part that teaches each one: 6 are checked by a scored question. The map is in the lesson file.