Unit 5 · Topic 5.3 · about 30 minutes · 7 parts · 13 scored checks, 1 of them multiple choice, plus 2 from earlier lessons
AP Chemistry 5.3: Concentration Changes Over Time
Unit 5: 7 to 9% of the multiple-choice section
What you'll be able to do
- Identify a reaction's rate law from data on how a concentration changes over time, using straight-line plots, the rate constant and the half-life.
Key vocabulary
| Term | What it means | The exam trap |
|---|---|---|
| Integrated rate law | An equation that gives the concentration of a reactant at time t from its starting concentration and the rate constant, for one order of reaction. | Each order has its own form, so check which law your data call for before you substitute numbers. |
| Half-life | The time it takes for the concentration of a reactant to fall to half its value. | Whether this time stays the same through a reaction depends on its order, so check before you assume it. |
| Radioactive decay | The spontaneous change of unstable nuclei, whose rate for a sample follows first-order kinetics. | A sample's size and its half-life are different things, so keep the two apart. |
| Natural logarithm (ln) | The logarithm to the base e, used in the first-order integrated rate law. | A calculator has two log keys, so use the one that matches the equation. |
 Tap to open the picture full size
Part 1 Think first Caffeine in the blood
Commit to a guess first. Being wrong now makes the right idea stick better.
Predict first
A student drinks a coffee at 8 a.m. that leaves 100. mg of caffeine in her blood. Suppose that every 5 hours her body clears half of the caffeine that is in her blood at that moment (the real rate varies from person to person). How much caffeine is left at 6 p.m., ten hours later?
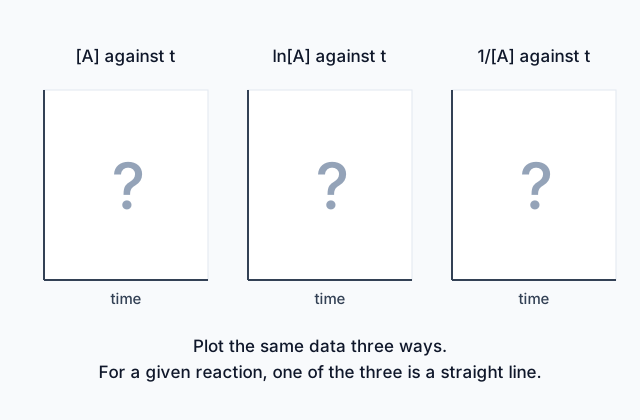
In short. How a reactant's concentration changes over time shows the reaction's order: [A] against time is a straight line for zeroth order, ln[A] for first order and 1/[A] for second order.
- The slope of the straight-line plot gives k: −k for zeroth and first order, and +k for second order.
- A first-order reaction has a constant half-life, t½ = 0.693/k, so each half-life halves the concentration.
- Radioactive decay is the best-known example of first-order kinetics.
Part 2 Learn it Reading concentration against time
2a. The shape of [A] against time
When you follow a reactant, the data are concentrations at a series of times. The shape of the graph of [A] against time shows the order of the reaction in A.
- Zeroth order. The rate does not depend on [A], so [A] falls by the same amount in every equal interval. The graph is a straight line sloping down.
- First or second order. The rate depends on [A], and it falls as [A] falls, so [A] drops by less and less in each equal interval. The graph is a curve that flattens out.
To tell a first-order curve from a second-order curve, watch how long [A] takes to halve. In a first-order reaction every halving takes the same time. In a second-order reaction each halving takes longer than the one before.
A zeroth-order reaction
The concentration drops by 0.200 M in every 100 s, so the graph is a straight line.
A first-order reaction
The concentration halves every 100 s, so each drop is smaller than the one before and the graph flattens out.
Quick check · Decide and justify
A student plots [A] against time and reads these points from the graph: 0.900 M at 0 s, 0.700 M at 100 s, 0.500 M at 200 s and 0.300 M at 300 s. Is the reaction zeroth order in A?
Which reason supports your decision?
2b. Straightening the curve with ln[A] and 1/[A]
Each order has an integrated rate law, which links the concentration at time t to the starting concentration and k:
- Zeroth order: [A]ₜ − [A]₀ = −kt
- First order: ln[A]ₜ − ln[A]₀ = −kt
- Second order: 1/[A]ₜ − 1/[A]₀ = kt
Each has the form of a straight line, y = mx + b, with time as x. So a graph of the right quantity against time is a straight line, and the slope is k or −k:
| Order | Straight-line plot | Slope |
|---|---|---|
| Zeroth | [A] against time | −k |
| First | ln[A] against time | −k |
| Second | 1/[A] against time | k |
To find an order from data, work out ln[A] and 1/[A] for every time and see which of the three plots gives equal steps. Only the plot that matches the true order is straight; the others curve. Here ln is the natural logarithm, not the base-10 log.
Quick check · Match
Match each observation about a graph to the order it shows and the slope.
2c. Finding k from the integrated rate law
The integrated rate laws give k directly from two concentrations at two times, with no graph. Rearrange the one for your order.
Example for a first-order reaction: [A] falls from 0.900 M to 0.300 M in 50.0 s. Then ln[A]ₜ − ln[A]₀ = ln(0.300) − ln(0.900) = −1.204 − (−0.105) = −1.099, and this equals −kt. So k = 1.099 ÷ 50.0 s = 0.0220 s⁻¹. The same value comes from the slope of an ln[A] graph, which is −k.
Three reminders:
- A rate constant is always positive. The slope of the ln[A] line is negative, and k is its opposite.
- The units of k follow from the order (Topic 5.2): s⁻¹ for first order, M⁻¹·s⁻¹ for second order and M·s⁻¹ for zeroth order.
- Use the natural log, ln, with the first-order law.
Quick check · Calculate
A reaction is first order in A. [A] falls from 0.800 M to 0.200 M in 2.00 min. What is the rate constant, in min⁻¹? Give your answer to three significant figures.
2d. Half-life and radioactive decay
The half-life, t½, is the time for [A] to fall to half its value. For a first-order reaction, put [A]ₜ = ½[A]₀ in the integrated law: ln(1/2) = −kt½, so
t½ = 0.693/k
There is no [A]₀ in this equation. The half-life of a first-order reaction is constant: it is the same whether you start with a lot of A or a little. After one half-life half of the A is left, after two a quarter, after three an eighth.
This constant half-life is special to first order. For zeroth and second order, the time to halve depends on the starting concentration. That is why half-life is a key parameter for first-order reactions.
Radioactive decay is the best-known example of first-order kinetics. The number of radioactive nuclei in a sample falls by half in each half-life, whatever the size of the sample, and each isotope has its own half-life and so its own k.
Quick check · Calculate
Technetium-99m, used in medical imaging, decays by first-order kinetics with a half-life of 6.01 hours. What fraction of a sample is left after 18.0 hours? Give your answer to three significant figures.
Part 3 Watch it done Which plot is straight?
Predict first, then watch each step, then finish the calculation yourself.
Nitrogen dioxide decomposes in a flask at a fixed temperature: 2 NO₂(g) → 2 NO(g) + O₂(g). A student measures [NO₂]: 0.0100 M at 0 s, 0.00787 M at 50. s, 0.00649 M at 100. s, 0.00552 M at 150. s and 0.00481 M at 200. s. These numbers are a teaching example. Find the order of the reaction in NO₂ and the rate constant.
Predict first
Before you open the first step, predict: which graph of these data will be a straight line?
Step 1 · Test zeroth order with [NO₂]
[NO₂] drops by 0.00213 M in the first 50. s, then by 0.00138 M, 0.00097 M and 0.00071 M. The drops shrink, so the graph is a curve, not a line. The reaction is not zeroth order.
Step 2 · Test first order with ln[NO₂]
ln[NO₂] is −4.61, −4.84, −5.04, −5.20 and −5.34. It changes by −0.24, −0.19, −0.16 and −0.14 in successive 50. s, which are not equal, so the ln graph curves. The reaction is not first order.
Step 3 · Test second order with 1/[NO₂]
1/[NO₂] is 100., 127, 154, 181 and 208 M⁻¹. It rises by 27 M⁻¹ in every 50. s, so the graph is a straight line. The reaction is second order in NO₂.
Why this step?
Why does a steady rise in 1/[NO₂] show second order?
For a second-order reaction 1/[A]ₜ − 1/[A]₀ = kt, so 1/[A] increases by the same amount in every equal time: it is a straight line against time. Only the plot that matches the true order is straight.
Your step · Calculate
Finish it. The slope of the 1/[NO₂] line is k. Use its first and last points, (0 s, 100. M⁻¹) and (200. s, 208 M⁻¹), to find k, in M⁻¹·s⁻¹. Give your answer to three significant figures.
M⁻¹·s⁻¹
The slope is positive because 1/[A] grows as A is used up. The test the lesson used, check which plot gives equal steps, works for any data set, and then the slope or the integrated rate law gives k.
Part 4 Try it Dating a wooden bowl
Carbon-14 is a radioactive isotope found in all living things, and it decays by first-order kinetics with a half-life of 5730 years. After an organism dies, the amount of carbon-14 in it falls and is not replaced. A wooden bowl from an ancient site has 30.0% of the carbon-14 that a living tree has, so [A]ₜ/[A]₀ = 0.300. These numbers are a teaching example.
Try it · Calculate
What is the rate constant for the decay of carbon-14, in y⁻¹? Give your answer to three significant figures, typed in e-notation (1.21 × 10⁻⁴ is typed 1.21e-4).
Try it · Calculate
Use k = 1.21 × 10⁻⁴ y⁻¹. How old is the bowl, in years? Give your answer to three significant figures.
Part 5 Explain it Ammonia on a hot surface
On the exam this is handwritten, so answer on paper first. Nothing you type here leaves this page. Then check your answer against the model and each scoring point.
Free response is 50% of the exam score. This one is shaped like a short-answer question, which is worth 4 points.
Free-response practice · Short-answer style
Ammonia decomposes on a hot tungsten surface: 2 NH₃(g) → N₂(g) + 3 H₂(g). A student measures [NH₃] in a flask at a fixed temperature: 0.800 M at 0 s, 0.680 M at 60.0 s, 0.560 M at 120. s, 0.440 M at 180. s and 0.320 M at 240. s. These numbers are a teaching example.
(a) Identify the order of the reaction in NH₃, and justify your answer using the data.
(b) Calculate the rate constant, with its units.
(c) Predict [NH₃] at 300. s, assuming the same behavior continues.
(d) A classmate plots ln[NH₃] against time. Explain whether that graph is a straight line.
Model answer
(a) The reaction is zeroth order. [NH₃] drops by the same amount, 0.120 M, in every 60.0 s, so the graph of [NH₃] against time is a straight line.
(b) For zeroth order [A]ₜ − [A]₀ = −kt, so k = 0.120 M ÷ 60.0 s = 2.00 × 10⁻³ M/s, which is M·s⁻¹ (the slope of the line is −k).
(c) [NH₃] = 0.800 M − (2.00 × 10⁻³ M/s)(300. s) = 0.200 M.
(d) No. A straight line of ln[A] against time means first order. Here [NH₃] falls by equal amounts, so as it gets smaller the same drop is a larger change in its logarithm, and the ln graph bends downward.
Score your own answer. This is a self-check, not a grade. Tick each point your answer makes.
Part 6 Check yourself A decay measured every two minutes
All three case questions use the table and the graph.
A student follows the decomposition of a compound A at a fixed temperature and records its concentration every 2.00 minutes. These numbers are a teaching example.
| Time (min) | [A] (M) |
|---|---|
| 0 | 0.800 |
| 2.00 | 0.400 |
| 4.00 | 0.200 |
| 6.00 | 0.100 |
| 8.00 | 0.0500 |
Concentration of A against time
The same data as the table.
Case question 1 · Decide and justify
Using the table and graph: what is the order of the reaction in A?
Which reason supports your decision?
Case question 2 · Calculate
Using the table: what is the rate constant, in min⁻¹? Give your answer to three significant figures.
Case question 3 · Calculate
Using the table: at what time does [A] reach 0.0250 M, in minutes? Give your answer to three significant figures.
The rest stand on their own and do not use the case.
Check yourself · Multiple choice
A student plots ln[A] against time for a reaction and gets a straight line with a slope of −0.250 s⁻¹. Which statement is correct?
Check yourself · Spot the error
A reaction is second order in A. A student finds k when [A] falls from 0.500 M to 0.250 M in 100. s. Tap the line with the mistake.
Check yourself · Sketch the graph
A first-order reaction has [A]₀ = 0.640 M and a half-life of 30 s. Sketch [A] against time at 0, 30, 60, 90 and 120 s. The first point is placed for you; drag the others so the graph falls the way the concentration does, and bends the same way along its whole length.
One shape that fits
Drag a point up or down, or tap it and use the arrow keys. Only the shape is checked.
Part 7 Keep it Bring back earlier ideas
This lesson builds on rate laws and orders from the last topic and on the idea of a rate from the first. Pulling them back up is what makes them last.
From 5.2 Introduction to Rate Law · Calculate
A reaction has the rate law rate = k[A][B]². At a constant temperature, [A] is doubled and [B] is halved. By what factor does the rate change? Give your answer to three significant figures.
From 5.1 Reaction Rates · Calculate
The concentration of a reactant falls from 0.800 M to 0.560 M in 40.0 s. What is the average rate at which the reactant is used? Give your answer in units of 10⁻³ M/s, to three significant figures.
In three lines
- The order shows in the data: [A] against time is a straight line for zeroth order, ln[A] for first order and 1/[A] for second order, with slope −k, −k and +k.
- k comes from the slope of the straight-line plot or from the integrated rate law, and a rate constant is always positive.
- A first-order reaction has a constant half-life, t½ = 0.693/k, and radioactive decay is the standard example of first-order kinetics.
Exam strategy for this topic
- Section I, Multiple Choice: 60 questions in 90 minutes.
- Section II, Free Response: 7 questions in 105 minutes.
- A scientific or graphing calculator is recommended for use on both sections of the exam.
When data of concentration against time are given, say which plot you tested and what you saw: equal drops for zeroth order, a constant half-life or a straight ln[A] line for first order, a straight 1/[A] line for second order. Quote the integrated rate law you use, give k as a positive number with units that match the order, and keep the significant figures the data allow.
Questions students ask
How do you tell the order of a reaction from a graph of concentration against time?
A straight line of [A] against time means zeroth order. A curve is first or second order: a constant half-life, a straight ln[A] line, means first order, and a straight 1/[A] line means second order.
What are the integrated rate laws?
Zeroth order: [A]ₜ − [A]₀ = −kt. First order: ln[A]ₜ − ln[A]₀ = −kt. Second order: 1/[A]ₜ − 1/[A]₀ = kt.
What is the slope of each straight-line plot?
The slope is −k for [A] against time (zeroth order) and for ln[A] against time (first order), and +k for 1/[A] against time (second order).
What is the half-life of a first-order reaction?
It is constant and equal to 0.693/k, so it does not depend on the starting concentration.
Why is radioactive decay first order?
The chance that a given nucleus decays in a given time does not depend on how many other nuclei are present, so the rate is proportional to the number of nuclei, and the half-life is constant.
Course alignment, for teachers
AP Chemistry topic 5.3, Unit 5: Kinetics.
- Skill 5.B: Identify an appropriate theory, definition, or mathematical relationship to solve a problem.
This lesson maps all 6 essential knowledge statements of the topic to the part that teaches each one: 6 are checked by a scored question. The map is in the lesson file.