Unit 6 · Topic 6.2 · about 30 minutes · 7 parts · 11 scored checks, 1 of them multiple choice, plus 2 from earlier lessons
AP Chemistry 6.2: Energy Diagrams
Unit 6: 7 to 9% of the multiple-choice section
What you'll be able to do
- Represent a chemical or physical transformation with an energy diagram that shows whether the process is endothermic or exothermic.
Key vocabulary
| Term | What it means | The exam trap |
|---|---|---|
| Energy diagram | A graph of one process with energy on the vertical axis and the progress of the process on the horizontal axis, showing a level for the reactants and a level for the products. | The horizontal axis is not a clock or a ruler, so do not read any number or length off it. |
| Level | A horizontal line on an energy diagram at the height that stands for the energy of the reactants or of the products. | A level is one energy, not a change, so a question about a change is asking for something you find from two of them. |
| ΔH | The enthalpy change of a process, read in this topic as the change in the energy of the system: the energy of the products minus the energy of the reactants, shown by the arrow between the two levels. | Subtract in the order the definition gives, and keep the sign, because the sign carries the direction of the energy. |
| Exothermic process | A process in which the energy of the system decreases, so energy goes out to the surroundings. | Judge it from the two levels of the same process, not from how high or low a level sits on the scale. |
| Endothermic process | A process in which the energy of the system increases, so energy comes in from the surroundings. | The sign of ΔH and the way the arrow points go together, so check that your picture and your number agree. |
 Tap to open the picture full size
Part 1 Think first Drawing a gas flame
Commit to a guess first. Being wrong now makes the right idea stick better.
Predict first
A chemist draws two horizontal lines to describe a gas stove, with higher on the page meaning more energy. One line stands for the energy of the methane and oxygen before they burn. The other stands for the energy of the carbon dioxide and water that form. The flame gives off heat that warms the pot. Which line should she draw higher?
In short. An energy diagram shows a process as a level for the reactants and a level for the products, and the difference between the levels is the energy change of the system, ΔH.
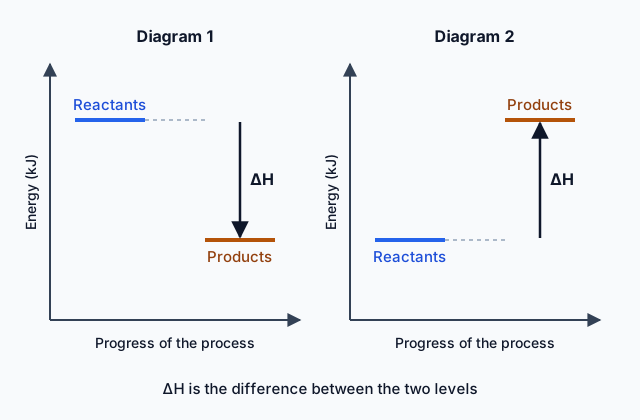
- Products below the reactants means the system lost energy: the process is exothermic and ΔH is negative.
- Products above the reactants means the system gained energy: the process is endothermic and ΔH is positive.
- The vertical axis is energy with a unit such as kJ, the horizontal axis is the progress of the process with no numbers, and the arrow between the levels is ΔH.
Part 2 Learn it Energy diagrams
2a. The parts of an energy diagram
An energy diagram is a graph of one process in which height means energy.
- The vertical axis is energy, in a unit such as kJ. Higher on the page means more energy.
- The horizontal axis is the progress of the process, from the starting substances on the left to the final substances on the right. It has no numbers. It is not a time scale.
- Each end has a short horizontal line, a level: the energy of the reactants on the left and of the products on the right. For a physical process, such as melting, they are the substance before and after.
- An arrow between the two levels shows the energy change of the system, written ΔH. Its full name is the enthalpy change; for the processes in this topic, read it as the change in the energy of the system. Topic 6.6 says exactly what it measures.
ΔH = (energy of the products) − (energy of the reactants)
Only the gap between the levels means anything. Where the scale puts the reactants is a choice, and the products go the right distance above or below them. A diagram may also show a hump between the two levels, as in Topic 5.6; ΔH is still only the gap between the two end levels.
Example: reactants at 200 kJ and products at 150 kJ give ΔH = 150 − 200 = −50 kJ.
Quick check · Calculate
On the energy diagram for a teaching-example reaction, the level of the reactants is at 310 kJ and the level of the products is at 245 kJ. What is ΔH for the reaction, in kJ? Include its sign.
2b. Reading the sign from the picture
Compare the two levels, and the arrow between them tells you everything.
- Products below the reactants. The energy of the system decreases, so energy goes out to the surroundings. The arrow points down, ΔH is negative, and the process is exothermic.
- Products above the reactants. The energy of the system increases, so it takes in energy from the surroundings. The arrow points up, ΔH is positive, and the process is endothermic.
- Products at the same height. The energy of the system does not change and ΔH is zero.
The longer the arrow, the bigger the energy change. A ΔH of −200 kJ is a bigger change than −50 kJ. The sign tells you the direction and the length tells you the size.
The rule is the same for a chemical reaction, such as burning a fuel, and for a physical process, such as ice melting or boiling water. The diagram always shows the energy of the system, so the surroundings change by the same amount in the opposite direction.
Quick check · Spot the error
A diagram for steam condensing into liquid water shows the level for the liquid below the level for the steam. A student reads it. Tap the line with the mistake.
2c. Drawing one yourself
To represent a process, build the diagram in this order:
- Draw the axes. Label the vertical axis Energy with a unit, such as kJ, and the horizontal axis Progress of the process, with no numbers.
- Work out whether the process is endothermic or exothermic. That tells you whether the products go above or below the reactants.
- Draw the reactants’ level, then the products’ level on the correct side. If the numbers are given, place the products where the scale says: products = reactants + ΔH.
- Label each level with the substances and their states.
- Draw the ΔH arrow from the reactants’ level to the products’ level and write its signed value beside it.
Example: ice melting, H₂O(s) → H₂O(l), takes in energy, so it is endothermic. The liquid’s level is drawn above the solid’s, and the ΔH arrow points up with a positive value.
On the exam you draw this by hand, so label both axes and both levels, and draw the arrow the right way.
Quick check · Fill the statement
A solid dissolves in water and the water cools. Complete the description of the energy diagram a student should draw for the dissolving.
The vertical axis is labeled . The water cooled, so the system took in energy and the products’ level is drawn the reactants’ level. The ΔH arrow points .
Part 3 Watch it done From a ΔH to a drawing
Predict first, then watch each step, then finish the work yourself.
A teaching-example reaction, X(g) + Y(g) → Z(g), has ΔH = −120 kJ. On the energy scale you choose, the reactants are at 200 kJ. Represent the reaction with an energy diagram.
Predict first
Before you open the first step, predict: on the diagram, will the arrow for this reaction point up or down, and will it be a long arrow or a short one compared with an arrow for ΔH = −20 kJ?
Step 1 · Read the sign of ΔH
ΔH is negative, so the energy of the system decreases. The reaction is exothermic, the products go below the reactants, and the arrow points down.
Step 2 · Find the products’ level
ΔH = (products) − (reactants), so products = reactants + ΔH = 200 + (−120) = 80 kJ. The products’ level is 80 kJ.
Why this step?
Why do you add ΔH to the reactants’ level, and not subtract it?
ΔH is defined as the products’ level minus the reactants’ level. Rearranged, the products’ level is the reactants’ level plus ΔH, and a negative ΔH moves it down.
Step 3 · Draw and label
Label the vertical axis Energy (kJ) and the horizontal axis Progress of the reaction. Draw the reactants, X(g) + Y(g), at 200 kJ on the left and the product, Z(g), at 80 kJ on the right. Draw an arrow down between them and write ΔH = −120 kJ beside it. The surroundings gain 120 kJ.
Your step · Calculate
Finish it. In a second teaching example, W → V has ΔH = +65.0 kJ, and the reactant W is drawn at the 150 kJ level. At what level, in kJ, is the product V drawn?
kJ
Only the gap of 120 kJ between the two levels means anything. Had the scale put the reactants at 300 kJ, the products would be at 180 kJ and the diagram would show the same reaction.
Part 4 Try it Reading levels
Now read diagrams you have not seen. Every number here is a teaching example. For each one, find the gap between the levels, its sign and its size.
Try it · Sort it
Each card describes an energy diagram. Tap a card, then the bin for the kind of process it shows.
Exothermic
Endothermic
Try it · Rank it
Four teaching-example processes, P to S, have these levels on their energy diagrams, in kJ: P, reactants 300 and products 180; Q, reactants 200 and products 260; R, reactants 150 and products 130; S, reactants 90 and products 200. Rank the processes by ΔH, from the most negative to the most positive.
Most negative ΔH first
Give each one a place, 1 for first. Give two the same place if they are equal.
Your ranking: none yet
Part 5 Explain it Represent an endothermic reaction
On the exam this is handwritten, so answer on paper first, and draw on paper too. Nothing you type here leaves this page. Then check your answer against the model and each scoring point.
Free response is 50% of the exam score. This one is shaped like a short-answer question, which is worth 4 points.
Free-response practice · Short-answer style
A teaching-example reaction, P(g) + Q(g) → R(g), is endothermic with ΔH = +85 kJ. On an energy scale, the reactants are at 120 kJ.
(a) Represent the reaction with an energy diagram. Do this on paper: label both axes, draw the two levels to scale, and draw the ΔH arrow with its sign.
(b) Calculate the level of the products, in kJ.
(c) Identify the direction in which energy is transferred between the reacting species and the surroundings.
(d) Predict whether a thermometer in a water bath around the reaction would rise or fall, and justify your prediction from the diagram.
Model answer
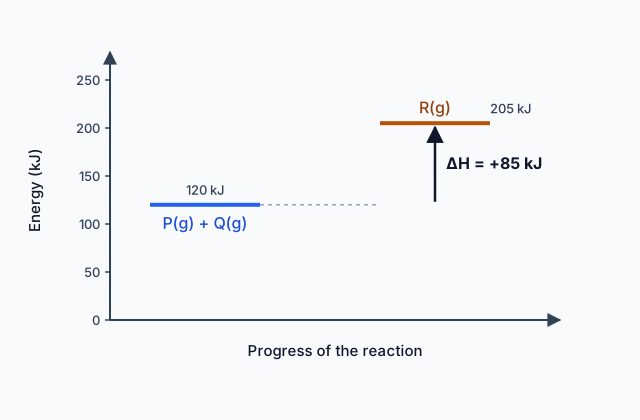
(a) The figure below shows one way. The vertical axis is Energy (kJ) and the horizontal axis is Progress of the reaction, with no numbers. The reactants, P(g) + Q(g), are a level at 120 kJ on the left, and the product, R(g), is a higher level at 205 kJ on the right, with an arrow pointing up between them labeled ΔH = +85 kJ.
(b) Products = reactants + ΔH = 120 + 85 = 205 kJ.
(c) Energy is transferred from the surroundings to the reacting species, because the products’ level is above the reactants’ level.
(d) The thermometer would fall. The energy of the system increases by 85 kJ, and that energy comes from the water bath, so the water loses energy and its temperature drops.
 Tap to open the picture full size
Score your own answer. This is a self-check, not a grade. Tick each point your answer makes.
Part 6 Check yourself Four processes on one scale
All three case questions use the table.
A student reads the energy diagrams of four processes, W to Z, drawn on the same scale, and records the level of the reactants and of the products on the vertical axis. These numbers are a teaching example.
| Process | Reactants’ level (kJ) | Products’ level (kJ) |
|---|---|---|
| W | 410 | 285 |
| X | 160 | 235 |
| Y | 330 | 190 |
| Z | 95 | 140 |
Case question 1 · Select all
Using the table: select the two processes whose diagrams show the products’ level above the reactants’ level.
Select 2 answers, then check.
Case question 2 · Decide and justify
Using the table: process W is carried out in a foam cup of water, and the water is the surroundings. Will a thermometer in the water rise or fall?
Which reason supports your decision?
Case question 3 · Multiple choice
Using the table: which process gives out the most energy to its surroundings?
The rest stand on their own and do not use the case.
Check yourself · Match
Match each part of an energy diagram to what it shows.
Check yourself · Spot the error
A student draws the energy diagram for calcium chloride dissolving in water so that the water warms, and describes the drawing. Tap the line with the mistake.
Part 7 Keep it Bring back earlier ideas
This lesson leans on two earlier ideas: which way energy goes in an exothermic or endothermic process, and how a graph of energy shows a low point and a rise. Pulling them back up is what makes them last.
From 6.1 Endothermic and Exothermic Processes · Sort it
Each card names a change. Tap a card, then the bin that says whether the process is exothermic or endothermic for the substance or reacting species named.
Exothermic
Endothermic
From 2.2 Intramolecular Force and Potential Energy · Spot the error
A student describes the potential energy of two atoms as they approach each other from far apart. Tap the line with the mistake.
In three lines
- An energy diagram plots the energy of the reactants and the products as two levels, with energy in a unit such as kJ on the vertical axis and the progress of the process, with no numbers, on the horizontal axis.
- ΔH is the products’ level minus the reactants’ level: products below means a negative ΔH and an exothermic process; products above means a positive ΔH and an endothermic process.
- The arrow between the levels shows the sign and the size of the energy change of the system; the surroundings change by the same amount in the opposite direction.
Exam strategy for this topic
- Section I, Multiple Choice: 60 questions in 90 minutes.
- Section II, Free Response: 7 questions in 105 minutes.
- A scientific or graphing calculator is recommended for use on both sections of the exam.
When you draw an energy diagram, label the vertical axis Energy with a unit, put the reactants on the left and the products on the right, decide from the sign of ΔH whether the products go above or below, and draw the arrow with its sign. Check that the picture and the sign agree before you move on.
Questions students ask
What does an energy diagram show?
It shows the energy of the reactants and the energy of the products as two levels, so the gap between them is the energy change of the process.
How can you tell from an energy diagram whether a process is exothermic or endothermic?
Compare the levels. Products below the reactants is exothermic, with a negative ΔH. Products above the reactants is endothermic, with a positive ΔH.
How do you find ΔH from an energy diagram?
Subtract the energy of the reactants from the energy of the products. Keep the sign: a drop gives a negative ΔH and a rise gives a positive one.
What does the horizontal axis of an energy diagram show?
The progress of the process, from the reactants on the left to the products on the right. It has no numbers and it is not a time scale.
Can a physical change, such as melting, have an energy diagram?
Yes. A physical or a chemical process can be drawn this way. Melting is endothermic, so the liquid’s level is above the solid’s.
Course alignment, for teachers
AP Chemistry topic 6.2, Unit 6: Thermochemistry.
- Skill 3.A: Represent chemical phenomena using appropriate graphing techniques, including correct scale and units.
This lesson maps the one essential knowledge statement of the topic to the part that teaches each one: 1 is checked by a scored question. The map is in the lesson file.