Unit 1 · Topic 1.2 · about 30 minutes · 7 parts · 12 scored checks, 3 of them multiple choice, plus 2 from earlier lessons
AP Human Geography 1.2: Geographic Data
Unit 1: 8 to 10% of the multiple-choice section
What you'll be able to do
- Identify the different ways geographic data is gathered: field data collected by organizations or by individuals, the geospatial technologies, and the kinds of written accounts that hold spatial information.
Key vocabulary
| Term | What it means | The exam trap |
|---|---|---|
| Field data | Information gathered firsthand, in the place being studied, by an organization or by an individual. | Field data can be numbers, notes, photos or recordings; the form does not decide it. |
| Geospatial technologies | Tools that gather, store, analyze or show data tied to locations on Earth. | Four are named in the course, and each does a different job, so name the specific one. |
| Geographic information system (GIS) | A computer system that stores spatial data in layers and lets a user combine and analyze them. | Layers have to line up by location before they can be compared. |
| Satellite navigation system | A system that uses signals from satellites to find the latitude and longitude of a receiver on the ground. | GPS is one example, not the only system. |
| Remote sensing | Gathering information about Earth's surface from a distance, without contact with it. | Clouds, darkness and coarse detail can hide what is on the ground. |
| Online mapping and visualization | Maps and data shown on websites and apps that people can open, search and explore. | Anyone can view it, so check who made the data behind it. |
| Written accounts | Spatial information recorded in words, such as notes, news stories, travel accounts, official documents and interviews. | Every written account has an author with a point of view, so ask who wrote it and why. |
| Field observations | Notes an observer writes on site about what is there and what is happening. | They record what one observer saw at one time and place. |
| Media reports | News stories in print, on air or online about events in places. | Reporters choose which places and events to cover. |
| Travel narratives | Accounts written by travelers about the places they passed through. | They show a place through an outsider's eyes, at the time of the journey. |
| Policy documents | Official writing, such as laws, plans and rules, from governments or other organizations. | They give the official view, which may not match conditions on the ground. |
| Personal interviews | People's own descriptions of their lives, choices and places, recorded in words. | The interviewer's questions shape what people talk about. |
| Landscape analysis | Reading the visible landscape, such as buildings, fields, roads and land uses, and writing what it reveals about the people who shaped it. | It reads what people built and changed, not only the natural setting. |
| Photographic interpretation | Studying photographs and writing what their patterns show. | A photo shows one moment, so a reading of it describes that moment. |
 Tap to open the picture full size
Part 1 Think first Map a flood by tomorrow
Commit to a guess first. Being wrong now makes the right idea stick better.
Predict first
Heavy rain floods a hypothetical river valley of about 400 square kilometers. By tomorrow, county officials need to know which streets were under water, all across the valley. Which source would you try first?
In short. Geographic data is gathered in three broad ways: in the field by organizations or individuals, with geospatial technologies, and from written accounts of places.
- Field data is collected firsthand in the place being studied, by an organization such as a census office or by an individual such as a researcher or a student.
- The geospatial technologies are geographic information systems (GIS), satellite navigation systems, remote sensing, and online mapping and visualization; each does a different job.
- Written accounts give spatial information in words: field observations, media reports, travel narratives, policy documents, personal interviews, landscape analysis and photographic interpretation.
Part 2 Learn it Three ways to gather geographic data
2a. Field data
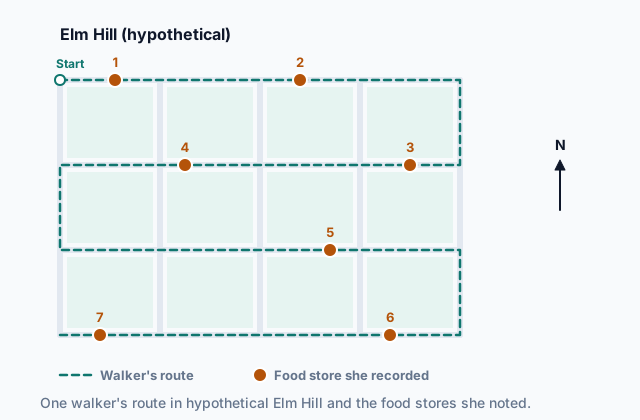
Field data is information gathered firsthand, in the place being studied. A geographer in the field counts, measures, maps, photographs and asks questions on site, instead of relying on what someone else recorded.
Field data may be gathered by organizations or by individuals. Organizations include government offices, such as a census office that sends workers to every household, along with universities, aid groups and businesses. A hypothetical water agency might send teams to test every well in a district. Individuals gather field data too: a researcher measuring a beach's width every month, a student counting the people who pass a bus stop in an hour, or a resident noting where trash piles up on her own street.
Who gathers it shapes what you can do with it. An organization can send trained workers across a whole country with the same questions everywhere, so places can be compared. One person can go deep in a single place and notice what a standard form would miss. The test for field data is the same either way: someone went to the place and collected the information there.
Quick check · Sort it
Each card describes how some geographic information was gathered. Tap a card, then the bin it belongs in.
Field data, gathered by an organization
Field data, gathered by an individual
Not gathered in the field
2b. Geospatial technologies
Geospatial technologies gather, store, analyze or show data tied to places on Earth. Four are named in the course:
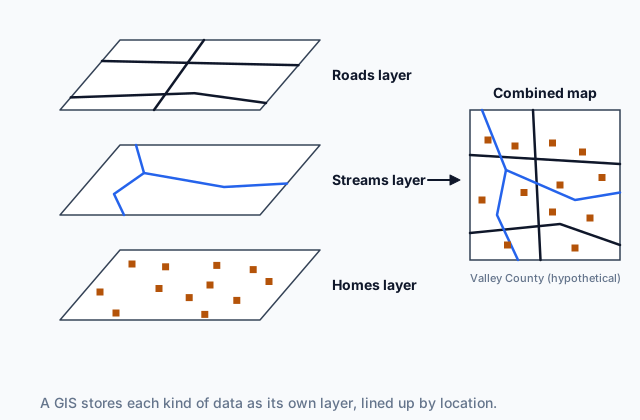
- A geographic information system (GIS) is a computer system that stores spatial data in layers, such as roads in one layer, streams in another and homes in a third, lined up by location. A user can combine the layers and measure between them, for example finding which homes sit near a stream.
- A satellite navigation system, such as GPS, uses signals from satellites to work out the latitude and longitude of a receiver on the ground, like the one in a phone.
- Remote sensing gathers information about Earth's surface from a distance, without touching it, with cameras and other sensors carried on satellites, airplanes or drones.
- Online mapping and visualization puts maps and data on websites and apps that anyone can open, zoom, search and click.
 Tap to open the picture full size
Two mix-ups are common. A satellite navigation system reports where a receiver is; remote sensing records what the surface looks like. And a GIS does not collect data by itself: it holds and analyzes data gathered in other ways, in the field, by satellite navigation, by remote sensing or from written sources.
Quick check · Match
Match each geospatial technology to the task it does.
2c. Written accounts
Not all spatial information comes as numbers or images. Much of it comes from written accounts, descriptions in words of places and what happens in them. Five kinds come from people telling or recording what they know:
- Field observations: notes an observer writes on site about what is there and what people are doing.
- Media reports: news stories in print, on air or online about events in places.
- Travel narratives: accounts by travelers of the places they passed through, sometimes written long ago.
- Policy documents: official writing, such as laws, plans and rules, from governments and other organizations.
- Personal interviews: people's own descriptions of their lives, choices and places, recorded in words.
Each kind answers different questions. An official land-use plan in hypothetical Country J sets out where the government will let towns grow; an interview with a family there explains why they moved; a traveler's account from a century ago describes a place before anyone measured it. Each also has a point of view. A reporter chooses which events to cover, a traveler notices what looks strange to an outsider, and an official plan shows what was intended, which is not always what happened.
Quick check · Multiple choice
A geographer wants to know where hypothetical Country K's government will allow new factories to be built over the next ten years. Which written source would give that spatial information most directly?
2d. Reading a landscape or a photograph
Two more kinds of written account come from reading a place itself.
Landscape analysis is studying what can be seen in a landscape, its buildings, fields, roads, signs and land uses, and writing what it reveals about the people who shaped it. In a hypothetical river town, narrow lots facing the water, an old mill by the bank and newer houses up the hill can tell a careful reader how the town grew and when.
Photographic interpretation is studying photographs, taken from the ground or from the air, and writing what their patterns show: a street grid laid out all at once, or small fields that became large ones between an older photo and a newer one.
Keep the photograph and the reading of it apart. A photo taken from an airplane or a satellite was gathered by remote sensing, a geospatial technology. A geographer's written description of what that photo shows is photographic interpretation, a written account. One picture can feed both, and a question may ask about either.
Quick check · Fill the statement
Complete the description of how one region was studied.
A camera on an airplane photographs a hypothetical farming region from high above; gathering that photo is . A geographer studies the photo and writes that the fields are long, narrow strips running back from a river; her written reading is . Later she walks the region and writes what its barns, fences and churches suggest about the people who settled it; that is .
Part 3 Watch it done Close the trails near the nests
Watch each step, then do the last one yourself.
The parks department of hypothetical Pine County wants to close, each spring, every trail that passes within 200 meters of the nesting grounds of a protected marsh bird. Plan how the department gathers and handles the data, naming the method at each step.
Predict first
Before the steps, how do you expect the department to find where the birds nest?
Step 1 · Map the trails
Staff walk each trail carrying a satellite navigation receiver, which records their latitude and longitude every few seconds. The points join into a line for each trail. The staff work for the county and collect the data on the trails themselves, so this is field data gathered by an organization, located with a satellite navigation system.
Step 2 · Find the nesting grounds
The bird nests only in tall marsh grass, which looks different from open water and fields in images taken from above. The department buys images of the marsh taken from an airplane. That is remote sensing: data about the surface, gathered from a distance.
Why this step?
Why use images from the air instead of sending staff to search the marsh on foot?
Images from above cover the whole marsh at once, including wet ground that is hard to reach, and people walking through the grass could disturb the nests. A few visits on foot can still check that the images were read correctly.
Your step · Decide and justify
Finish it. The department now has the trails as lines and the nesting grounds as areas. Which should it use to find every trail within 200 meters of a nesting ground?
Which reason supports your answer?
Part 4 Try it Plan a food survey of a town
Try it · Spot the error
A group of students in hypothetical Town R plans a study of where the town's people buy food. Which line of their plan is the first to go wrong?
Try it · Multiple choice
The students finish walking every street of hypothetical Town R this month and list 46 food stores. A free online map of the town, whose page says it was last updated several years ago, shows 39. Which source should they rely on for where the town's food stores are today, and why?
Part 5 Explain it Study a growing city
Nothing you type leaves this page. Check your answer against the model and each scoring point.
Free response is 50% of the exam score. This one is shaped like Question 1, from free-response II.
Free-response practice · Question 1 style
A team of geographers is studying how hypothetical City V, on a coast, has spread outward over the past fifty years and whether its newer neighborhoods sit on land that floods.
(A) Define field data.
(B) Describe one way the team could gather field data in City V's newest neighborhoods.
(C) Describe how remote sensing could show where City V has spread.
(D) Explain how a geographic information system (GIS) could help the team compare where the city spread with where floods reach.
(E) Describe how a satellite navigation system could help the team's field workers.
(F) Identify one kind of written account the team could use to learn why families moved to the city's edge, and explain what it adds that images cannot.
(G) Explain one limitation of relying only on images taken from above to study City V's growth.
Model answer
(A) Field data is information gathered firsthand, on site in the place being studied, by an organization or by an individual.
(B) Team members could walk the newest neighborhoods and record each new building and what it is used for, or survey households about when they arrived.
(C) Satellite or aerial images of City V taken in different years show the land surface from above. Comparing them shows where fields and open land became streets and roofs, so the team can see where and how fast the city spread.
(D) A GIS stores data as layers lined up by location. The team could put the city's built-up area from each year on one layer and the areas floods have reached on another, then measure how much of the newer city lies inside the flooded areas.
(E) A satellite navigation receiver records the exact latitude and longitude of each building or flood mark the workers note, so their field data can be placed accurately on the GIS layers.
(F) Personal interviews with families at the city's edge. They record people's own reasons for moving, such as cheaper land or a new job; images can show the new houses but not why people chose them.
(G) Images show what is on the surface, not who lives there or why. Clouds or coarse detail can also hide small buildings, so the team still needs field data and written accounts to check and explain what the images show.
Score your own answer. This is a self-check, not a grade. Tick each point your answer makes.
Part 6 Check yourself The shore of Lake Teal
The case questions use the table. The others mix the ideas from the whole lesson.
A hypothetical county is studying why the shore of hypothetical Lake Teal has moved over the past ten years. Its report lists the eight sources it drew on.
| Source | What it is |
|---|---|
| A | Satellite images of the whole lake, one taken ten years ago and one taken this year |
| B | A newspaper story about docks left sitting on dry land along the north shore |
| C | The state's official rules on how much water farms near the lake may pump |
| D | Written notes from interviews with five longtime lakeside residents about how the lake has changed |
| E | Mapping software that layers the shoreline from both years over property lines and measures the change on each lot |
| F | Water depths that a university team measured by lowering a weighted, marked rope from a rowboat at 30 marked points lined up with stakes on the shore |
| G | An interactive web map the county posted, where residents can click to see the old and new shoreline |
| H | A retired teacher's own weekly readings of the water level on a marked post at her dock |
Case question 1 · Calculate
How many of the eight sources in the Lake Teal report come from a geospatial technology?
Case question 2 · Multiple choice
Which statement best describes sources F and H in the Lake Teal report?
Case question 3 · Decide and justify
The report's author wants to explain why some lakeside residents moved their docks out toward the water and others did not. Which source should the author rely on most?
Which reason supports your answer?
The rest stand on their own and do not use the case.
Check yourself · Fill the statement
A farmer in a hypothetical valley flies a small drone over her fields. Complete the description of the methods she uses.
The drone's camera records images that show which parts of the crop are short of water; gathering those images is . The drone keeps track of where it is flying, its latitude and longitude, by . Back home, she loads the images and a layer of her field boundaries into software to measure how many acres are dry.
Check yourself · Match
Match each kind of written account to the example of it.
Part 7 Keep it Bring back earlier ideas
This lesson stands on the maps of Topic 1.1.
From 1.1 Introduction to Maps · Match
Each statement tells a visitor where a hypothetical clinic is from a school. Match each term to the statement it describes.
From 1.1 Introduction to Maps · Fill the statement
Complete the description of a world map made by a hypothetical mapmaker.
To draw the round Earth on a flat page, the mapmaker uses a . It keeps the shapes of small areas true, and in return it distorts . She also leaves out every road and city, because the map is for a lesson on coastlines; like every map, it is .
In three lines
- Field data is gathered firsthand, in the place being studied, by organizations or by individuals.
- Geospatial technologies: a GIS layers and analyzes data, satellite navigation finds a location, remote sensing records the surface from a distance, and online maps show data to the public.
- Written accounts give spatial information in words: field observations, media reports, travel narratives, policy documents, personal interviews, landscape analysis and photographic interpretation.
Exam strategy for this topic
- Section I, Multiple Choice: 60 questions in 60 minutes.
- Section II, Free Response: 3 questions in 75 minutes.
When a question describes a source, first decide how the information was gathered: on site (field data), by one of the geospatial technologies, or in words (a written account). Then name the specific kind, such as remote sensing or a policy document, and say what it can and cannot show.
Questions students ask
Is GPS the same thing as a satellite navigation system?
GPS is one satellite navigation system, the best known. Other countries run their own systems, and a phone often uses several at once. They all do the same job: use signals from satellites to find where a receiver is.
Is a GIS just a digital map?
No. A GIS stores data in layers lined up by location and lets a user combine and analyze them, for example measuring which homes sit near a stream. Maps are one thing it makes; analysis is what sets it apart.
Is a satellite image remote sensing or photographic interpretation?
The image itself was gathered by remote sensing. A person's written description of what the image shows is photographic interpretation. Read which one a question is asking about.
Why use written accounts when there are satellites and GIS?
Images and coordinates show where things are and how they change. Written accounts show what people intend, decide and experience, and old travel narratives describe places before anyone measured them. Most studies use several methods together.
Are the places in this lesson real?
No. Every country, county, town, lake, neighborhood and person here is hypothetical, and every number was made up to show a method clearly.
Course alignment, for teachers
AP Human Geography topic 1.2, Unit 1: Thinking Geographically.
- Skill 3.A: Identify the different types of data presented in maps and in quantitative and geospatial data.
This lesson maps all 3 essential knowledge statements of the topic to the part that teaches each one: 3 are checked by a scored question. The map is in the lesson file.