Unit 1 · Topic 1.3 · about 30 minutes · 7 parts · 12 scored checks, 3 of them multiple choice, plus 2 from earlier lessons
AP Human Geography 1.3: The Power of Geographic Data
Unit 1: 8 to 10% of the multiple-choice section
What you'll be able to do
- Explain how decisions made with geographic data, such as census counts and satellite images, change places, whether the decision is a person's, a business's or organization's, or a government's.
Key vocabulary
| Term | What it means | The exam trap |
|---|---|---|
| Geographical data | Any information about places, the people who live in them and their environments; often called geographic data for short. | It is broader than maps: a count, an image or a written observation can all be geographic data. |
| Geospatial data | Geographic data in which each record is tied to a location, such as coordinates, an address or a district, so it can be mapped. | Being tied to a place does not make data detailed: a table of national totals is tied to the country, so it cannot be mapped for any smaller place. |
| Census data | Data from a census, an official count of a country's whole population taken at set intervals and reported for areas as small as a census tract. | A census is a snapshot from one date, so check how old the count is before you rely on it. |
| Satellite imagery | Pictures of Earth's surface taken from satellites in orbit, repeated over time. | Images come at different levels of detail, so check that an image is sharp enough to show what you are looking for. |
| Scale | The size of the area a decision or a study covers: local, regional, national or global. | Here it is not map scale, the ratio between a distance on a map and the same distance on the ground. |
 Tap to open the picture full size
Part 1 Think first Who gets the new classrooms?
Commit to a guess first. Being wrong now makes the right idea stick better.
Predict first
Hypothetical Country N pays for new school classrooms in each province according to how many children its census counts there. In the latest census, counters missed many families in the fast-growing towns of the northern province. Over the next ten years, what do you expect in the schools of those northern towns?
In short. Geographic data, from census counts of people to satellite images of the land, guides personal, business and organizational, and governmental decisions at every scale, and those decisions change where people live, work and travel and how land is used.
- A census counts people and records facts about their households by place; satellite imagery shows what is on Earth's surface and, compared across dates, how it changes.
- Individuals, businesses and organizations, and governments from local to global all decide with this data: a route, a store site, where aid goes first, how seats and money are divided.
- A decision's geographical effects are the changes it makes on the ground, and the decision is only as good as its data: an undercount or an old image steers it wrong.
Part 2 Learn it Geographic data and the decisions it drives
2a. Census data and satellite imagery
Geographical data (also called geographic data) is any information about places, the people in them and their environments. When each record is tied to a location, such as coordinates, an address or a district, it is geospatial data: it can be mapped and laid over other data for the same places.
A census is an official count of a country's whole population, taken at set intervals, often every ten years. It records facts about each household, such as how many people live there, their ages and the languages they speak, and reports them for small areas called census tracts and for larger areas up to the whole country. Satellite imagery is pictures of Earth's surface taken from orbit. It shows what is on the ground (buildings, roads, fields, forest, water), and because satellites pass over again and again, comparing images from two dates shows change. Two censuses compare the same way: a tract that grew from 5,000 to 6,000 residents grew by 1,000 ÷ 5,000 = 20% of where it started.
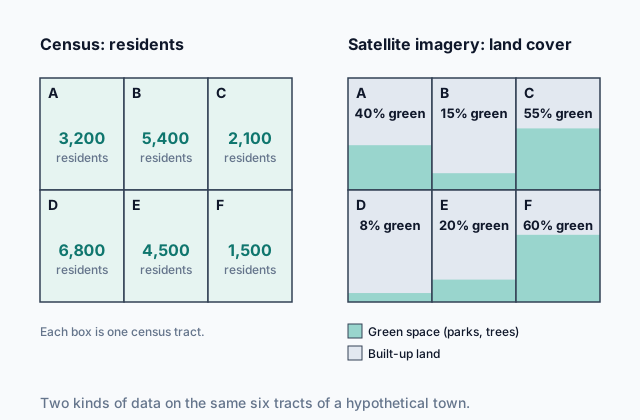
The picture at the top lays both over the same six tracts of a hypothetical town. The census tells you how many people live in each tract; the satellite imagery tells you how much of each tract is green space. Neither answers the other's question: a picture of rooftops does not tell you who lives under them, and a head count does not show where the parks are.
Quick check · Sort it
A hypothetical county planning office has six questions to answer. Tap a question, then the kind of data that answers it.
Census data
Satellite imagery
2b. Personal, business and organizational decisions
The same data serves very different decision makers. Geographers group the purposes three ways: personal; business and organizational; and governmental. This chunk takes the first two.
Personal decisions. A person checks a phone map for the fastest route to work, looks at a flood-risk map before renting an apartment, or compares how far two homes are from the nearest school. Each choice uses geospatial data about places.
Business and organizational decisions. A hypothetical supermarket company compares census counts of households near three possible sites before it signs a lease, since a store needs enough customers nearby. A farming company reads satellite images of its fields to see which ones are driest and need water first. Nonprofit organizations, which serve a cause rather than seek a profit, decide the same way: a hypothetical relief group reads satellite images taken after an earthquake to find collapsed buildings and blocked roads, and sends its teams there first.
In each case the decision maker reads a pattern across places, not one number, and chooses a place because of that pattern.
Quick check · Calculate
A hypothetical clinic company will open its next clinic in whichever of three districts has the most residents aged 65 and over. Census data shows District 1 with 40,000 residents, 10% of them aged 65 and over; District 2 with 25,000 residents, 20% of them aged 65 and over; and District 3 with 60,000 residents, 5% of them aged 65 and over. How many residents aged 65 and over live in the district the company should choose?
2c. Governmental decisions at every scale
Governments are among the heaviest users of geographic data, and they use it at every scale.
At the local scale, a hypothetical county compares satellite images from one year with the next to find new buildings and keep its property map current, and a city fire department maps the addresses of past emergency calls to choose a site for a new station.
At the regional scale, a hypothetical state reads census data on where people live and where they work to see which towns and cities the most commuters travel between, and widens the highways that link them first.
At the national scale, many countries use census counts to divide seats in the national legislature among regions and to split money for schools, roads and hospitals. A region that grows gains seats and money; one that shrinks, or is undercounted, loses them.
At the global scale, international agencies read satellite images of farmland across many countries to spot failing harvests early and send food aid before shortages hit.
The census is a government's main count of people, so it drives decisions about people: seats, funding and services. Satellite imagery covers huge or remote areas quickly and repeatedly, so it drives decisions about land: growth, damage, crops and forests.
Quick check · Decide and justify
A hypothetical national forestry agency must find where trees are being cut illegally across a huge, remote forest that spans three provinces. Which data should it rely on?
Which reason supports your answer?
2d. Decisions change places
Geographic data is gathered to decide something, and a decision about a place changes that place. Those changes are the decision's geographical effects: where people live, work and travel, how land is used, and what gets built.
Take a hypothetical state that widens a highway after census data shows heavy commuting between a small town and a large city. Driving time falls, so living in the town and working in the city gets easier. New housing goes up along the highway, farmland on the town's edge turns into subdivisions, and traffic grows. A decision made with data about commuting changed land use far from the city.
Effects also depend on the data being right. A census taken years ago misses recent growth, and an undercount (people the census missed) steers money and services away from the places that need them. A satellite image taken before a storm says nothing about the damage after it. Before you trust a decision, ask when and how its data was gathered, and who or what it might leave out.
To explain an effect, name the decision, the data behind it, and what changes on the ground, and where.
Quick check · Put it in order
A hypothetical supermarket company uses census data to choose a site for a new store. Put the events in the order they happen, from the data to the last effect.
Part 3 Watch it done Where should the cooling centers go?
Watch each step, then do the last one yourself.
Hypothetical City V will open cooling centers, air-conditioned public rooms where people can escape the heat. Its rule: a neighborhood qualifies if satellite imagery shows tree canopy covering less than 15% of its land, and each qualifying neighborhood gets one cooling center for every 2,000 residents aged 65 and over that the census counts there. North has 30% canopy and 6,000 residents aged 65 and over; East has 10% canopy and 4,000; South has 12% canopy and 8,000; West has 25% canopy and 2,000. How many cooling centers will City V open in all?
Predict first
Before the steps, which neighborhoods do you expect to qualify for cooling centers?
Step 1 · Set out the two tests
The rule has two tests, in order. First the satellite imagery: a neighborhood qualifies only if tree canopy covers less than 15% of its land. Then the census: a qualifying neighborhood gets one center for every 2,000 residents aged 65 and over. A neighborhood that fails the first test gets none, however many older residents it has.
Step 2 · Apply both tests to East
East's canopy is 10%, under 15%, so it qualifies. The census counts 4,000 residents aged 65 and over there: 4,000 ÷ 2,000 = 2 cooling centers.
Why this step?
Why does the rule use both kinds of data instead of the census alone?
The census says where older residents live, but not which neighborhoods have the least shade and heat up most. The satellite imagery shows where shade is scarce. Together they send the centers to places with both many people at risk and little shade.
Your step · Calculate
Finish it. Apply the same two tests to North, South and West, then add their cooling centers to East's 2. What is the city's total?
cooling centers
Part 4 Try it Decide where help goes first
Try it · Rank it
After a storm, a hypothetical relief organization reads satellite imagery of four villages to find the share of each village's homes standing in floodwater. It will send teams first where the most homes are flooded. Work out the number of flooded homes in each village, then rank the villages.
Most flooded homes first
Give each one a place, 1 for first. Give two the same place if they are equal.
Your ranking: none yet
Try it · Multiple choice
Hypothetical County R compares satellite images taken during three floods and finds that water covered the same riverside streets each time. It buys the homes on those streets, removes them, and bans new building there. Which change in County R's geography is most likely to follow?
Part 5 Explain it Explain a bus route decision
Nothing you type leaves this page. Check your answer against the model and each scoring point.
Free response is 50% of the exam score. This one is shaped like Question 2, from free-response II.
Free-response practice · Question 2 style
Stimulus 1, a hypothetical table for four neighborhoods of City T:
Neighborhood A: 12,000 residents; 35% of households own no car; no bus stops within a 10-minute walk
Neighborhood B: 15,000 residents; 30% of households own no car; one bus stop within a 10-minute walk
Neighborhood C: 8,000 residents; 5% of households own no car; three bus stops within a 10-minute walk
Neighborhood D: 6,000 residents; 10% of households own no car; two bus stops within a 10-minute walk
(A) Identify the type of data source that reports the share of households that own no car.
(B) Describe the relationship between car ownership and bus service shown in the table.
(C) Explain how City T's transit agency could use the table to decide where to add a new bus route.
(D) The agency runs a new route through Neighborhood A. Explain one likely geographical effect on Neighborhood A.
(E) Explain how satellite imagery could add to the data in the table as the agency plans the route.
(F) Explain one limitation of the table's household data for this decision.
(G) Explain how a business could use the same data to make a decision of its own.
Model answer
(A) A census, which records facts about every household, such as whether it owns a car, and reports them by neighborhood.
(B) The neighborhoods where the most households own no car have the fewest bus stops. Neighborhood A (35%) has none within a 10-minute walk and Neighborhood B (30%) has one, while Neighborhood D (10%) has two and Neighborhood C (5%) has three. Bus service is thinnest where people depend on it most.
(C) The agency could look for a neighborhood with many residents, a high share of households without cars and few bus stops, and run the route there. Neighborhood A fits all three: 12,000 residents, the highest share without cars and no stop within a 10-minute walk.
(D) Residents without cars could reach jobs, stores and clinics across the city, so more of them could work outside the neighborhood. Over time, shops may open near the new stops, and homes near the route may rise in price as more people want to live there.
(E) Satellite imagery shows the street network, where buildings stand and where new housing is going up. The agency could use it to choose streets that can carry buses and to place stops near the most crowded blocks or near new housing the census has not yet counted.
(F) Census data may be years old, so it can miss recent growth or changes in car ownership. It also gives one figure for a whole neighborhood, which can hide blocks where far more, or far fewer, households have no car.
(G) A grocery company could open a small store near a new stop in Neighborhood A, where many people without cars will now pass by and could not easily drive to a large supermarket.
Score your own answer. This is a self-check, not a grade. Tick each point your answer makes.
Part 6 Check yourself The four districts of County K
The case questions use the table. The others mix the ideas from the whole lesson.
Hypothetical County K publishes census counts for its four districts from two censuses ten years apart. Its planning office also reads, from satellite images taken in the same two years, the share of each district covered by buildings and pavement (built-up land).
| District | Residents, earlier census | Residents, latest census | Built-up land, earlier | Built-up land, latest |
|---|---|---|---|---|
| North | 20,000 | 22,000 | 10% | 11% |
| East | 15,000 | 30,000 | 12% | 30% |
| South | 40,000 | 38,000 | 35% | 35% |
| West | 10,000 | 16,000 | 5% | 9% |
Case question 1 · Multiple choice
Which conclusion do County K's census counts and satellite readings support together?
Case question 2 · Calculate
By what percentage did West's population grow between County K's two censuses?
Case question 3 · Multiple choice
County K's planners extend new water and sewer lines, before any other district, into the district with the smallest share of built-up land in the latest satellite reading. Which change in County K is most likely over the next ten years?
The rest stand on their own and do not use the case.
Check yourself · Match
Each example below is a decision made with geographic data. Match each kind of decision maker to its example.
Check yourself · Spot the error
A student explains the effect of a decision made with census data. Which line is the first to go wrong?
Part 7 Keep it Bring back earlier ideas
This lesson stands on geographic data from Topic 1.2 and maps from Topic 1.1.
From 1.2 Geographic Data · Match
Match each geospatial technology to the task it does.
From 1.1 Introduction to Maps · Multiple choice
A map of hypothetical County V shows that 18 of its 20 car dealerships sit along a 2 km stretch of one highway, and that its 25 public schools are spread across the county, about one in each township. Which statement best describes the two patterns?
In three lines
- A census counts people and their households by place; satellite imagery shows the land and, compared across dates, how it changes.
- Personal, business and organizational, and governmental decisions at every scale, from local to global, are made with this data.
- A decision's geographical effects are what it changes on the ground and where, and they are only as sound as the data behind it.
Exam strategy for this topic
- Section I, Multiple Choice: 60 questions in 60 minutes.
- Section II, Free Response: 3 questions in 75 minutes.
When a question asks for the effect of a decision made with geographic data, name what changes on the ground and where: who moves, what gets built, how land is used. Then tie the change back to the data and the decision that caused it.
Questions students ask
What is the difference between geographic data and geospatial data?
Geographic data is any information about places, people and environments. Geospatial data is geographic data tied to specific locations, such as coordinates or districts, so it can be mapped and combined with other data for the same places.
What does a census record?
A census counts everyone in a country as of a set date and records facts about each household, such as its size and the ages of its members. Countries ask different questions, and the results are reported for small areas such as census tracts and for larger ones up to the whole country.
Why does a census undercount matter?
Governments split seats and money by census counts. A place where people were missed is counted as smaller than it is, so it gets less than its real population would earn, and its schools, clinics and roads fall behind.
Do only governments use geographic data?
No. Individuals use it to choose routes and homes, businesses to choose store sites and manage farms, and organizations such as relief groups to decide where help goes first. Governments use it at every scale, from a county to international agencies.
Are the places and numbers in this lesson real?
No. Every country, county, city, town, company and organization here is hypothetical, and every number is invented to show the idea clearly.
Course alignment, for teachers
AP Human Geography topic 1.3, Unit 1: Thinking Geographically.
- Skill 3.B: Describe spatial patterns presented in maps and in quantitative and geospatial data.
This lesson maps the one essential knowledge statement of the topic to the part that teaches each one: 1 is checked by a scored question. The map is in the lesson file.