Unit 1 · Topic 1.6 · about 30 minutes · 7 parts · 12 scored checks, 3 of them multiple choice, plus 2 from earlier lessons
AP Human Geography 1.6: Scales of Analysis
Unit 1: 8 to 10% of the multiple-choice section
What you'll be able to do
- Define the four scales of analysis geographers use: global, regional, national and local, and name the scale a study or a data set uses.
- Explain what looking at patterns and processes at different scales reveals: variation that one figure for a large area hides, causes that sit at a broader scale, and different readings of the same data.
Key vocabulary
| Term | What it means | The exam trap |
|---|---|---|
| Scale of analysis | The size of the area a geographer chooses to study, from the whole world down to a single place. | It is not map scale, the ratio of a distance on a map to the same distance on the ground. |
| Global scale | The scale of analysis that covers the whole world. | Global describes the area studied, not how important or how large the topic is. |
| Regional scale | The scale of analysis that covers an area bigger than a local place but not a single whole country, such as a group of neighboring countries or a large part of one country. | The word region also names areas that share a feature, which Topic 1.7 takes up; as a scale, it describes how much area a study covers. |
| National scale | The scale of analysis that covers one country as a whole. | A country small in area or people is still studied at the national scale when the whole country is the unit. |
| Local scale | The scale of analysis that covers a city, a town, a neighborhood or a single site. | A city of millions is still studied at the local scale when the study covers only that city. |
 Tap to open the picture full size
Part 1 Think first What does one number say about one town?
Commit to a guess first. Being wrong now makes the right idea stick better.
Predict first
A reporter reads that 6% of the workers in hypothetical Country V are unemployed. She is writing a story about Town W, one town in Country V. What does the 6% figure tell her about unemployment in Town W?
In short. A scale of analysis is the size of the area a geographer studies, global, regional, national or local, and the same data can show different patterns and support different readings at each one.
- The four scales are global (the whole world), regional (a group of countries or a large part of one), national (one country as a whole) and local (a city, town, neighborhood or single site).
- Zooming in shows variation that one figure for a larger area hides. A share for the whole is the total count divided by the total, not the average of the parts' shares.
- Zooming out links a local change to a larger process, and a conclusion holds at the scale its data describes.
Part 2 Learn it Four scales, and what each one shows
2a. The four scales of analysis
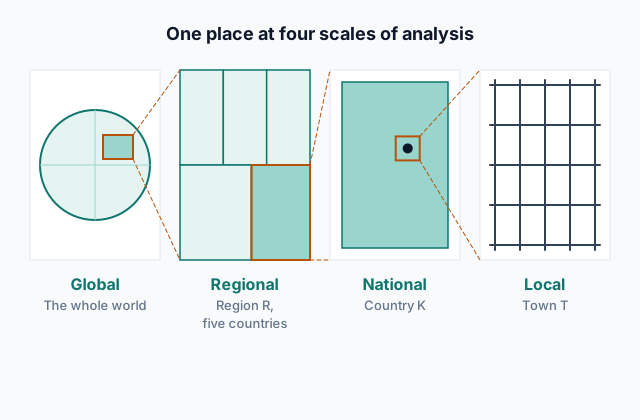
A scale of analysis is the size of the area a geographer studies. Geographers work at four:
- Global: the whole world, such as comparing the share of people living in cities in every country.
- Regional: an area bigger than a local place but not a single whole country: a group of neighboring countries, such as a hypothetical five-country trade bloc, or a large part of one country, such as the hypothetical southern provinces of Country K.
- National: one country as a whole, such as hypothetical Country K's total wheat harvest.
- Local: a city, town, neighborhood or single site, such as the traffic at one corner of hypothetical Town T.
Name the scale by the area the study covers, not by who gathered the data. A national ministry counting the traffic at one corner is working at the local scale.
Every place sits at all four scales at once. Town T is a local place inside Country K, which belongs to a region, which is part of the world, so a question about Town T can be asked at any of those scales.
Scale of analysis is not map scale, the ratio between a distance on a map and the same distance on the ground.
Quick check · Sort it
Each card describes a study in a hypothetical setting. Tap a card, then the scale of analysis it uses.
Global
Regional
National
Local
2b. Zooming in shows variation
Data for a large area is often reported as one figure. Split the area into smaller parts and differences appear that the single figure hid.
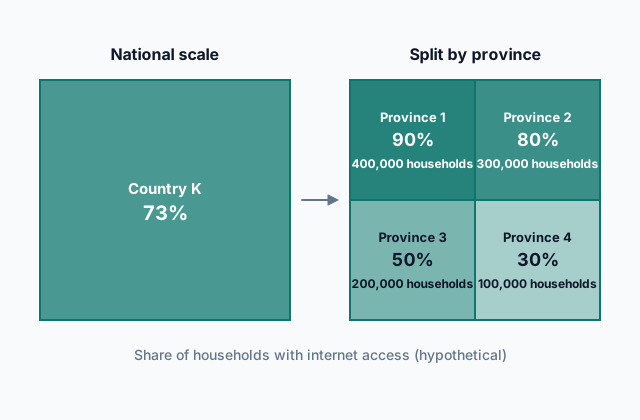
Hypothetical Country K reports that 73% of its households have internet access. Split by province, the share runs from 90% down to 30%:
 Tap to open the picture full size
No province sits at 73%. Provinces 1 to 4 hold 400,000, 300,000, 200,000 and 100,000 households, so the national figure is the households with access added up and divided by all the households: (360,000 + 240,000 + 100,000 + 30,000) ÷ 1,000,000 = 73%. The plain average of the four shares, 62.5%, treats Province 4 as if it were as large as Province 1, and it is not the national figure.
Zooming in can go further. Each province's figure also combines its towns and neighborhoods, and local data would show differences inside it.
Quick check · Calculate
Hypothetical Country L has three provinces. Province A has 1,000,000 workers, and 4% of them are unemployed. Province B has 1,000,000 workers, and 6% are unemployed. Province C has 2,000,000 workers, and 15% are unemployed. What percent of all of Country L's workers are unemployed?
2c. Zooming out shows processes
A change seen at one scale often has its cause at another. Zooming out connects a local change to a larger process.
Hypothetical Town T loses a third of its people in twenty years. At the local scale, residents point to the shoe factory that closed and the empty shops on the main street. At the national scale, hypothetical Country K shows the same loss in dozens of small towns while its large cities grow: Town T is one case of a move from small towns to cities. At the global scale, shoe making has moved to countries where wages are lower, and that is why the factory closed.
Each scale answers a different question. The local scale shows who left and what closed. The national scale shows that Town T is part of a pattern, not an exception. The global scale shows a process that reached Town T from far away.
Study one scale only and you can miss the cause, or take a single town's story as the rule for a whole country. Zooming out works only as far as the data goes: a broader scale explains a local change when data at that scale shows the pattern.
Quick check · Multiple choice
In hypothetical Town T, house prices double over five years. Over the same five years, after hypothetical Country K's central bank cuts interest rates, house prices rise in nearly every town and city of Country K. The data covers no other country. What does looking at the national scale show about the rise in Town T?
2d. Same data, different readings
Each scale shows different things, so the same data can support different interpretations. Take hypothetical Country K's farm survey, with invented numbers: average farm income across the country rose 8% in five years. A national official reads that as good news for farmers. A reporter in the country's dry east, hit by three years of drought, finds that incomes there fell 20%.
Both readings are accurate. They describe the same survey at different scales, and each supports a different conclusion: the national one about the country's farm economy as a whole, the regional one about the dry east.
Two habits keep an interpretation honest:
- State the scale with the claim. "Farm income rose across Country K" is accurate; "farmers are doing better" invites a reader to apply it everywhere.
- Before drawing a conclusion about one place from data for a larger area, or about a larger area from one place, check the data at the scale the conclusion is about.
Quick check · Fill the statement
Complete the description of two reports on school attendance.
Two reports use the same hypothetical survey of school attendance in Country K, comparing the same two years. One gives a single figure for the whole country, read at the scale, and finds that attendance rose. The other studies one school district, at the scale, and finds that attendance there fell. Both reports can be accurate, because each report covers a different .
Part 3 Watch it done One country, two districts
Watch each step, then do the last one yourself.
Hypothetical Country M has two districts. District 1 has 300,000 households, and 270,000 of them have piped water. District 2 has 100,000 households, and 30,000 of them have piped water. Country M reports one national figure for the share of households with piped water. How many percentage points below that national figure is District 2's own share?
Predict first
Before the steps, how far below the national figure do you expect District 2 to be?
Step 1 · Find District 1's share
270,000 ÷ 300,000 = 90%. District 1 holds three of every four households, so it will pull the national figure toward its own share.
Step 2 · Plan the national figure
The national figure combines both districts, so it comes from the counts, not from the two districts' shares: add the households with piped water in both districts, then divide by all the households in Country M.
Why this step?
Why work out each district's share from its own counts, instead of using the national figure for both?
The national figure is a national-scale number: it combines both districts into one. Only each district's own counts show how its households are served.
Your step · Calculate
Finish it. Using the counts for both districts of hypothetical Country M, work out the national share of households with piped water and District 2's own share. How many percentage points below the national figure is District 2?
percentage points
Part 4 Try it Pick the scale for the question
Try it · Decide and justify
Hypothetical Country K's health ministry has money for one new clinic. It has two kinds of data on the share of residents who live more than an hour from a doctor: one figure for the whole country, and a figure for each town. Which data should guide where the clinic goes?
Which reason supports your answer?
Try it · Select all
Hypothetical Country K's national report says the average farm in the country grew larger over ten years. Which two questions could a geographer answer only with data at a more local scale than the national one? Select two.
Select 2 answers, then check.
Part 5 Explain it Read hospital access at three scales
Nothing you type leaves this page. Check your answer against the model and each scoring point.
Free response is 50% of the exam score. This one is shaped like Question 2, from free-response II.
Free-response practice · Question 2 style
Stimulus, a hypothetical table: the share of households within 30 minutes of a hospital in hypothetical Country R, 2025 (all figures invented).
- Country R as a whole: 80%
- North Province (40% of Country R's households): 95%
- Central Province (40% of households): 85%
- South Province (20% of households): 40%
- The world as a whole (all households in every country, hypothetical figure): 60%
(A) Identify the scale of analysis of the 80% figure for Country R as a whole.
(B) Define scale of analysis.
(C) Describe the pattern the table shows when Country R is split into provinces.
(D) Explain how reading only the 80% figure could lead to a different interpretation of hospital access in Country R than the province figures.
(E) Explain how comparing Country R with the world figure changes how its 80% figure can be read.
(F) Explain why Country R's health ministry would want local data, not only the province figures, before choosing where to build a new hospital.
(G) Explain one limitation of the data in the table for judging access to hospital care in Country R.
Model answer
(A) The national scale.
(B) A scale of analysis is the size of the area a geographer studies: global, regional, national or local.
(C) Access is high in North Province (95%) and Central Province (85%) and much lower in South Province (40%), so the share drops sharply in the south.
(D) The 80% figure combines all three provinces into one number, which suggests that most households everywhere are near a hospital. The province figures show that in South Province 60% of households are more than 30 minutes from one. A reader of the national figure alone could conclude that Country R has no access problem, while the province figures point to a problem in the south.
(E) At the global scale, Country R's 80% is well above the world figure of 60%, so Country R looks well served compared with other countries. That reading is accurate at that scale, yet South Province, at 40%, is below the world figure.
(F) A province figure also combines many towns and villages. To put the hospital where it reaches the most households that are now far from care, the ministry needs to know which towns, inside South Province or elsewhere, are farthest from a hospital, and only local data shows that.
(G) The table gives only travel time for one year. It does not show whether the nearest hospital offers the care people need, and each province figure still hides differences between towns inside it.
Score your own answer. This is a self-check, not a grade. Tick each point your answer makes.
Part 6 Check yourself The districts of Country Z
The case questions use the table and the note. The others mix the ideas from the whole lesson.
Hypothetical Country Z counted its people in 2015 and again in 2025 (all numbers invented). Its statistics office adds a note: a new port opened in District 1 in 2018 and hired thousands of workers.
| District | 2015 | 2025 |
|---|---|---|
| District 1 | 2,000,000 | 2,600,000 |
| District 2 | 1,000,000 | 1,100,000 |
| District 3 | 600,000 | 480,000 |
| District 4 | 400,000 | 300,000 |
Case question 1 · Multiple choice
A national official reads the table and concludes that Country Z's population grew in every part of the country. Which statement best evaluates that conclusion?
Case question 2 · Calculate
By what percent did Country Z's total population change from 2015 to 2025? Give a positive number for growth and a negative number for a loss.
Case question 3 · Multiple choice
District 4's council says its own town services drove people away, and it plans to fix them. Using the table and the note, what does viewing District 4's loss at the national scale show?
The rest stand on their own and do not use the case.
Check yourself · Spot the error
A student reasons about one town from national data. Which line is the first to go wrong?
Check yourself · Decide and justify
A hypothetical global report finds that the world's total forest area barely changed over ten years. Hypothetical Country K's report finds that its own forest area fell by a fifth over the same years (both figures invented). Can both reports be accurate?
Which reason supports your answer?
Part 7 Keep it Bring back earlier ideas
Two questions from Topics 1.5 and 1.4 come back here.
From 1.5 Human–Environmental Interaction · Calculate
A hypothetical lake holds about 900 tons of one kind of fish. Each year breeding and growth add about 50 tons of fish, and the villages around the lake catch 80 tons. If both amounts stay the same every year, in how many years will the fish be gone?
From 1.4 Spatial Concepts · Decide and justify
Hypothetical towns Ardel and Bransk have the same population, and each is 50 km by road from City Q, the region's shopping center. Ardel's road is a new expressway, a 35-minute drive. Bransk's is a winding mountain road, a 90-minute drive. Which town would you expect to send more shopping trips to City Q for each resident?
Which reason supports your answer?
In three lines
- The four scales of analysis are global, regional, national and local, each named by the area a study covers.
- Zooming in shows variation that one figure for a larger area hides; a share for the whole is the total count divided by the total.
- Zooming out links a local change to a larger process, and a conclusion holds at the scale its data describes.
Exam strategy for this topic
- Section I, Multiple Choice: 60 questions in 60 minutes.
- Section II, Free Response: 3 questions in 75 minutes.
When a question gives data, name the scale it covers first. Then ask what a more local scale would show that this one hides, and what a broader scale would show that this one cannot.
Questions students ask
Is the regional scale larger or smaller than the national scale?
It can be either. A group of neighboring countries is larger than any one of them, and a large part of one country, such as several of its provinces, is smaller than the country. What makes it regional is that it covers more than one local place without being one whole country.
Is scale of analysis the same as map scale?
No. Map scale is the ratio between a distance on a map and the same distance on the ground. Scale of analysis is the size of the area being studied. A local study can be drawn on a map at any map scale.
Which scale is the right one to use?
The one that matches the question. A question about one town needs data for that town; a question about how a country compares with countries around the world needs data at the global scale. Often the clearest answer comes from looking at more than one scale.
If a national figure hides so much, is it wrong?
No. A national figure is accurate for the country as a whole. It becomes misleading only when someone reads it as the figure for each place inside the country.
Are the countries, towns and numbers in this lesson real?
No. Every country, district, town and number here is hypothetical, chosen to show each idea clearly. Real data behaves the same way: what it shows depends on the scale it is read at.
Course alignment, for teachers
AP Human Geography topic 1.6, Unit 1: Thinking Geographically.
- Skill 5.A: Identify the scales of analysis presented by maps, quantitative and geospatial data, images, and landscapes.
This lesson maps all 2 essential knowledge statements of the topic to the part that teaches each one: 2 are checked by a scored question. The map is in the lesson file.