Unit 1 · Topic 1.7 · about 30 minutes · 7 parts · 12 scored checks, 3 of them multiple choice, plus 2 from earlier lessons
AP Human Geography 1.7: Regional Analysis
Unit 1: 8 to 10% of the multiple-choice section
What you'll be able to do
- Describe the different ways geographers define regions: by one or more shared characteristics or by a pattern of activity; as formal, functional or perceptual regions; with boundaries that fade, are disputed and overlap; and at the local, national and global scales.
Key vocabulary
| Term | What it means | The exam trap |
|---|---|---|
| Region | An area that geographers treat as one unit because its places share something or are linked by what people do. | Find what holds the area together before you name its type. |
| Formal region | A region defined by one or more characteristics its places share, such as a language or a main crop. | Most of the area shares the trait, not every place in it, so expect exceptions inside. |
| Functional region | A region defined by a pattern of activity, such as trips or deliveries, linking places to a central place called a node. | Its places can differ in every trait, so look for the movement that links them. |
| Perceptual or vernacular region | A region defined by people's shared sense of a place, such as an area residents call by one informal name. | Formal and functional regions can carry popular names too, so a name alone does not settle the type. |
| Regional boundary | The edge a geographer draws around a region on a map. | Read the map's key for the rule that set the line before you compare two maps. |
| Contested boundary | A regional boundary that people or groups disagree about, such as where a region ends or which region a place belongs to. | Name who disagrees and what they disagree about before you call an edge contested. |
| Overlapping regions | Two or more regions that take in some of the same ground. | Compare where each region's edge falls, not only which places each one holds. |
| Regional analysis | Studying places by dividing an area into regions and comparing them. | Say what scale the study works at, since one place can appear in studies at several scales. |
 Tap to open the picture full size
Part 1 Think first Where does the Olive Coast end?
Commit to a guess first. Being wrong now makes the right idea stick better.
Predict first
A mapmaker is drawing the Olive Coast, a hypothetical farming area. A road runs east from the coast through ten towns, and a survey counts the share of farms in each town that grow olives. In order from the coast, the shares are 90, 88, 80, 71, 60, 47, 35, 22, 10 and 4 percent. Where does the Olive Coast end?
In short. A region is an area that geographers treat as one unit because its places share one or more characteristics or are tied together by a pattern of activity.
- Formal regions are defined by a characteristic their places share, functional regions by a pattern of activity around a central place, and perceptual or vernacular regions by what people believe about an area and call it.
- Regional boundaries are transitional, often contested and often overlapping, so a line on a map is a rule the geographer chose, not a wall on the ground.
- Geographers draw and compare regions at the local, national and global scales, and the scale changes what a region shows.
Part 2 Learn it How geographers define regions
2a. What makes an area a region
A region is an area a geographer treats as one unit because something ties it together. There are two kinds of tie.
The first is a unifying characteristic: a trait shared across the area, such as a language, a religion, a climate or a main crop. A region can rest on one trait or on several at once. Hypothetical Country T could define a region it calls the Cotton Plains as the provinces where most farmland grows cotton. It could also define a narrower region: the provinces where most farmland grows cotton and most farms are irrigated. Each added trait is one more test a province has to pass, so a region built on two traits can never be larger than one built on either trait alone.
The second is a pattern of activity: people, goods or information moving between places. The homes a bakery delivers bread to, or the towns whose workers travel to jobs in one city, form a region even if those places share no trait at all.
In both cases the geographer chooses what to measure and where to draw the line. A region is a tool for organizing places, so a map of one should say what defines it.
Quick check · Calculate
Hypothetical Country T's farm agency defines its Milk Country as the provinces that meet both of two rules: at least 40 percent of farmland is pasture, and at least 30 percent of farm income comes from milk. Its data, given as pasture percent and milk-income percent, are: Province 1, 55 and 42; Province 2, 48 and 25; Province 3, 62 and 38; Province 4, 35 and 33; Province 5, 41 and 30; Province 6, 29 and 12; Province 7, 44 and 51. How many provinces are in the Milk Country?
2b. Formal, functional and perceptual regions
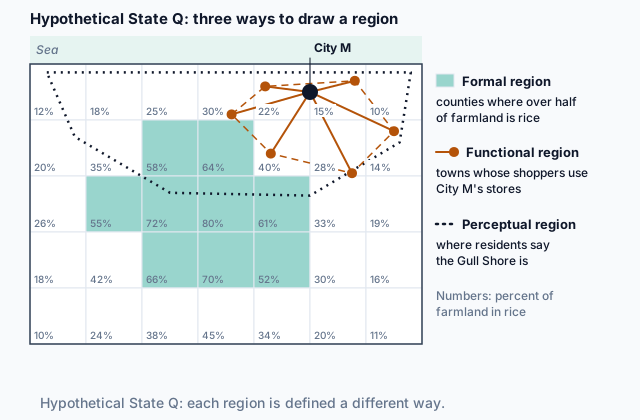
Geographers name three types of region. The map at the top of the page draws one of each over hypothetical State Q.
A formal region is defined by a characteristic its places share, such as a language, a religion, a crop or a climate. State Q's shaded counties, where over half the farmland grows rice, form one.
A functional region is defined by a pattern of activity around a central place, called its node. City M and the towns whose shoppers travel to its stores form one. A newspaper's delivery area and an airport's passenger area are others. The places in a functional region can look nothing alike; the flows to the node hold it together.
A perceptual region, also called a vernacular region, exists in people's shared sense of a place: an area residents call by one name and think of as one place, like the Gull Shore on the map. No shared trait or single flow defines it, so different people draw its edge in different places. A perceptual region is often mapped from a survey of what people believe, so when a region comes from data, ask what the data records: a trait the places share, a flow to a node, or a belief.
Regions of different types can cover the same ground: the Gull Shore takes in City M and part of the rice region.
Quick check · Sort it
Each card describes a region in a hypothetical place. Tap a card, then the type of region it is.
Formal region
Functional region
Perceptual region
2c. Boundaries that fade, are disputed and overlap
Look closely at a region's edge and it is rarely a clean line.
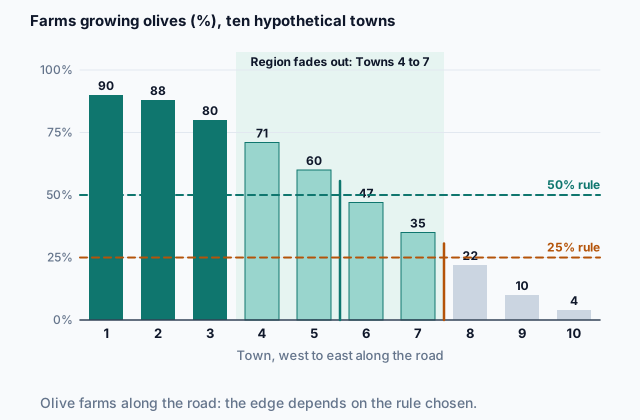
Transitional. Most traits fade out across a zone. The figure shows the ten towns from Think first: the share of farms growing olives falls at every town, with no sudden break.
 Tap to open the picture full size
A 50 percent rule ends the Olive Coast between Towns 5 and 6; a 25 percent rule ends it between Towns 7 and 8. Both are fair maps of the same pattern. Functional regions fade too, as fewer people travel to the node from farther away.
Contested. People can disagree about where a region ends, or whether a place belongs in it at all. Residents argue over where a perceptual region begins, and two groups or governments can each claim the same strip of land.
Overlapping. A place can belong to several regions at once. One town can sit inside a language region, a city's shopping area and an area residents call by an old name, and the edges of those three regions need not line up.
Quick check · Decide and justify
Elm Ford, a hypothetical town, lies between hypothetical City P and hypothetical City Q. About half of Elm Ford's households take City P's daily newspaper, and about half take City Q's. A student says a map of the two newspapers' delivery regions must put Elm Ford in one region or the other. Is the student right?
Which reason supports your answer?
2d. Regions at every scale
Geographers apply regional analysis at every scale. At the local scale, a geographer might divide one city into neighborhoods by the age of their housing, or map a store's delivery area. At the national scale, she might divide a country into farming regions, or map the area residents across the whole country call by one name. At the global scale, she might group the world's countries into regions by main language or by income.
The scale changes what a region shows. On a world map, hypothetical Country T might sit inside one large farming region, colored as a single block. Divide Country T itself into provinces and the same land splits into a wheat region, a cattle region and a forest region. Neither map is wrong; each answers a question asked at its own scale.
So when you read or draw a region, name the scale along with what defines it.
Quick check · Select all
Which two of these studies apply regional analysis at the national scale? Select two.
Select 2 answers, then check.
Part 3 Watch it done Map a city's commuting region
Watch each step, then do the last one yourself.
A geographer is mapping the commuting region of hypothetical City N. A survey gives the share of workers in six nearby hypothetical towns who commute to City N: Town U 62 percent, Town V 48 percent, Town W 35 percent, Town X 18 percent, Town Y 9 percent and Town Z 4 percent. She counts a town as inside the region when at least 25 percent of its workers commute to City N.
Predict first
Before the steps, what type of region do you expect City N's commuting region to be?
Step 1 · Find what ties the region together
The towns do not need to share any trait. What links them is a pattern of activity: workers traveling to jobs in one city. A region defined by flows to a central place is a functional region, and City N is its node.
Step 2 · Apply the rule
Towns U, V and W have 62, 48 and 35 percent, all at least 25, so they are inside. Towns X, Y and Z, at 18, 9 and 4 percent, are outside. The region has 3 towns.
Why this step?
Why does the geographer have to state a cutoff at all?
The share falls from town to town with no sudden break, so the region's boundary is transitional. Some cutoff has to be picked to draw a line, and the map should say which one, so a reader knows the line is a rule and not a wall.
Your step · Calculate
Finish it. A second geographer maps the same commuting region but counts a town as inside when at least 15 percent of its workers commute to City N. How many of the six towns are in her region?
towns
Part 4 Try it Plan a commuter rail line
Hypothetical State W's transport agency is planning a commuter rail line into Port City, a hypothetical city. Before it chooses stops, it gathers data and documents and maps several regions in the state.
Try it · Match
Match each idea about regions to the item in the agency's files that shows it or would be used to draw it.
Try it · Multiple choice
The agency wants the line to serve the people most likely to ride it into Port City on weekday mornings. Which region should it map to choose the stops?
Part 5 Explain it Explain two regions in one country
Nothing you type leaves this page. Check your answer against the model and each scoring point.
Free response is 50% of the exam score. This one is shaped like Question 3, from free-response II.
Free-response practice · Question 3 style
Stimulus 1, hypothetical data: the share of residents of hypothetical Country H who speak Language M at home, by district, for Districts 1 to 10 numbered from west to east: 88, 85, 74, 63, 51, 38, 26, 15, 7 and 5 percent.
Stimulus 2, hypothetical survey results: residents of Country H were asked to draw on a map where the West ends. In Districts 1 and 2, 9 in 10 residents drew the line along the same river, the Tal. In Districts 3 to 7, residents' lines fell in five different districts, and in each of those districts between 40 and 60 percent of residents placed their own district inside the West.
(A) Identify the type of region shown in Stimulus 1.
(B) Describe the boundary of the Language M region shown in Stimulus 1.
(C) Identify the type of region shown in Stimulus 2.
(D) Explain why the boundary of the West in Stimulus 2 is contested.
(E) Compare how the region in Stimulus 1 and the region in Stimulus 2 are defined.
(F) Describe one functional region a geographer could draw in Country H, and name its node.
(G) Explain how the Language M region could look different if Country H were studied in a regional analysis at the global scale.
Model answer
(A) A formal region. It is defined by one characteristic its districts share, speaking Language M at home.
(B) The boundary is transitional. From District 2 to District 8 the share falls by 11 to 13 points at every step, with no sudden drop, so the region fades out across a band of middle districts instead of ending at one line. Where a map draws the line depends on the cutoff the mapmaker picks.
(C) A perceptual, or vernacular, region. The West is defined by what residents believe about where they live.
(D) The West is a perceptual region, so its edge rests on each resident's sense of place, and residents of Districts 3 to 7 do not share one. Their lines fall in five different districts, and in each of those districts residents split close to half and half on whether they live in the West. People disagree about where the region ends and which districts belong to it, so its boundary is contested.
(E) The Language M region is defined by a trait its districts share, the language people speak at home, so two geographers using the same cutoff draw the same edge. The West is defined by residents' beliefs about where they live, so even though the survey turns those beliefs into numbers, its edge depends on whom you ask. Both regions blur across the middle districts.
(F) The commuting region of Country H's capital: the districts where many workers travel to jobs in the capital, with the capital as the node.
(G) At the global scale, Country H might appear as one unit, shaded by the language most of its people speak, inside a larger world region. The steady change across its middle districts would not show, because the global map does not divide Country H into districts.
Score your own answer. This is a self-check, not a grade. Tick each point your answer makes.
Part 6 Check yourself The districts east of Country K's capital
The case questions use the table. The others mix the ideas from the whole lesson.
A geographer collected three kinds of data for six hypothetical districts, A to F, along a highway running east from the capital of hypothetical Country K. District A is closest to the capital and District F is farthest. All numbers are made up.
| District | Distance from the capital (km) | Speak Language L at home (%) | Workers who commute to the capital (%) | Residents who say they live in the Valley (%) |
|---|---|---|---|---|
| A | 15 | 88 | 64 | 81 |
| B | 35 | 76 | 41 | 77 |
| C | 60 | 62 | 22 | 70 |
| D | 90 | 47 | 9 | 52 |
| E | 120 | 31 | 4 | 31 |
| F | 150 | 15 | 1 | 12 |
Case question 1 · Multiple choice
The geographer draws three regions from the table, one for each of the last three columns, counting a district as inside a region when its value in that column is above 50 percent. Which statement best describes the three regions?
Case question 2 · Fill the statement
Complete the reading of Country K's table.
The share who speak Language L falls by 12 to 16 points from each district to the next, so the language region's boundary is . Counting a district as inside a region when its value is above 50 percent, District D is inside only the region, and District A is the only district inside the region.
Case question 3 · Multiple choice
What does the column on the Valley show about the Valley as a region?
The rest stand on their own and do not use the case.
Check yourself · Spot the error
A student describes regions in hypothetical Country P. Which line is the first to go wrong?
Check yourself · Rank it
A geographer studies coffee in four ways. Rank the four studies by the scale of their regional analysis.
Local scale first, global scale last; studies at the same scale share a place
Give each one a place, 1 for first. Give two the same place if they are equal.
Your ranking: none yet
Part 7 Keep it Bring back earlier ideas
This lesson stands on scales of analysis from Topic 1.6 and on Topic 1.5.
From 1.6 Scales of Analysis · Calculate
Hypothetical Country L has three provinces. Province A has 1,000,000 workers, and 4% of them are unemployed. Province B has 1,000,000 workers, and 6% are unemployed. Province C has 2,000,000 workers, and 15% are unemployed. What percent of all of Country L's workers are unemployed?
From 1.5 Human–Environmental Interaction · Fill the statement
Two geographers explain the farming of hypothetical Valley M, which has a short, cool growing season. Complete the passage.
Geographer 1 writes that the cool climate decided the valley's whole way of life, down to its people's patient character. That claim is . Geographer 2 writes that the climate rules out some crops, but the farmers chose which of the others to grow and later added greenhouses. That claim is . In the history of geography, the view of Geographer came first.
In three lines
- A region is an area tied together by one or more shared characteristics or by a pattern of activity.
- Formal regions rest on a shared trait, functional regions on flows to a node, and perceptual or vernacular regions on people's sense of a place.
- Regional boundaries fade, are often disputed and overlap, and regional analysis works at the local, national and global scales.
Exam strategy for this topic
- Section I, Multiple Choice: 60 questions in 60 minutes.
- Section II, Free Response: 3 questions in 75 minutes.
When a question shows or describes a region, say what defines it before you name its type, and when the data change gradually near its edge, describe the boundary as transitional rather than as a line.
Questions students ask
Is a region real, or does a geographer make it up?
Both. The traits and flows a region is built on are real, but the geographer chooses which ones to use and where to draw the edge. That is why a map of a region should say what defines it.
Are perceptual and vernacular regions the same thing?
Yes. Both names mean a region defined by people's shared sense of a place rather than by a shared trait or a flow.
How do I tell a formal region from a functional one?
Ask what holds it together. A trait the area's places share, such as a language or a crop, makes a formal region. Movement of people, goods or information to and from a central place, its node, makes a functional region.
Why do two maps of the same region disagree?
Regional boundaries are transitional and often contested, so two mapmakers who choose different cutoffs, or ask different people, draw different edges. Neither map is wrong if each says how it drew the line.
Are the places in this lesson real?
No. Every country, state, city, town, district and region here is hypothetical, with numbers made up to show each idea clearly.
Course alignment, for teachers
AP Human Geography topic 1.7, Unit 1: Thinking Geographically.
- Skill 1.A: Describe geographic concepts, processes, models, and theories.
This lesson maps all 4 essential knowledge statements of the topic to the part that teaches each one: 4 are checked by a scored question. The map is in the lesson file.