Unit 2 · Topic 2.1 · about 30 minutes · 7 parts · 14 scored checks, 3 of them multiple choice
AP Human Geography 2.1: Population Distribution
Unit 2: 12 to 17% of the multiple-choice section
What you'll be able to do
- Identify the physical and human factors that influence where people live, and how the factors that explain the pattern change from one scale of analysis to another.
- Define and calculate arithmetic, physiological and agricultural density from a country's population, land, arable land and farmers.
- Explain how the three density measures differ, and what each one shows about the pressure a population puts on its land.
Key vocabulary
| Term | What it means | The exam trap |
|---|---|---|
| Population distribution | The pattern of where people live across an area. | Distribution is about where people are, which a density figure alone does not show. |
| Arithmetic density | The total population divided by the total land area. | It is the simplest of the three, so check which one a question names before you divide. |
| Physiological density | The total population divided by the area of arable land. | Say which two numbers you divided, so a reader can tell it from the other densities. |
| Agricultural density | The number of farmers divided by the area of arable land. | Read the question for which people it counts before you pick the top of the fraction. |
| Arable land | Land that can be used to grow crops. | It is a part of a country's land, never more than the whole. |
| Scale of analysis | The size of the area a geographer studies, such as global, regional, national or local. | Name the scale of the pattern before you explain it. |
 Tap to open the picture full size
Part 1 Think first Which country is more crowded?
Commit to a guess first. Being wrong now makes the right idea stick better.
Predict first
Hypothetical Countries K and L each have 30,000,000 people and 300,000 square kilometers of land, so each has 100 people for every square kilometer. A farm adviser who has worked in both says Country K's farmland is far more crowded than Country L's. How can both facts be true?
In short. Population distribution is where people live across an area, and population density is how many people live on each unit of land, measured three ways that each show a different kind of pressure on the land.
- Physical factors such as climate, landforms and water, and human factors such as jobs, history, government and culture, explain why people cluster in some places and avoid others.
- The factors that explain the pattern change with scale: climate and landforms at the global scale, a port or a coastal plain at the national scale, and the location of jobs inside a single city at the local scale.
- Arithmetic density divides all the people by all the land, physiological density divides all the people by the arable land, and agricultural density divides only the farmers by the arable land.
Part 2 Learn it Where people live, and how crowded they are
2a. Why people cluster
Population distribution is the pattern of where people live. People are not spread evenly. They cluster in some places and leave others nearly empty, and the reasons fall into two groups.
Physical factors come from the natural environment. Climate matters: very dry, very cold or very hot places hold few people. Landforms matter: steep mountains are hard to farm and build on, while flat plains are easy. Water bodies matter: rivers and coasts give drinking water, fertile soil, fishing and easy transport.
Human factors come from people's choices and the past. Economics: people move to where the jobs are. History: an old port or trading town keeps growing long after the reason it started has faded. Politics: a government can build a new capital, open land to settlers or close a border. Culture: a shrine or a holy city can draw a large population.
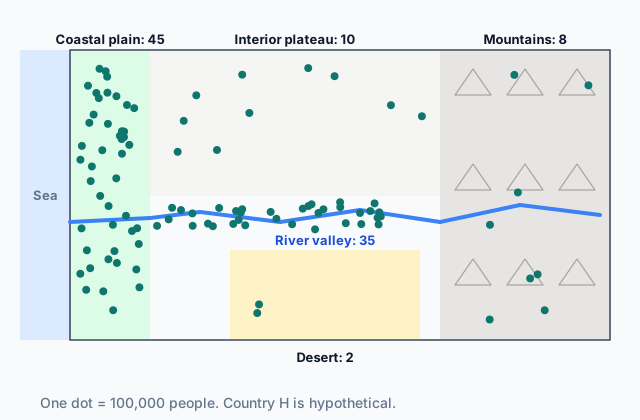
The map at the top of the page shows hypothetical Country H. Most of its people live on the coastal plain or along the river, and very few live in the mountains or the desert.
Quick check · Sort it
Each card explains part of where people live in a hypothetical country. Tap a card, then the kind of factor it describes.
Physical factor
Human factor
2b. The pattern changes with scale
The factors that explain where people live depend on the scale you look at.
At the global scale, the big empty areas line up with physical factors: ice sheets, deserts, high mountains. At the regional scale, a few neighboring countries may share a crowded river basin or coastline. At the national scale, both kinds matter: physical ones such as a coastal plain or a dry interior, and human ones such as a capital city, an old port or a government plan to settle the interior. At the local scale, inside one town, people cluster along bus and rail lines, near jobs, and where housing is cheap enough to afford.
Take Country H again. At the national scale, the coastal plain is crowded and the plateau is not, and climate and water explain much of it. Zoom in to one coastal city and the climate is the same everywhere, so it cannot explain why one neighborhood is packed and the next is not. You need factors that change from street to street, such as rents, transit and where the jobs are.
A factor that explains a pattern at one scale may explain nothing at another. Before you name a factor, ask what scale the pattern is at.
Quick check · Match
A geographer explains where people live at four scales of analysis. Match each scale to the pattern and factor that best fit it.
2c. Three ways to measure density
Population density is people per unit of land. There are three ways to calculate it, and they differ in what goes on the top and bottom of the fraction.
- Arithmetic density = total population ÷ total land area.
- Physiological density = total population ÷ arable land area. Arable land is land that can grow crops.
- Agricultural density = number of farmers ÷ arable land area.
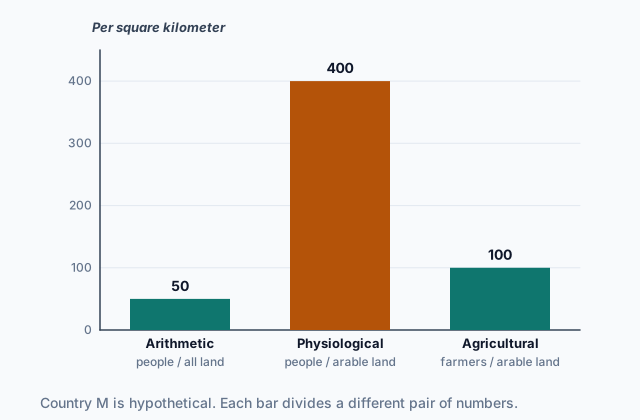
The chart shows hypothetical Country M: 20,000,000 people on 400,000 square kilometers, of which 50,000 square kilometers are arable, with 5,000,000 farmers.
 Tap to open the picture full size
Two of the three use arable land on the bottom, and only one, agricultural density, counts farmers instead of everyone. Before you divide, say which density you want and pick its two numbers.
Quick check · Calculate
Hypothetical Country N has 36,000,000 people, 600,000 square kilometers of land, 45,000 square kilometers of arable land and 9,000,000 farmers. What is its physiological density, in people per square kilometer of arable land?
2d. What each density shows
Each density answers a different question about the pressure people put on the land.
Arithmetic density tells you how many people there are for the country's size. It is easy to find, but it spreads people evenly over deserts, mountains and cities alike, so it hides where the crowding actually is. In Country M, 50 people per square kilometer sounds light.
Physiological density tells you how many people each square kilometer of farmland must feed. Country M's is 400, eight times its arithmetic density, because only an eighth of its land is arable. A high physiological density warns that the farmland is under pressure: the country may need to farm very intensively or import food.
Agricultural density tells you how many farmers work each square kilometer of farmland, which says something about how farming is done. A high agricultural density means many farmers on small plots, often with hand tools and little machinery, as in many less developed economies. A low one means fewer farmers working large areas with machines, as in many more developed economies.
A big gap between arithmetic and physiological density means most of the land cannot be farmed.
Quick check · Fill the statement
Complete what a geographer concludes from two hypothetical countries' densities.
Country E's physiological density is ten times its arithmetic density, so most of its land is . Country F and Country G have the same physiological density, but Country F's agricultural density is much lower, so its farms most likely use than Country G's. For each square kilometer of arable land, Country F has Country G does.
Part 3 Watch it done Three densities for one country
Watch each step, then do the last one yourself.
Hypothetical Country P has 12,000,000 people, 300,000 square kilometers of land, 20,000 square kilometers of arable land and 1,000,000 farmers. Work out all three densities and say what each one shows.
Predict first
Before the steps, which of Country P's three densities do you expect to be the largest number?
Step 1 · Arithmetic density
All the people over all the land: 12,000,000 ÷ 300,000 = 40 people per square kilometer.
Step 2 · Physiological density
All the people over the arable land: 12,000,000 ÷ 20,000 = 600 people per square kilometer of arable land. That is 15 times the arithmetic density, because only 1 square kilometer in 15 can grow crops.
Why this step?
Why does a planner worried about Country P's food supply look at 600 instead of 40?
Food grows only on arable land. The 40 spreads people over deserts and mountains that grow nothing; the 600 is how many people each square kilometer of farmland actually has to feed.
Your step · Calculate
Finish it. What is Country P's agricultural density, in farmers per square kilometer of arable land? Country P has 12,000,000 people, 300,000 square kilometers of land, 20,000 square kilometers of arable land and 1,000,000 farmers.
farmers per square km of arable land
Part 4 Try it Measure the pressure on farmland
Try it · Decide and justify
Hypothetical Country R's planners are worried that its farmland will not be able to feed a growing population. They can track one density figure each year. Which should they track?
Which reason supports your answer?
Try it · Rank it
Four hypothetical countries report their population, land area and arable land. Rank them by physiological density. Work out each one before you rank.
Highest physiological density first
Give each one a place, 1 for first. Give two the same place if they are equal.
Your ranking: none yet
Part 5 Explain it Explain a country's population pattern
Nothing you type leaves this page. Check your answer against the model and each scoring point.
Free response is 50% of the exam score. This one is shaped like Question 1, from free-response II.
Free-response practice · Question 1 style
In hypothetical Country W, most people live on a narrow, rainy coastal plain, where the capital and the main port are. The interior is a dry plateau, and high mountains run along the eastern border. About one-tenth of the country's land is arable, almost all of it on the coastal plain.
(A) Identify one physical factor that explains why few people live in Country W's interior.
(B) Identify one human factor that helps explain why so many people live near the capital.
(C) Define arithmetic density.
(D) Explain why Country W's physiological density is much higher than its arithmetic density.
(E) Explain how agricultural density shows something about Country W's farms that physiological density does not.
(F) Describe one factor that could explain where people cluster inside Country W's capital, at the local scale.
(G) Explain one limitation of arithmetic density for describing the pressure Country W's population puts on its land.
Model answer
(A) The dry climate: with little rain, the plateau is hard to farm and short of water. The high mountains along the border are another answer.
(B) Jobs: the capital holds the government offices and the main port, so it offers work that the interior does not. History is another answer, if the port was the country's first big town.
(C) Arithmetic density is the total population divided by the total land area.
(D) Physiological density divides the population by the arable land only. Only about a tenth of Country W's land is arable, so the same people divided by a tenth of the land gives a density about ten times higher.
(E) Agricultural density counts only the farmers on each square kilometer of arable land. It shows how farming is done: a high figure means many farmers on small plots with little machinery, a low one means fewer farmers using machines. Physiological density counts everyone, so it shows how many people the farmland feeds, not how it is farmed.
(F) People may cluster along the bus and rail lines, where getting to work is easier, or in neighborhoods where rents are low enough to afford.
(G) It spreads the population evenly over the dry plateau and the mountains, where almost no one lives and nothing is farmed. So it makes Country W look less crowded than the coastal plain really is, and it hides the pressure on the small area of farmland.
Score your own answer. This is a self-check, not a grade. Tick each point your answer makes.
Part 6 Check yourself Countries X and Y
The case questions use the table. The others mix the ideas from the whole lesson.
Two hypothetical countries have the same population. Country X is large, dry and mostly desert, with farms along one river. Country Y is smaller and has rich soil across much of its land.
| Country X | Country Y | |
|---|---|---|
| Population | 40,000,000 | 40,000,000 |
| Land area | 800,000 square km | 400,000 square km |
| Arable land | 40,000 square km | 160,000 square km |
| Farmers | 2,000,000 | 16,000,000 |
Case question 1 · Multiple choice
Which statement best compares the pressure each country's population puts on its farmland?
Case question 2 · Calculate
What is Country Y's agricultural density, in farmers per square kilometer of arable land?
Case question 3 · Multiple choice
Work out each country's agricultural density from the table. What does the difference most likely show about farming in the two countries?
The rest stand on their own and do not use the case.
Check yourself · Spot the error
A student works out the densities of hypothetical Country Z. Which line is the first to go wrong?
Check yourself · Select all
At the national scale, hypothetical Country H's people crowd onto its coastal plain, where the climate is mild and rain is reliable. A geographer then studies one coastal city at the local scale. Which two factors are most likely to explain where people cluster inside that city? Select two.
Select 2 answers, then check.
Part 7 Keep it Bring back earlier ideas
This lesson stands on regions from Topic 1.7 and spatial concepts from Topic 1.4.
Bring it back · Multiple choice
Hypothetical City D's daily newspaper is delivered each morning to the homes in its delivery area. What type of region is the delivery area?
Bring it back · Fill the statement
Two observations from a hypothetical region.
Fewer shoppers come to a market the farther away they live, an example of . A new high-speed rail line cuts the trip between two cities from four hours to one, so the cities feel closer, an example of .
In three lines
- People cluster for physical reasons (climate, landforms, water) and human ones (jobs, history, government, culture).
- The factors that explain where people live change with scale, so name the scale before you name a factor.
- Arithmetic density is people over all land, physiological is people over arable land, and agricultural is farmers over arable land.
Exam strategy for this topic
- Section I, Multiple Choice: 60 questions in 60 minutes.
- Section II, Free Response: 3 questions in 75 minutes.
When a question gives population and land figures, write the fraction for the density it names before you divide, and give the units. When it asks what a density shows, say what kind of pressure it measures, not only whether it is high or low.
Questions students ask
What is the difference between physiological and agricultural density?
Both divide by arable land. Physiological density counts the whole population, so it shows how many people the farmland feeds. Agricultural density counts only farmers, so it shows how the land is worked.
Why not just use arithmetic density?
It is easy to find and to compare, but it spreads people over every square kilometer, including deserts and mountains where almost no one lives. The other two show the pressure on the land that grows food.
Are physical factors more important than human factors?
Neither always wins. Physical factors explain many of the world's empty areas, but human factors such as jobs, government decisions and history explain a great deal of where people cluster inside a country or a city.
What counts as arable land?
Land that can grow crops. Pasture used only for grazing, forests, deserts, mountains and built-up land are not counted as arable in these measures.
Are the countries in this lesson real?
No. Every country, region and figure here is hypothetical, with numbers chosen to show each idea clearly. Real countries' densities come from their census and land surveys.
Course alignment, for teachers
AP Human Geography topic 2.1, Unit 2: Population and Migration Patterns and Processes.
- Skill 3.A: Identify the different types of data presented in maps and in quantitative and geospatial data.
This lesson maps all 4 essential knowledge statements of the topic to the part that teaches each one: 4 are checked by a scored question. The map is in the lesson file.