Unit 2 · Topic 2.3 · about 30 minutes · 7 parts · 14 scored checks, 3 of them multiple choice
AP Human Geography 2.3: Population Composition
Unit 2: 12 to 17% of the multiple-choice section
What you'll be able to do
- Describe age structure and sex ratio as elements of population composition, and how their patterns vary across regions and at different scales.
- Explain how geographers depict population composition in population pyramids and use them to assess growth and decline and to predict markets for goods and services.
Key vocabulary
| Term | What it means | The exam trap |
|---|---|---|
| Population composition | The makeup of a population, such as its age structure and sex ratio. | Composition is about who the people are, which a population total alone cannot show. |
| Age structure | How a population divides among age groups. | Read every age group before describing it, not only the youngest or oldest. |
| Sex ratio | The number of males for every 100 females in a population. | Check which group goes on top before you divide. |
| Population pyramid | A pair of back-to-back bar charts showing a population by age group and sex. | Check whether the bars show counts or percents before comparing two pyramids. |
| Cohort | A group of people born in the same span of years, who age together. | A cohort moves up the pyramid as it ages; deaths shrink it, and migration can shrink it or grow it. |
 Tap to open the picture full size
Part 1 Think first Two towns, two stores
Commit to a guess first. Being wrong now makes the right idea stick better.
Predict first
Hypothetical Towns A and B each have 20,000 people. In Town A, 35 percent of residents are under 15. In Town B, 30 percent are 65 or older. A company will open one new business in each town. Which plan fits the towns best?
In short. Population composition is the makeup of a population, above all its age structure and its sex ratio, and geographers map it at different scales and read it from population pyramids to see whether a population is growing or shrinking and what it will need.
- Age structure is how a population divides among age groups, and sex ratio is the number of males for every 100 females.
- Both vary from place to place: work camps, retirement areas, college towns and places that young people leave each have their own composition, and a national figure can hide all of them.
- A population pyramid's shape shows growth or decline, and because each age group moves up the pyramid over time, it lets planners and businesses predict demand for schools, jobs, housing and health care.
Part 2 Learn it Who lives in a place
2a. Age structure and sex ratio
Population composition is the makeup of a population. Two parts of it come up again and again.
Age structure is how a population divides among age groups: what share are children, working-age adults and older people. A town where a third of the people are children has different needs from one where a third are retired.
Sex ratio is the number of males for every 100 females:
sex ratio = (males ÷ females) × 100
A ratio of 100 means equal numbers. Above 100 means more males; below 100 means more females. A town of 9,000 males and 10,000 females has a sex ratio of 90.
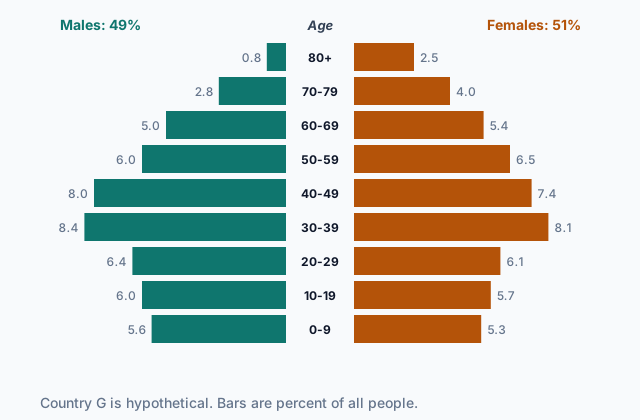
The pyramid at the top of the page shows both for hypothetical Country G. Each bar is a share of the whole population, males on the left and females on the right. Overall the country is 49 percent male and 51 percent female. Look at the oldest groups: at 80 and over, the female bar is about three times the male bar. In most places women live longer than men on average, so sex ratios fall in old age.
Quick check · Calculate
A hypothetical mining town has 13,200 male residents and 12,000 female residents. What is its sex ratio?
2b. Patterns across regions and scales
Age structure and sex ratio change from place to place, and the reasons are usually about who moves in, who moves out and how long people live.
A region with oil fields, mines or large building projects draws young men for the work, so its sex ratio climbs well above 100. A region that many men leave to work abroad has the opposite: a sex ratio below 100, with women, children and older people left behind. A college town is full of people aged 18 to 22. A coastal area that attracts retirees is old. A rural area that its young adults leave for the cities grows older year by year, even if no one new arrives.
These patterns depend on scale. A country's sex ratio may be 100 and its median age 35, which looks unremarkable. Map the same census by state or district and you may find an old, mostly female countryside, a young capital and a mining region full of men. Map it by neighborhood and a single city can hold both a student district and a retirement community. A pattern can vanish at one scale and stand out at another, so geographers map composition at several scales before they explain it.
Quick check · Sort it
Each card describes a hypothetical place. Tap a card, then the sex ratio it most likely has.
Above 100: more males
Below 100: more females
2c. Reading a population pyramid
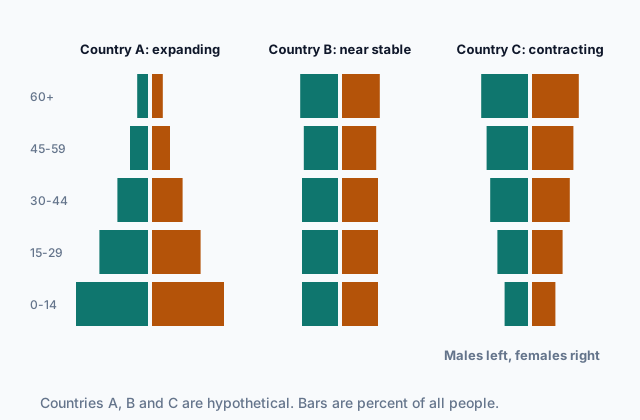
A population pyramid is a pair of bar charts back to back: age groups from youngest at the bottom to oldest at the top, males on one side and females on the other. Its shape tells you whether the population is growing or shrinking.
 Tap to open the picture full size
Country A's wide base means many births: each new group of children is larger than the one before, so the population grows fast. Country B's straight sides mean births have been steady for a long time, so it grows slowly or not at all. Country C's base is narrower than the bars above it: fewer children are being born than in the past, so in time fewer adults will have children of their own, and decline lies ahead unless people move in.
Bulges and notches tell stories too. A bulge is a past baby boom or a wave of migrants; a notch can mark a war, a famine or a time of very low births. A bulge on one side only, such as extra men aged 20 to 39, points to migration for work.
Quick check · Match
Match each feature of a hypothetical country's population pyramid to what it most likely shows.
2d. Pyramids for planning
A population pyramid is also a forecast. The people in each bar get older together, a group geographers call a cohort, and in ten years every cohort moves up one ten-year bar. So a pyramid tells you, years ahead, how many children will start school, how many young adults will look for work and how many people will reach retirement.
In Country G, the largest cohort today is ages 30 to 39. In 20 years they will be 50 to 59, and in 30 years 60 to 69, so demand for health care, retirement housing and pensions will rise as they age. The groups below them are smaller, so fewer workers will follow them into the labor force.
Governments use pyramids to plan schools, hospitals and pensions. Businesses use them to predict markets for goods and services: a company selling baby products looks for a wide base, a home builder for a large cohort in its late twenties and thirties, a home care company for large older groups. The same pyramid helps a city decide whether to build a school or close one.
Quick check · Fill the statement
Complete the forecast for a hypothetical city whose pyramid has its largest bar at ages 10 to 14.
In ten years, the people in the city's largest bar will be ages , so the city should expect more demand for . If the city's bottom bar, ages 0 to 4, is the smallest of all, then in about five years, when those children are 5 to 9, its elementary schools will have students.
Part 3 Watch it done How many homes will a cohort need?
Watch each step, then do the last one yourself.
Hypothetical City T's population pyramid shows 12,000 people aged 50 to 54, 9,000 aged 55 to 59 and 7,000 aged 65 to 69. A company that builds retirement housing finds that about 1 in every 20 people aged 65 to 69 moves into such housing. Leaving aside deaths and migration, how many units will people aged 65 to 69 want in City T fifteen years from now?
Predict first
Before the steps, which of today's bars will be the 65 to 69 group fifteen years from now?
Step 1 · Move the cohort up
In fifteen years everyone is fifteen years older, three five-year bars up the pyramid. The people aged 65 to 69 then are the people aged 50 to 54 today: 12,000 of them.
Why this step?
Why use today's 50 to 54 bar instead of today's 65 to 69 bar?
Today's 65 to 69 group will be 80 to 84 in fifteen years. A pyramid predicts a future market by following the cohort that will be the right age when the market arrives.
Step 2 · Set up the last step
About 1 in 20 people aged 65 to 69 wants a unit, so divide the cohort by 20.
Your step · Calculate
Finish it. Fifteen years from now, City T's people aged 65 to 69 will be the 12,000 people aged 50 to 54 today, and about 1 in 20 people that age moves into retirement housing. How many units will they want?
units
Part 4 Try it Read the makeup of four regions
Try it · Decide and justify
In hypothetical Region D, the sex ratio is 101 for children under 15 and 140 for adults aged 20 to 39. Which explanation fits these figures better?
Which reason supports your answer?
Try it · Rank it
Four hypothetical regions report how many males and females live there. Rank them by sex ratio. Work out each one before you rank.
Highest sex ratio first
Give each one a place, 1 for first. Give two the same place if they are equal.
Your ranking: none yet
Part 5 Explain it Explain what Country G's pyramid shows
Nothing you type leaves this page. Check your answer against the model and each scoring point.
Free response is 50% of the exam score. This one is shaped like Question 2, from free-response II.
Free-response practice · Question 2 style
Use the population pyramid of hypothetical Country G at the top of this page.
(A) Identify the youngest ten-year age group in which Country G's female bar is longer than its male bar.
(B) Describe how the numbers of males and females compare at ages 80 and over, and explain one reason for the difference.
(C) Explain what the bars below age 30 show about births in Country G in recent decades.
(D) Explain whether Country G's population is more likely to grow or to decline over the next fifty years if no one moves in or out.
(E) Explain one good or service that will be in greater demand in Country G in thirty years, using the pyramid.
(F) Describe how Country G's age structure might differ between its capital and its rural districts.
(G) Explain one limitation of a single national pyramid for planning services in Country G.
Model answer
(A) Ages 50 to 59, 6.0 percent male and 6.5 percent female. In every younger group the male bar is longer.
(B) There are about three times as many women as men at 80 and over, 2.5 percent against 0.8 percent. Women live longer than men on average.
(C) Each younger group is smaller than the one above it, so fewer babies have been born each decade than the decade before.
(D) More likely to decline. The groups now having children are followed by smaller groups, so births will keep falling while the large cohort ages and deaths rise.
(E) Health care, retirement housing or pensions: the large cohort now aged 30 to 39 will be 60 to 69 in thirty years.
(F) The capital is likely younger, with more people in their twenties and thirties who moved there for work and school; rural districts are likely older, because young adults left them.
(G) A national pyramid averages every district together, so it hides an old rural district that needs clinics and a young city district that needs schools. Services are planned place by place.
Score your own answer. This is a self-check, not a grade. Tick each point your answer makes.
Part 6 Check yourself Two districts of Country Z
The case questions use the table. The others mix the ideas from the whole lesson.
Hypothetical Country Z's census reports the age structure and sex ratio of two districts: District N, around the capital, and District S, a rural district 300 km away. Each has 250,000 people.
| Age group | District N | District S |
|---|---|---|
| 0 to 14 | 18% | 14% |
| 15 to 29 | 30% | 10% |
| 30 to 44 | 26% | 14% |
| 45 to 64 | 18% | 30% |
| 65 and over | 8% | 32% |
| Sex ratio | 104 | 90 |
Case question 1 · Multiple choice
Which statement best describes and explains how the two districts' age structures differ?
Case question 2 · Calculate
District S has 250,000 people. How many of them are 65 or older?
Case question 3 · Multiple choice
A business is choosing what to open in District S over the next ten years. Using the table, which market is most likely to grow there?
The rest stand on their own and do not use the case.
Check yourself · Spot the error
A student reads the pyramid of hypothetical Country C, which has 13, 17, 21, 23 and 26 percent of its people in the groups 0 to 14, 15 to 29, 30 to 44, 45 to 59 and 60 and over. Which line is the first to go wrong?
Check yourself · Select all
A company studies a hypothetical city's population pyramid to plan its products. Which two predictions can the pyramid support? Select two.
Select 2 answers, then check.
Part 7 Keep it Bring back earlier ideas
This lesson stands on carrying capacity from Topic 2.2 and regional boundaries from Topic 1.7.
Bring it back · Multiple choice
For years, the fishing villages of hypothetical Island R have caught more fish than the reef's fish populations can replace, and each year's catch is now smaller than the last. What does this show?
Bring it back · Fill the statement
Two boundaries of regions in a hypothetical country.
Wheat fields thin out gradually into cattle ranches over about 100 km, so the edge of the wheat-farming region is . Two neighboring countries both claim a river valley on their border, so the boundary there is .
In three lines
- Age structure is how a population divides by age, and sex ratio is males per 100 females.
- Both vary by region and by scale, shaped by migration and by how long people live.
- A pyramid's base shows growth or decline, and moving each cohort up the pyramid predicts future markets.
Exam strategy for this topic
- Section I, Multiple Choice: 60 questions in 60 minutes.
- Section II, Free Response: 3 questions in 75 minutes.
When a question gives a population pyramid, describe its shape from the bottom up, then say what it means for growth and for a specific need, such as schools, jobs or health care, and name the age group you are reading.
Questions students ask
What is a normal sex ratio?
Slightly more boys than girls are born, so sex ratios at birth are a little above 100. Over a lifetime the ratio falls, because women live longer on average, so older groups usually have more women.
Do population pyramids show numbers or percents?
Either. Percents make it easy to compare places of different sizes; counts show how many people there actually are. Read the axis before comparing two pyramids.
Why does a narrow base mean decline ahead, even if the population is still growing today?
The children at the base are the parents of the future. If each new group is smaller, there will be fewer people to have children later, so births fall further, and in time deaths outnumber them unless people move in.
How far ahead can a population pyramid predict?
For people already born, a pyramid shows how many will reach each age, so it can look decades ahead, adjusted for deaths and migration. For children not yet born, it can only suggest a trend from the number of people at the ages of having children.
Are the places in this lesson real?
No. Every country, region, district and town here is hypothetical, with numbers chosen to show each idea clearly.
Course alignment, for teachers
AP Human Geography topic 2.3, Unit 2: Population and Migration Patterns and Processes.
- Skill 2.A: Describe spatial patterns, networks, and relationships.
This lesson maps all 2 essential knowledge statements of the topic to the part that teaches each one: 2 are checked by a scored question. The map is in the lesson file.