Unit 2 · Topic 2.4 · about 30 minutes · 7 parts · 14 scored checks, 3 of them multiple choice
AP Human Geography 2.4: Population Dynamics
Unit 2: 12 to 17% of the multiple-choice section
What you'll be able to do
- Explain the factors behind past and present population growth and decline: how fertility, mortality and migration set a population's change, how the rate of natural increase and the doubling time measure it, and how social, cultural, political and economic conditions move each rate.
Key vocabulary
| Term | What it means | The exam trap |
|---|---|---|
| Fertility | Births in a population, measured by the crude birth rate and the total fertility rate. | The two measures answer different questions, one about a single year and one about a lifetime, so check which one a table gives. |
| Mortality | Deaths in a population, measured by the crude death rate and, for babies, the infant mortality rate. | The infant mortality rate is per 1,000 live births, not per 1,000 people, so it cannot be subtracted from a birth rate. |
| Migration | People moving into a place, immigrants, or out of it, emigrants; net migration is immigrants minus emigrants. | Immigrant and emigrant describe the same move from its two ends, so one person is both. |
| Crude birth rate | The number of live births per 1,000 people in a year. | It counts births against the whole population, men and children included, so it is not the number of children per woman. |
| Total fertility rate | The average number of children a woman would have in her lifetime if this year's birth rates for each age held. | It is worked out from this year's rates, not counted from any real woman's children. |
| Rate of natural increase | The crude birth rate minus the crude death rate, usually written as a percent. | It is a rate, so a small country and a large one can share the same value. |
| Doubling time | The number of years a population would take to double if its current growth rate held steady. | It assumes the rate never changes, so read it as a measure of today's growth, not a forecast. |
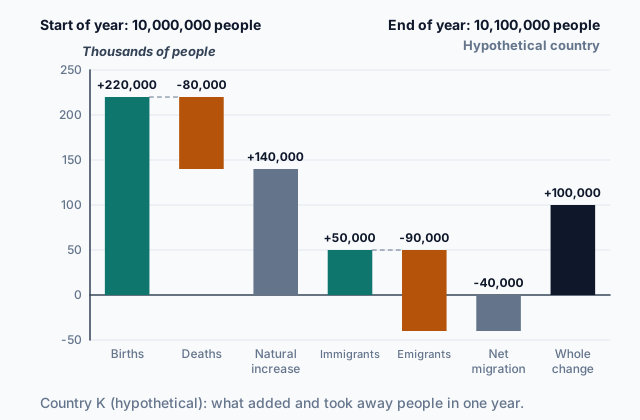 Tap to open the picture full size
Part 1 Think first How long to double?
Commit to a guess first. Being wrong now makes the right idea stick better.
Predict first
A hypothetical town of 10,000 people grows by 2 percent every year, and the rate never changes. About how long will it take to reach 20,000 people?
In short. Population dynamics is how a population grows or shrinks: births, deaths and migration set the change, the rate of natural increase and the doubling time measure how fast it happens, and the conditions people live in push each rate up or down.
- A population changes by births minus deaths, its natural increase, plus immigrants minus emigrants, its net migration.
- The rate of natural increase is the crude birth rate minus the crude death rate, per 1,000 people, written as a percent; 70 divided by that percent gives the doubling time in years.
- Fertility, mortality and migration rates differ between places because of social, cultural, political and economic conditions, such as schooling, religion, government policy and the cost of raising children.
Part 2 Learn it What makes a population grow or shrink
2a. Three ways a population changes
Only three things change the number of people in a place. People are born, people die, and people move in or out. Geographers call these fertility, mortality and migration.
- Fertility is about births. The crude birth rate counts live births per 1,000 people in a year. The total fertility rate is the average number of children a woman would have in her lifetime at today's rates. About 2.1 children per woman, the replacement level, keeps a population the same size over the long run if no one moves in or out.
- Mortality is about deaths. The crude death rate counts deaths per 1,000 people in a year, and the infant mortality rate counts deaths of babies under one year old per 1,000 live births.
- Migration is people moving into a place, immigrants, or out of it, emigrants.
Every change in a population, in a village or a whole country, comes through one of the three. A town that is losing people may have plenty of births and few deaths; it may simply be losing more people to other places than it gains.
Quick check · Sort it
Each card describes a change in a hypothetical place. Tap a card, then the factor it changes directly.
Fertility
Mortality
Migration
2b. Adding up the change
Put the three together and you have a population's whole change in a year:
change = (births minus deaths) + (immigrants minus emigrants)
Births minus deaths is natural increase. Immigrants minus emigrants is net migration. Either part can be negative. In the picture at the top of the page, Country K gains 140,000 people by natural increase but loses 40,000 by net migration, so it grows by 100,000.
To compare places of different sizes, use rates per 1,000 people instead of counts. A province of 2,000,000 people with 30,000 births in a year has a crude birth rate of 30,000 ÷ 2,000,000 × 1,000 = 15 per 1,000. A city with 15,000 births sounds like it has half as many, but if it has only 500,000 people its rate is 30 per 1,000, twice the province's.
Watch which part a question asks about. Natural increase leaves migration out, and in some places migration moves more people than births and deaths do.
Quick check · Calculate
Hypothetical Province D starts a year with 600,000 people. During the year it records 9,000 births, 5,000 deaths, 2,000 immigrants and 7,000 emigrants. How many people does it have at the end of the year?
2c. Rate of natural increase and doubling time
The rate of natural increase (RNI) is the crude birth rate minus the crude death rate. Both are per 1,000, so divide the difference by 10 to write it as a percent. A country with 28 births and 8 deaths per 1,000 has 20 more people per 1,000 each year, an RNI of 2.0 percent. A negative RNI means more deaths than births.
The doubling time is the number of years a population would take to double if its growth rate stayed the same. The rule of 70 gives it: divide 70 by the growth rate in percent. At 2.0 percent, 70 ÷ 2.0 = 35 years. At 0.5 percent, it is 140 years.
The rule works because growth builds on itself. Each year's increase is taken from a larger population than the year before, so the doubling time is shorter than 100 divided by the rate.
Geographers use the two measures to compare how fast places are growing now. A doubling time is not a forecast: it assumes the rate never changes, and rates do change, often falling as a country's economy changes.
Quick check · Rank it
Rank these hypothetical countries by doubling time. Work out each country's rate of natural increase first, then use the rule of 70.
Shortest doubling time first
Give each one a place, 1 for first. Give two the same place if they are equal.
Your ranking: none yet
2d. Why the rates differ from place to place
Fertility, mortality and migration rates differ between countries, and between regions of one country, because people live under different conditions.
- Social. Where more girls finish school and more women work outside the home, women tend to marry later and have fewer children. Clinics and clean water lower infant mortality.
- Cultural. Religious teaching and family traditions shape how many children couples want. In some places a preference for sons keeps families having children until a boy is born.
- Political. Governments can encourage or discourage births. Wars raise death rates and push refugees across borders, and border laws let migrants in or keep them out.
- Economic. On family farms children help with the work, so large families pay off. In cities, housing and school cost money, so families get smaller. Jobs and higher wages pull migrants toward growing regions.
The rates also move together. When infant mortality falls, parents no longer need many births to be sure some children grow up, and fertility tends to fall a generation later.
Quick check · Fill the statement
Complete the description of a hypothetical country that is changing.
As work moves from family farms to factories in the cities, children no longer work in the fields and must be housed and schooled, so each child becomes an for parents and the fertility rate . At the same time more girls finish secondary school, which pushes the age at which women have a first child .
Part 3 Watch it done How fast is Country N growing?
Watch each step, then do the last one yourself.
Hypothetical Country N has a crude birth rate of 31 per 1,000 and a crude death rate of 7 per 1,000. Leaving migration aside, find its rate of natural increase and its doubling time.
Predict first
Before the steps, about how long do you expect Country N to take to double?
Step 1 · Subtract the death rate from the birth rate
31 minus 7 is 24, so Country N adds 24 people per 1,000 each year by natural increase.
Step 2 · Write the rate as a percent
24 per 1,000 is 2.4 per 100, so the rate of natural increase is 2.4 percent.
Why this step?
Why divide by 10 to get the percent?
Percent means per 100. A rate per 1,000 counts ten times as many people as the same rate per 100, so 24 per 1,000 is 2.4 per 100.
Your step · Calculate
Finish it. Use the rule of 70 to find Country N's doubling time, in years, to one decimal place.
years
Part 4 Try it Read the causes behind the numbers
Try it · Match
In four hypothetical countries, a rate changed. Match each kind of factor to the change it best explains.
Try it · Decide and justify
Hypothetical Country P has a crude birth rate of 11 and a crude death rate of 9 per 1,000, yet its population grew by 1.5 percent last year. Where did most of that growth come from?
Which reason supports your answer?
Part 5 Explain it Explain a country's changing growth
Nothing you type leaves this page. Check your answer against the model and each scoring point.
Free response is 50% of the exam score. This one is shaped like Question 2, from free-response II.
Free-response practice · Question 2 style
The data below describe hypothetical Country R in 1975 and 2025.
1975: crude birth rate 42 per 1,000; crude death rate 18 per 1,000; total fertility rate 6.1; net migration rate 0 per 1,000.
2025: crude birth rate 17 per 1,000; crude death rate 7 per 1,000; total fertility rate 2.0; net migration rate minus 3 per 1,000.
(A) Identify Country R's rate of natural increase in 1975, as a percent.
(B) Describe how Country R's doubling time changed from 1975 to 2025.
(C) Explain one economic factor that could account for the fall in Country R's birth rate.
(D) Explain one social factor that could account for the fall in Country R's death rate.
(E) Explain why Country R's population grows more slowly in 2025 than its rate of natural increase alone suggests.
(F) Explain one limitation of using a doubling time to predict Country R's future population.
(G) Describe one political factor that could change the number of people leaving Country R.
Model answer
(A) 42 minus 18 is 24 per 1,000, a rate of natural increase of 2.4 percent.
(B) The doubling time grew much longer. In 1975 it was about 70 ÷ 2.4, or 29 years. In 2025 the rate is 17 minus 7, 10 per 1,000 or 1.0 percent, so the doubling time is about 70 years.
(C) As jobs moved from family farms to cities, children stopped adding to family income and started costing money for housing and school, so couples chose fewer children.
(D) Clinics, vaccines and clean water reached more of the country, and more parents learned how to prevent disease at home, so fewer babies and children died.
(E) Net migration is minus 3 per 1,000: more people leave than arrive. That takes 0.3 percent off the 1.0 percent natural increase, so the population grows about 0.7 percent a year.
(F) A doubling time assumes the growth rate stays the same, but Country R's rate fell from 2.4 to 1.0 percent in 50 years, so a doubling time worked out in 1975 would have overstated its growth.
(G) A neighboring government that opens work visas to Country R's citizens would draw more of them abroad, raising emigration.
Score your own answer. This is a self-check, not a grade. Tick each point your answer makes.
Part 6 Check yourself Four countries, four paths
The case questions use the table. The others mix the ideas from the whole lesson.
A geography class compares four hypothetical countries. Every rate is per 1,000 people per year. The net migration rate is immigrants minus emigrants, so a negative number means more people leave than arrive.
| Country | Crude birth rate | Crude death rate | Net migration rate | Total fertility rate |
|---|---|---|---|---|
| W | 36 | 9 | -4 | 4.8 |
| X | 11 | 10 | 7 | 1.6 |
| Y | 19 | 6 | 0 | 2.3 |
| Z | 9 | 13 | -2 | 1.3 |
Case question 1 · Multiple choice
Counting births, deaths and migration together, which country is losing population?
Case question 2 · Calculate
Using the rule of 70, about how many years would Country W take to double by natural increase alone? Give your answer to one decimal place.
Case question 3 · Multiple choice
Which condition would best help explain Country Z's birth rate and total fertility rate?
The rest stand on their own and do not use the case.
Check yourself · Spot the error
A student finds the doubling time of hypothetical Country V, which has a crude birth rate of 26 and a crude death rate of 11 per 1,000. Which line is the first to go wrong?
Check yourself · Select all
Which two changes would raise a hypothetical country's rate of natural increase? Select two.
Select 2 answers, then check.
Part 7 Keep it Bring back earlier ideas
This lesson stands on population pyramids from Topic 2.3 and density from Topic 2.1.
Bring it back · Multiple choice
A population pyramid for a hypothetical county is very wide at the base and narrows quickly toward the top. Which planning need does it most clearly predict?
Bring it back · Fill the statement
Two density measures for hypothetical Country T, where most of the land is desert.
The number of people per square kilometer of all of Country T's land is its density. The number of people per square kilometer of its farmland is its density, and that number is far higher, because so little of the land can be farmed.
In three lines
- Change = (births minus deaths) + (immigrants minus emigrants): natural increase plus net migration.
- Rate of natural increase = (crude birth rate minus crude death rate) ÷ 10, in percent; doubling time is about 70 divided by it.
- Social, cultural, political and economic conditions, from schooling and religion to war and the cost of children, push fertility, mortality and migration up or down.
Exam strategy for this topic
- Section I, Multiple Choice: 60 questions in 60 minutes.
- Section II, Free Response: 3 questions in 75 minutes.
When a table gives birth and death rates per 1,000, subtract, then divide by 10 before you name a growth rate or a doubling time. When it also gives migration, say whether the question asks about natural increase or the whole change.
Questions students ask
Why does the rule of 70 work?
It comes from how growth compounds. A population growing at r percent a year doubles in about 70 ÷ r years, which is close to exact for the growth rates populations actually have. Some books use 69 or 72; the answers differ only a little, by about a year at 2 percent and a few years at 0.5 percent.
What is the difference between the crude birth rate and the total fertility rate?
The crude birth rate counts one year's births per 1,000 people of every age and sex. The total fertility rate estimates how many children an average woman will have in her lifetime. A country with many young adults can have a high crude birth rate even when its total fertility rate is low.
Why is the replacement level about 2.1 children and not 2?
Two children replace their two parents. The extra tenth makes up for children who die before they grow up and for slightly more boys being born than girls. Where many children die young, the replacement level is higher.
Is a doubling time a prediction?
No. It says how long doubling would take if today's rate never changed. Rates do change, so use it to compare how fast places are growing now.
Are the countries and places in this lesson real?
No. Every country, province and town here is hypothetical, with numbers chosen to show each idea clearly. Real countries' rates change from year to year.
Course alignment, for teachers
AP Human Geography topic 2.4, Unit 2: Population and Migration Patterns and Processes.
- Skill 3.C: Explain patterns and trends in maps and in quantitative and geospatial data to draw conclusions.
This lesson maps all 3 essential knowledge statements of the topic to the part that teaches each one: 3 are checked by a scored question. The map is in the lesson file.